
By Afrosapiens, 2851 words

One of the leading theories to explain differences in cognitive test performance between time and place is that intelligence as measured by such tests is affected by exposure to formal schooling and the cognitive demands of a high-technology society (D. Marks, JR. Flynn). One of the strongest evidence for such an effect of schooling on IQ comes from a reform in the Norwegian school system in which an expansion of compulsory schooling was associated with a 3.7 points increase in IQ per additional year of education between pre-reform and post-reform cohorts. In order to test this relationship between years of schooling and commonly reported national IQ averages, I used data from the United Nation’s Development Program to estimate the average IQ of each country’s adult and school-age population. Adult IQs were estimated from mean years of schooling completed by adults aged 25 and older whereas School-population IQs were estimated based on the expected years of schooling that a student is supposed to complete if the enrollment ratios from primary through tertiary education remain constant. All variables were reported in year 2015. Great Britain was chosen as the reference country and assigned a default value of 100 on both variables. For each country, a difference of one year in completed or expected schooling added or removed 3.7 IQ points. Adult IQ and School-age population IQ were averaged to estimate the most probable mean IQ that would be found by randomly reviewing literature without controlling for the age or the health and socio-economic profile of the sampled individuals.
Results
| Country | Main ancestry | School age-Adult IQ average | School age IQ | Adult IQ |
| Australia | West-European | 107 | 115 | 100 |
| Denmark | West-European | 104 | 111 | 98 |
| New Zealand | West-European | 104 | 111 | 97 |
| Iceland | West-European | 103 | 110 | 96 |
| Ireland | West-European | 102 | 109 | 96 |
| Norway | West-European | 101 | 105 | 98 |
| Germany | West-European | 101 | 103 | 100 |
| Netherlands | West-European | 101 | 107 | 95 |
| United States | West-European | 100 | 101 | 100 |
| United Kingdom | West-European | 100 | 100 | 100 |
| Switzerland | West-European | 100 | 99 | 100 |
| Canada | West-European | 100 | 100 | 99 |
| Slovenia | East-European | 100 | 104 | 96 |
| Lithuania | East-European | 99 | 101 | 98 |
| Czech Republic | East-European | 99 | 102 | 96 |
| Estonia | East-European | 99 | 101 | 97 |
| South Korea | North-East Asian | 99 | 101 | 96 |
| Israel | West and Central Asian, North African | 99 | 99 | 98 |
| Sweden | West-European | 98 | 99 | 96 |
| Poland | East-European | 98 | 100 | 95 |
| Finland | East-European | 97 | 103 | 92 |
| France | West-European | 97 | 100 | 94 |
| Japan | North-East Asian | 97 | 96 | 97 |
| Latvia | East-European | 96 | 99 | 94 |
| Belarus | East-European | 96 | 98 | 95 |
| Greece | East-European | 96 | 103 | 90 |
| Hungary | East-European | 96 | 97 | 95 |
| Spain | West-European | 96 | 105 | 87 |
| Hong Kong | North-East Asian | 96 | 98 | 94 |
| Austria | West-European | 96 | 99 | 93 |
| Italy | West-European | 96 | 100 | 91 |
| Slovakia | East-European | 96 | 95 | 96 |
| Argentina | West-European | 95 | 104 | 87 |
| Singapore | North-East Asian | 95 | 97 | 94 |
| Liechtenstein | West-European | 95 | 94 | 97 |
| Russia | East-European | 95 | 95 | 95 |
| Kazakhstan | West and Central Asian, North African | 95 | 95 | 94 |
| Ukraine | East-European | 94 | 96 | 93 |
| Palau | South-East Asian and Polynesian | 94 | 93 | 96 |
| Croatia | East-European | 94 | 96 | 92 |
| Montenegro | East-European | 94 | 96 | 93 |
| Chile | West-European | 94 | 100 | 87 |
| Georgia | West and Central Asian, North African | 94 | 91 | 96 |
| Cyprus | East-European | 93 | 93 | 94 |
| Luxembourg | West-European | 93 | 91 | 95 |
| Malta | West-European | 93 | 94 | 93 |
| Bulgaria | East-European | 93 | 95 | 91 |
| Barbados | Black African | 93 | 96 | 90 |
| Fiji | South-East Asian and Polynesian
South Asian |
93 | 96 | 90 |
| Cuba | West-European | 93 | 91 | 94 |
| Saudi Arabia | West and Central Asian, North African | 93 | 99 | 86 |
| Portugal | West-European | 92 | 101 | 84 |
| Romania | East-European | 92 | 94 | 91 |
| Tonga | South-East Asian and Polynesian | 92 | 93 | 92 |
| Serbia | East-European | 92 | 93 | 91 |
| Belgium | West-European | 91 | 90 | 93 |
| Sri Lanka | South Asian | 91 | 91 | 91 |
| Mongolia | North-East Asian | 91 | 91 | 87 |
| Grenada | Black African | 90 | 98 | 83 |
| Mauritius | South Asian | 90 | 96 | 84 |
| Uzbekistan | West and Central Asian, North African | 90 | 85 | 95 |
| Uruguay | West-European | 90 | 97 | 83 |
| Armenia | West and Central Asian, North African | 90 | 87 | 93 |
| Brunei | South-East Asian and Polynesian | 89 | 95 | 84 |
| Azerbaijan | West and Central Asian, North African | 89 | 87 | 92 |
| Bahrain | West and Central Asian, North African | 89 | 93 | 86 |
| Andorra | West-European | 89 | 90 | 89 |
| Kyrgyzstan | West and Central Asian, North African | 89 | 88 | 91 |
| Albania | East-European | 89 | 92 | 86 |
| Moldova | East-European | 89 | 83 | 95 |
| Venezuela | West-European | 89 | 93 | 86 |
| Trinidad and Tobago | Black African
South Asian |
89 | 87 | 91 |
| Bahamas | Black African | 89 | 87 | 91 |
| Iran | West and Central Asian, North African | 89 | 94 | 83 |
| Seychelles | Black African
South Asian West-European |
89 | 92 | 86 |
| Belize | Black African
Native American |
88 | 87 | 90 |
| South Africa | Black African | 88 | 88 | 89 |
| Malaysia | South-East Asian and Polynesian | 88 | 88 | 88 |
| Bosnia | East-European | 88 | 92 | 84 |
| Samoa | South-East Asian and Polynesian | 88 | 87 | 89 |
| Jordan | West and Central Asian, North African | 88 | 88 | 88 |
| Qatar | West and Central Asian, North African | 88 | 89 | 87 |
| Brazil | West-European | 88 | 96 | 79 |
| Costa Rica | West-European | 88 | 92 | 83 |
| Panama | Native American | 88 | 88 | 87 |
| United Arab Emirates | West and Central Asian, North African | 87 | 89 | 86 |
| Turkey | West and Central Asian, North African | 87 | 94 | 80 |
| Peru | Native American | 87 | 89 | 84 |
| Saint Lucia | Black African | 87 | 88 | 85 |
| Jamaica | Black African | 87 | 87 | 86 |
| Macedonia | East-European | 86 | 87 | 86 |
| Ecuador | Native American | 86 | 91 | 82 |
| Algeria | West and Central Asian, North African | 86 | 93 | 82 |
| Saint-Kitts and Nevis | Black African | 86 | 90 | 82 |
| Bolivia | Native American | 86 | 91 | 81 |
| Mexico | West-European | 86 | 89 | 83 |
| Saint Vincent and the Grenadines | Black African | 86 | 89 | 83 |
| Lebanon | West and Central Asian, North African | 86 | 89 | 83 |
| Oman | West and Central Asian, North African | 86 | 90 | 81 |
| Botswana | Black African | 86 | 86 | 85 |
| Palestine | West and Central Asian, North African | 85 | 87 | 84 |
| Tajikistan | West and Central Asian, North African | 85 | 82 | 89 |
| Tunisia | West and Central Asian, North African | 85 | 94 | 77 |
| Thailand | South-East Asian and Polynesian | 85 | 90 | 80 |
| Micronesia | South-East Asian and Polynesian | 85 | 83 | 87 |
| Colombia | West-European | 84 | 90 | 79 |
| China | North-East Asian | 84 | 90 | 79 |
| Philippines | South-East Asian and Polynesian | 84 | 83 | 85 |
| Suriname | South-East Asian and Polynesian
Black African South Asian |
84 | 87 | 82 |
| Dominican Republic | Black African | 84 | 89 | 79 |
| Indonesia | South-East Asian and Polynesian | 84 | 87 | 80 |
| Dominica | Black African | 84 | 87 | 80 |
| Gabon | Black African | 84 | 86 | 81 |
| Libya | West and Central Asian, North African | 84 | 89 | 79 |
| Turkmenistan | West and Central Asian, North African | 84 | 80 | 87 |
| Kuwait | West and Central Asian, North African | 83 | 89 | 78 |
| Vietnam | South-East Asian and Polynesian | 83 | 86 | 80 |
| Paraguay | Native American | 83 | 85 | 81 |
| Egypt | West and Central Asian, North African | 82 | 88 | 77 |
| Kiribati | Melanesian | 82 | 84 | 80 |
| El Salvador | Native American | 81 | 89 | 75 |
| Zambia | Black African | 80 | 86 | 76 |
| Maldives | South Asian | 80 | 87 | 74 |
| Guyana | Black African
South Asian |
79 | 78 | 82 |
| Namibia | Black African | 79 | 83 | 76 |
| Ghana | Black African | 79 | 82 | 76 |
| Cabo Verde | Black African | 79 | 90 | 69 |
| Nicaragua | Native American | 79 | 83 | 75 |
| Swaziland | Black African | 79 | 82 | 76 |
| India | South Asian | 79 | 83 | 74 |
| Zimbabwe | Black African | 79 | 79 | 79 |
| Vanuatu | Melanesian | 78 | 80 | 76 |
| Honduras | Native American | 77 | 81 | 74 |
| Congo | Black African | 77 | 81 | 74 |
| Kenya | Black African | 77 | 81 | 74 |
| Sao Tome and Principe | Black African | 77 | 84 | 70 |
| Morocco | West and Central Asian, North African | 77 | 84 | 69 |
| Guatemala | Native American | 77 | 79 | 74 |
| Timor-Leste | Melanesian | 76 | 86 | 67 |
| Lesotho | Black African | 76 | 79 | 73 |
| Togo | Black African | 76 | 84 | 68 |
| Iraq | West and Central Asian, North African | 76 | 77 | 75 |
| Cameroon | Black African | 76 | 78 | 73 |
| Angola | Black African | 76 | 82 | 69 |
| Madagascar | South-East Asian and Polynesian
Black African |
76 | 78 | 73 |
| Nepal | South Asian | 75 | 85 | 66 |
| Laos | South-East Asian and Polynesian | 75 | 80 | 70 |
| Nigeria | Black African | 75 | 77 | 73 |
| Comoros | Black African | 75 | 81 | 69 |
| DR Congo | Black African | 75 | 76 | 73 |
| Uganda | Black African | 74 | 77 | 72 |
| Bhutan | South Asian | 74 | 86 | 62 |
| Cambodia | South-East Asian and Polynesian | 74 | 80 | 68 |
| Bangladesh | South Asian | 74 | 77 | 70 |
| Malawi | Black African | 73 | 80 | 67 |
| Solomon Islands | Melanesian | 73 | 75 | 70 |
| Equatorial Guinea | Black African | 72 | 74 | 71 |
| Tanzania | Black African | 72 | 73 | 72 |
| Rwanda | Black African | 72 | 80 | 65 |
| Haiti | Black African | 72 | 73 | 70 |
| Liberia | Black African | 72 | 76 | 67 |
| Benin | Black African | 72 | 79 | 64 |
| Papua New Guinea | Melanesian | 72 | 76 | 67 |
| Syria | West and Central Asian, North African | 71 | 73 | 70 |
| Cote d’Ivoire | Black African | 71 | 73 | 69 |
| Myanmar | South-East Asian and Polynesian | 71 | 73 | 68 |
| Afghanistan | West and Central Asian, North African | 70 | 77 | 64 |
| Burundi | Black African | 70 | 79 | 62 |
| Pakistan | South Asian | 70 | 70 | 70 |
| Mauritania | West and Central Asian, North African
Black African |
69 | 71 | 67 |
| Sierra Leone | Black African | 69 | 75 | 63 |
| Mozambique | Black African | 69 | 73 | 64 |
| Senegal | Black African | 68 | 75 | 61 |
| Gambia | Black African | 68 | 73 | 63 |
| Guinea-Bissau | Black African | 68 | 74 | 62 |
| Yemen | West and Central Asian, North African | 67 | 73 | 62 |
| Guinea | Black African | 66 | 72 | 60 |
| Central African Republic | Black African | 66 | 66 | 66 |
| Ethiopia | North-East African | 66 | 71 | 60 |
| Mali | Black African | 65 | 71 | 59 |
| Sudan | North-East African | 65 | 66 | 64 |
| Djibouti | Black African | 64 | 63 | 66 |
| South Sudan | Black African | 63 | 58 | 69 |
| Chad | Black African | 63 | 67 | 59 |
| Burkina-Faso | Black African | 62 | 68 | 56 |
| Eritrea | Northeast-African | 62 | 58 | 65 |
| Niger | Black African | 58 | 60 |
57 |
The values were rounded to the nearest unit.
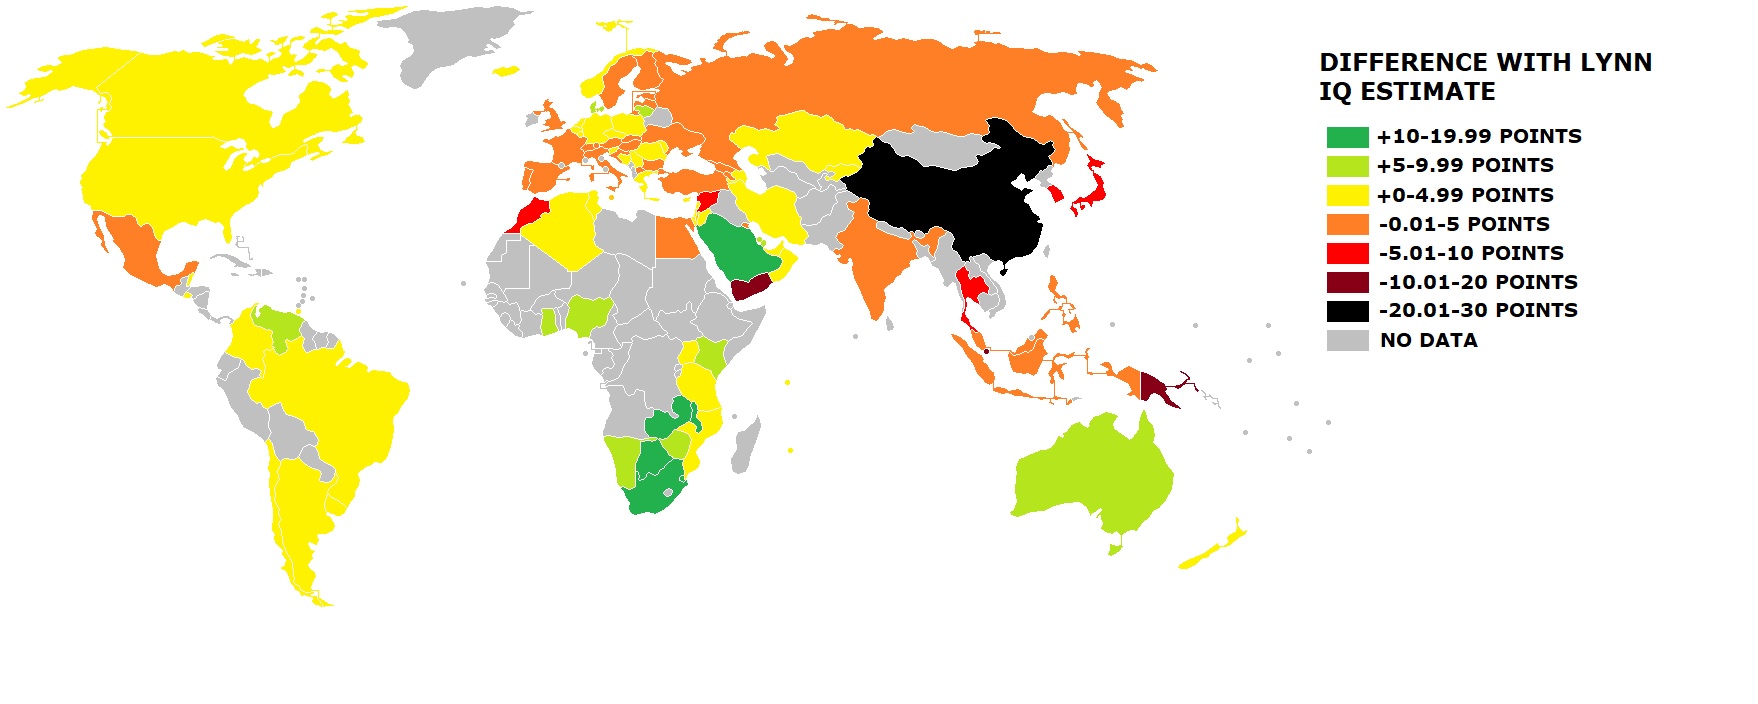
In comparison to the mean national IQs mainly reported by Richard Lynn, 65 countries differed by less than 5 IQ points using the present methodology. It can be said that such small differences validate Lynn’s estimates since it is unlikely that years of education have the same cognitive value in every country and likewise, averaging adult IQ and school-age population IQ without controlling for a country’s age structure somewhat weaken the representativeness of my findings. Differences larger than 5 points were found for 30 countries, and in these cases, I suspect it is due to Lynn manipulating the data to fit racial patterns, Sub-Saharan African countries have been systematically under-estimated and East-Asian ones have been systematically over-estimated by Lynn, also, Some nations in Europe, the Middle-East, South-Asia and Latin America seem to have their scores manipulated in order to appear closer to what they would be based on their racial composition.
Such inconsistencies result in incoherences between the reported IQs and the educational and socio-economic outcomes (regardless of which variable influences the other) of the affected countries and support the accusations of racially-motivated fraud in Richard Lynn’s data collection. In the same way, estimating the mean IQs of countries for which direct data is missing by averaging the figures of neighboring countries of similar ethno-racial composition is unwarranted as race does not seem to play a role in a country’s cognitive performance.
In spite of all the deserved criticism that Lynn’s data met, it can be said that most of the commonly cited mean IQs out of Africa and East-Asia are reliable and that a strong relationship between human capital and human development exists whether we measure it by IQ or years of education. The causes of international variation in school quality and enrollment are well-known and come down to school and student characteristics. Schools in developing countries face numerous challenges: lack of basic amenities such as electricity, potable water, air-conditioning and heating, like of educational supplies (school rarely have enough textbooks and rely on chalk and blackboards), high student to teacher ratios (primary school classes with more than 50 students are common low-income countries), chronic teacher absenteeism (teachers usually have a business on the side), obsolete pedagogy, outdated or irrelevant curricula, multilingualism, exam-corruption, low public funding, misguided policies, gender and ethnic discrimination. Pupils are held back by poor health and nutrition resulting in developmental delays, tuition fees and supplies that poor families can’t afford, war, population displacement, absent educational resources at home, low parental education, lack of transportation, child labor, excessive use of grade repetition, mismatch between school curricula and daily life demands and many other factors. Differences in human capital have large implication in terms of workforce qualification and social behavior, which contribute for a large part to a country’s socio-economic development. The present findings provide evidence for large international inequalities in inter-generational change in educational outcomes which are probably the driving cause of the Flynn effect.
Intergenerational change in cognitive performance.
Estimating IQs from the current school enrollment rates and the mean educational attainment of adults provide insights regarding intergenerational differences in cognitive performance. We can see from these figures that the countries that developed the fastest show large intergenerational differences in education/IQ favoring the younger cohorts, these countries are concentrated in South America, Southern Europe, West Africa, the Middle-East and Oceania, Ethiopia and China also show trends that are in line with their recent economic success. On the other hand, many ex-USSR countries, as well as Japan, Cuba, South Africa, Zimbabwe and the Philippines have been stagnant or even declining relative to the United Kingdom and this is also reflect in their poor socio-economic performance in the last decades. War-torn South Sudan and the Central African Republic experience alarming declines in their educational performance that expose them to grave humanitarian crises in the future. Although there is a clear relationship between socio-economic progress and gains in cognitive performance, a country’s ability to capitalize on its intellectual potential remains highly dependent on its leadership and the odds of the world-market, that’s why theories claiming that IQ is the main driver of global inequalities are not tenable in the light of the current evidence.
Update 09/07/2017 – Detailed comparison with Lynn’s Data
To test the predictive power of my estimates in comparison to Lynn’s, I decided to focus only on the world’s 20 most populous countries. The reason for that is that these countries are home to 70% of the world’s population and the law of large numbers says that they are likely more representative of whatever they could represent. On the other hand, the 100+ other countries are home to only 30% of humanity. They are a source of statistical noise due to extreme outlying values and differences in regional political fragmentation that would hide or weaken general trends better evidenced by considering large countries.
Data:

Correlations and averages:
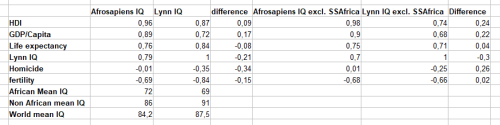
Noticing an abnormal 22 points gap between Sub-Saharan African IQs and the world average on Lynn data, Suspecting that extremely low values would flaw the correlations, I tested if my estimates and Lynn’s would retain the same predictive power with the African IQs excluded. My assumption was that a strong causal relationship would leave the correlations unchanged no matter which countries were included whereas any change in predictive power resulting from excluding some countries would cast doubt on the accuracy of the reported data.
IQ-HDI correlation:
Similarly to my previous calculation including all the countries for which data were available, I found a 0.96 correlation between my estimates and HDI, Lynn’s estimates correlation with HDI was higher (+0.06) than with the worldwide data, but still largely inferior to mine. Removing African countries, the predictive power of my estimates remained the same (+02) whereas Lynn’s significantly decreased (-0.13) and left a predictive gap of 0.24 favoring my estimates. However, given the fact that my estimates are based on variables that are included in the calculation of HDI, such a high predictive power as to be met with caution.
IQ-GDP per capita correlation:
My previous calculation from the worldwide data yielded a correlation coefficient of 0.65 between my IQ estimates and GDP/capita and 0.60 for Lynn’s. Among the 20 most populated countries, the correlation rose by 0.24 points to 0.89 with my estimates and by 0.12 points to 0.72 with Lynn’s. Excluding Sub-Saharan African countries did not affect the predictive power of my estimates (+0.01) and further weakened Lynn’s by 0.04 points, resulting in a 0.22 gap in predictive power favoring my estimates again. This correlation of 0.89 between my IQ estimates and GDP per capita within the world’s population top 20 countries likely is the highest correlate of IQ ever reported in the psychological science and gives strong support to the relationship between schooling, economic development and cognitive ability.
IQ-Life expectancy correlation:
Compared with the worldwide database, the correlation between my IQ estimates and life expectancy was down 0.04 points within the world’s top 20 to 0.76, Lynn’s went up by o.o5 points to 0.84. However, removing Sub-Saharan Africa left the predictive power of my estimates unchanged whereas Lynn’s fell by 0.13 points to 0.71. My estimates again predicted life expectancy better by a small 0.4 points this time.
IQ-Homicide correlation:
Not estimated previously, my data finds an non-existent relationship between IQ and homicide rate (-0.01) and excluding Sub-Saharan Africa confirmed a null relationship between homicide rates and IQ in the rest of the world. Lynn’s estimates showed a low negative correlation between IQ and homicide (-0.35) and the exclusion of African countries further lowered the correlation (-0.25). Lynn’s estimates had a better predictive power which still remained in the range of low statistical significance.
IQ-Fertility correlation:
Adding a new variable, I found a negative correlation of -0.69 between my IQ estimates and Fertility, the correlation remained the same (-0.68) with the African countries excluded. The correlation between Lynn’s IQs and fertility was stronger (-0.84), but removing African data decreased it by 0.18 points to 0.66. My estimates ended up with a slightly stronger predictive power (+0.02).
General patterns:
In addition to having a stronger and globally consistent predictive power, my estimates reveal how Richard Lynn manipulates the data to fit desired racial patterns.
As expected from the 0.96 correlation between my IQ data and HDI, the ranking of countries by cognitive ability shows a perfect gradient from high to low development status. Moreover, the highest gap between two following countries is the 6 points separating Russia and Iran, showing a marked difference between the developed and the developing world.
Ranking countries by Lynn-estimated IQs results in a whole other pattern in which a country’s dominant ancestry seems to be the only variable that matters. East-Asians are on top, followed by Western Europeans, then Eastern-Europeans, South-East Asians, fair skinned Middle-Easterners (Turkey and Iran) and Latin Americans, Austronesians (Indonesia and the Philippines), South Asians and Arabs, and finally Sub-Saharan Africans far below, with a huge 10 points gap (the largest between two following countries in his dataset) separating Bangladesh from Nigeria.
The manipulation is quite apparent, Lynn largely over-estimated China (+22), Japan (+7) to make East-Asians cluster on top, thus protecting himself from accusations of nordicism and giving support to the inter-cultural validity of the IQs that he cherry-picked. The western European and Russian data remained mostly unchanged. Vietnam (+11) and Thailand (+5) were given a bonus for their genetic proximity to North-East Asia that is supposed to make them score in the low 90s despite their lack of development. Little changes were brought to the scores of the Latin American, Middle-Eastern and Austronesian countries usually scoring in the mid-80s. Major fraud (+14 in Pakistan, +7 in Bangladesh) was done to lift up South-Asian countries out of the 70s range and excluding Sub-Saharan Africa as the only region scoring 70 or below and downgrading Nigeria (-4) and the DR. Congo (-7) in the process.
By pointing this out, I’m warning honest researchers and laymen about the dangers of relying on data resulting from undisclosed, unsystematic and un-replicable methodology. And although my estimates do not result from any actual IQ measurement beyond the relationship between IQ and schooling evidenced in Norwegian cohorts, my method uses a single, universal conversion factor applied to representative official data collected by professional demographers whereas Lynn’s and the likes’ cherry-picking of samples is only the hobby of a dozen scholars and pseudo-scholars. This is how I found out strong, consistent and meaningful correlations between IQ and various development variables.
Although they are likely more representative of the worldwide distribution of cognitive ability, my estimates still provide evidence that a large part (the largest part, actually) of the world’s population scoring below one standard deviation on Western-normed IQ tests, which is the case for 11 of the world’s 20 most populated countries. Although this may sound alarming, with Pakistan and Ethiopia scoring in the range of mental disability (70 and 66 respectively), I think this effect comes from using Western populations as a reference for standardization.
In fact, another picture emerges when we compare countries with the world’s average, replacing the eurocentric British Greenwich IQ of 100 by an universal IQ of 84 and thus giving a more accurate idea of what is normal cognitive ability by the standards of humanity. In this sample, China, the Philippines and Indonesia are representative of the top of the bell curve whereas Ethiopia, the United States and Germany are the only outliers left with respective Universal IQs of 81.6, 115.6 and 116.6. For this reason, I recommend the use of Chinese or South-East Asian normalization samples in international IQ comparisons.

Afro, Where Did You Get Your Data?
LikeLike
United Nations’ Development Program:
Expected years of schooling to calculate school age population IQ: http://hdr.undp.org/en/indicators/69706
Mean years of schooling to calculate adult IQ:
http://hdr.undp.org/en/indicators/103006
LikeLike
I’ll play devil’s advocate:
My father, woodworker, high-school drop out (he had to work for his father, they were poor), scored 142 points.
I, graduated in Civil Engineering, scored 134.
My mother, primary school teacher, scored 101.
Really, the sheer amount of Educated idiots and Uneducated geniuses I’ve found in life is outstanding. But I know, I know, “bias”, “small sampling”, etc
Also, what I happened to see from your findings is that: Countries in which a meritocratic-system is applying, successful, often more intelligent people, are having more children.
In places like Japan, where everybody stopped having kids, it’s the lower classes, often also with low IQ, who have the many, specially due to immense social stability and high quality of living with little competition struggle.
The Flynn effect, meh, it’s just a phenotype of a genetic trend. “Every society selects for something”, right?
LikeLike
It’s not that I don’t believe your story but individual anecdotes do not disprove general trends, I think we both know that. Someone who grew up undernourished can be very tall, it doesn’t contradicts the fact that the average height of a population increases as health and nutrition improve. The same has to be expected for IQ which in this case seems to be strongly affected by educational opportunities. But since it’s a highly heritable trait, people receiving the same schooling will still vastly differ in their cognitive outcomes.
Countries in which a meritocratic-system is applying, successful, often more intelligent people, are having more children.
I fail to see this pattern, I rather think that countries that offer little educational opportunities to their masses are cognitively held down whereas countries like Spain, Greece and Portugal which came from being authoritarian, kleptocratic societies to modern, more egalitarian ones made huge inter-generational improvements.
In places like Japan, where everybody stopped having kids, it’s the lower classes, often also with low IQ, who have the many,
I really don’t know, I’m not aware that Japan has generous child-related benefits. Japan has been stagnating or declining since the 1990s, mainly for macro-economic reasons I suspect but I believe social trends played a role. I can’t exactly tell which ones though.
The Flynn effect, meh, it’s just a phenotype of a genetic trend. “Every society selects for something”, right?
No, I don’t agree, there is no genetic correlate of the Flynn effect to my knowledge.
LikeLike
“But since it’s a highly heritable trait, people receiving the same schooling will still vastly differ in their cognitive outcomes.”
So you actually agree with me, with hereditarians. I’m glad that you don’t believe in equality proving that dumb whites and the majority of Africans can’t catch up on your average white.
LikeLike
That’s not what heritability means, stupid.
LikeLike
according to peepee’s map, australia and nz have the smartest school age population. how’d that happen? there are still too few asian immigrants to make that big a difference.
LikeLike
oh i see. peepee just pulled that out of her butt. australians have the highest expected IQ scores based on anticipated years of schooling completed.
LikeLike
Please, we both know peepee is unable to write something so thorough.
LikeLike
Afro’s whole post doesn’t even make sense to me. So you’re estimating IQ based off of years of schooling? Which proves years of schooling improves IQ?
That just sounds like perfectly circular logic. Anyhow, back to sleep.
LikeLike
Lol, yeah, go back to sleep. No, I’m not proving that years of schooling improves IQ. I’m just trying to see how close to Lynn’s estimates I can get by estimating IQs based on years of schooling. And I actually come very close except for some obvious cases in which Lynn manipulated the data to fit a racial discourse.
LikeLike
No, I’m not proving that years of schooling improves IQ. I’m just trying to see how close to Lynn’s estimates I can get by estimating IQs based on years of schooling.
But what’s the point of showing Lynn’s figures can be estimated from the causal effect of school on IQ, unless you’re trying to prove the IQ gaps between countries are caused by schooling gaps?
But you didn’t prove that because most of Lynn’s data comes from kids still in school, so years of schooling is already largely controlled.
You should have used the causal effect of parental schooling on IQ which can be estimated from adoption studies.
LikeLike
But what’s the point of showing Lynn’s figures can be estimated from the causal effect of school on IQ
The point is seeing whether I find differences between Lynn’s IQs and what has to be expected from years of schooling. Seeing what are the patterns of those differences, like some regions being systematically over-estimated, others being systematically under-estimated. Which is a pattern I found. My figures also show the inter-generational variation in each country which allows me to estimate how strong the Flynn effect is or is supposed to be. Finally, I can see if those new figures correlate better and more invariably with other variables that have been claimed to be related to national IQ and they actually yield stronger and consistent correlations.
unless you’re trying to prove the IQ gaps between countries are caused by schooling gaps?
I’m not trying to prove anything. I’m just converting years of education into IQs using a rate of 3.7 points per year of schooling and then expressing it in relation to a British standard of 100.
But you didn’t prove that because most of Lynn’s data comes from kids still in school, so years of schooling is already largely controlled.
no, Lynn’s data come from samples of different eras, with different characteristics without a rigorous inclusion methodology that meets the standards of demographic analysis.
You should have used the causal effect of parental schooling on IQ which can be estimated from adoption studies.
I need data to create a conversion factor, and I have no such thing on an international level, neither do I have a rate to apply and a standard to compare. All I know about the Parent-child IQ correlation is that it’s only 0.42 when they live together and 0.22 when they live apart. That’s small.
LikeLiked by 1 person
By the way, I can’t enlarge the charts, so here they are.
LikeLike
speaking of how profound an effect environment can have long term.
i’ve had 6 dogs.
3 died at age 10, 8, 7.
3 died at age 13, 13, 13.
the first 3 were adopted fully grown.
the second 3 were raised from 6 weeks.
AND they were all the same breeds. irish setter, airedale terrier, standard poodle.
LikeLike
The point is seeing whether I find differences between Lynn’s IQs and what has to be expected from years of schooling.
But you’re not looking at what’s expected from years of schooling, you’re looking at what’s expected from years of schooling IF schooling were the ONLY cause of IQ. The 3.7 per year figure comes from a Norwegian study where average schooling increased while other factors stayed constant. That was the point of the study. They wanted to know the effect of schooling on IQ independent of any effect IQ has on schooling so they compared the IQ gap before and after the government intervened to increase the mean level of schooling, thus controlling for most of the confounds that usually separate schooled and less schooled samples (such as different initial IQ and social class background).
But for most populations that differ in schooling, the causation works in both directions: IQ inequality causes schooling inequality which in turn expands the IQ inequality. Your 3.7 figure only captures the effect of schooling but not the cause and thus underestimates the expected IQ gap between the more or less schooled (though at the extremes you may have overestimated because the IQ schooling relationship is negatively accelerated, not linear as you assumed), but putting that aside, schooling’s a bad way to compare IQs internationally because of the differences in education budgets and academic standards.
Seeing what are the patterns of those differences, like some regions being systematically over-estimated, others being systematically under-estimated.
Just because a country has a higher or lower IQ than education predicts, doesn’t mean they’re being systematically underestimated. If one people has a higher mean IQ than another, we’d expect them to score higher even controlling for education. For example, in the U.S., nearly the full black-white IQ gap is seen at every level of schooling. See page 374 of Coming Apart by Charles Murray. Rushton found large racial differences even among university students taking the same classes at the same school.
Finally, I can see if those new figures correlate better and more invariably with other variables that have been claimed to be related to national IQ and they actually yield stronger and consistent correlations.
If a country can afford to educate its people it’s not surprising it’s doing well.
I’m not trying to prove anything. I’m just converting years of education into IQs using a rate of 3.7 points per year of schooling and then expressing it in relation to a British standard of 100.
You’re not converting anything to anything. You’re misapplying the Norwegian data which meant to show the expected IQ gap for a year of schooling holding all other variables constant.
And even if you were converting education to IQ, it still makes no sense because they’re two very different variables, like converting weight into height. Samoans weigh more than whites despite being shorter, so let’s convert weight into height to prove they’re actually taller and that the height data is being manipulated by racists.
#think like Afro
LikeLike
But you’re not looking at what’s expected from years of schooling, you’re looking at what’s expected from years of schooling IF schooling were the ONLY cause of IQ.
Which is likely the case given the previous literature:
https://openpsych.net/forum/attachment.php?aid=473 (quoted at the beginning).
The 3.7 per year figure comes from a Norwegian study where average schooling increased while other factors stayed constant. That was the point of the study. They wanted to know the effect of schooling on IQ independent of any effect IQ has on schooling so they compared the IQ gap before and after the government intervened to increase the mean level of schooling, thus controlling for most of the confounds that usually separate schooled and less schooled samples (such as different initial IQ and social class background).
Which doesn’t disprove the causal role of schooling on international differences in IQ. It must be assumed that if any country implements the same policies as Norway, they can increase their IQ scores likewise.
But for most populations that differ in schooling, the causation works in both directions: IQ inequality causes schooling inequality which in turn expands the IQ inequality.
I sufficiently detail the causes of differences in schooling across the world in the post. However, if a country decides to make schooling a priority in their budget, it is assumed that they can expect results similar to Norway.
Your 3.7 figure only captures the effect of schooling but not the cause and thus underestimates the expected IQ gap between the more or less schooled (though at the extremes you may have overestimated because the IQ schooling relationship is negatively accelerated, not linear as you assumed), but putting that aside, schooling’s a bad way to compare IQs internationally because of the differences in education budgets and academic standards.
I actually don’t get extreme results, everything is in the range of previously claimed variation 57-107. Niger’s IQ57 doesn’t surprise me, it’s a very poor rural country where most people live in their multicentury-old ways. And that’s the reason why I don’t even think these numbers measure an intellectual phenotype. Instead I think they measure paper-and-pencil ability. People’s scores reflect how good they are at taking tests, including IQ tests, independently of skills and knowledge. And more schooling mechanically leads to better IQ test performance. It explains the Flynn effect and inter-group variation without explaining raw differences in cognitive ability. Which is, people in all countries can similarly learn things and skills that are relevant to their lifestyle.
Just because a country has a higher or lower IQ than education predicts, doesn’t mean they’re being systematically underestimated. If one people has a higher mean IQ than another, we’d expect them to score higher even controlling for education. For example, in the U.S., nearly the full black-white IQ gap is seen at every level of schooling.
That’s because blacks, at every level of income are much more likely to attend urban schools where more baby-sitting than teaching is going. But I doubt such differences show up in internal comparisons since pupils drop out nearly as early as classes become to difficult for them to catch up, so the enrollment rate virtually tells the intellectual ability of the school-age population. On the contrary, schools in the developed world keep pupils if school and graduate them even if they’re barely learning anything.
Rushton found large racial differences even among university students taking the same classes at the same school.
Tells nothing about what types of schools they attended before college.
If a country can afford to educate its people it’s not surprising it’s doing well.
I’m not finding correlations with government school budgets, I’m finding correlations with GDP. Which is different and the causal direction is easy to understand: more education/IQ gives a country the ability to add more value-add to its economy (GDP = value added). But the most important part is that my correlations with all measures I tested (life expectancy, fertility, GDP/capita, HDI, homicide) aren’t only stronger, they are the same no matter what country I include in my dataset. So whatever I measured, it has more explanatory power for the main measures of socio-economic development than Lynn’s IQs and debunks his claim that his IQs are the most important cause of variation in national prosperity.
You’re not converting anything to anything. You’re misapplying the Norwegian data which meant to show the expected IQ gap for a year of schooling holding all other variables constant.
I’m correctly applying the Norwegian data in the most straightforward sense, and I find better associations with all aspects of development than Lynn does, irrespective of the causal direction.
And even if you were converting education to IQ, it still makes no sense because they’re two very different variables, like converting weight into height. Samoans weigh more than whites despite being shorter, so let’s convert weight into height to prove they’re actually taller and that the height data is being manipulated by racists.
No, IQ test performance is for a large part an artifact of education instead of an independent real biological phenotype. And the IQ/education correlation is much higher than the height/weight one, which means that at every level of education, the variation in IQ is lower than the variation in weight at each level of height. It’s easy to explain why Samoans are heavier than expected from their height: http://edition.cnn.com/2015/05/01/health/pacific-islands-obesity/index.html
What you could not explain however is how Barbados, Jamaica, Gabon, Botswana or the Bahamas manage to get well developed economies and high quality of life in spite of IQs in the range of mental retardation according to Lynn. Lynn who, in case you don’t know, is a self-declared racist of the most vicious type.
#think like Afro
And that’s a lot better than making up a theory on why Bushmen did not make the leap to agriculture in the Kalahari desert. So try thinking like me, you’d probably have a much higher quality blog than what you have now.
LikeLike
Re IQ tests:
See this article by Ken Richardson: What IQ Tests Test:
The controversies and debates that result are well known. This paper brings together results and theory rarely considered (at least in conjunction with one another) in the IQ literature. It suggests that all of the population variance in IQ scores can be described in terms of a nexus of sociocognitive-affective factors that differentially prepares individuals for the cognitive, affective and performance demands of the test—in effect that the test is a measure of social class background, and not one of the ability for complex cognition as such. (p. 283)
On the height/weight example:
A correlation between test scores does not necessarily mean that they are measuring the same thing. As Raven et al. (1993) put it, ‘height and weight are correlated to much the same extent as “academic abilities”—yet height and weight are clearly not the same thing’ (p. G8) (p. 300)
Also see Does IQ Really Predict Job Performance?
See also Ken Richardson’s book review of Jensen’s The g Factor: The Science of Mental Ability:
DEMYSTIFYING G: Book Review of Jensen on Intelligence-g-Factor
Jensen also writes on p. 48 of The g Factor:
My study of these two symposia and of many other equally serious attempts to define “intelligence” in purely verbal terms has convinced me that psychologists are incapable of reaching a consensus on its definition. It has proved to be a hopeless quest. Therefore, the term “intelligence” should be discarded altogether in scientific psychology, just as it discarded “animal magnetism” as the science of chemistry discarded “phlogiston.” “Intelligence” will continue, of course, in popular parlance and in literary usage, where it may serve a purpose only because it can mean anything the user intends, and where a precise and operational definition is not important.
LikeLike
What is most important, in my opinion, for individual differences in IQ is a theory of individual intelligence differences. As far as I know, there is no such theory. Why not? Jensen and Deary state that there is no theory of why individuals differ in g or IQ tests. I think that’s a huge problem. A quote from Richardson’s new book Genes, Brains, and Human Potential: The Science and Ideology of Intelligence (p. 104):
Intelligence is viewed as the most important ingredient of human potential. But there is no generally accepted theoretical model of what it is (in the way that we have such models for other organic functions). Instead, psychologists have adopted physical metaphors: mental speed, energy, power, strength, and so on, together with simple genetic models of how it is distributed in society. The IQ test was invented to create scores that correspond with such metaphors, with the distribution—who is more or less intelligent—already presumed.
This circularity in IQ testing must not be forgotten or overlooked. IQ tests do not have what is called “construct” validity, in the way that breathalyzer is calibrated against a model of the passage of alcohol in the bloodstream. They are constructed on the basis of prior beliefs of who is or is not intelligent. But by creating a numerical surrogate of a social class system, they make that system appear to spring from biological rather than social forces. Such ideas are dangerous, because they demean the real mental abilities and true potential of most people in everyday social situations.
Ken Richardson has constructed a theoretical model of intelligence, the basis of which are intelligent cells and intelligent physiology. His dynamic/intelligent systems/physiology theory is great, and could explain the emergence of intelligence, as well as the evolution of new species.
Whatever the case may be, there is no hard theory for individual differences in g (whatever that is), and no agreed-upon definition intelligence. Without getting past these two hurdles, the “IQ research community” has a lot of ground to cover.
LikeLike
In eight analyses, population mean full scale IQ and literacy scores yielded correlations ranging from .79 to .99.
Literacy score != years of education. And group level correlations tend to be higher than individual level correlations.
It must be assumed that if any country implements the same policies as Norway, they can increase their IQ scores likewise.
Your analysis assumes that differences in schooling are the only cause of international IQ gaps which is debunked by the fact that these IQ gaps occur at ages when kids are still in school. In one of the largest African IQ studies ever done (Owen, 1992) 1,093 black South Africans drawn from 28 schools, had a mean Raven IQ below 70. This very low score can not be caused by the kids leaving school early because the sample was still in school so your numbers explain nothing.
Now you could argue it’s PARTLY caused by their parents leaving school early, but then you’d have to use the independent effect of parental IQ on one’s IQ; you used the independent effect of one’s own schooling on one’s IQ which makes no sense given how early in life international IQ gaps appear.
I’m not finding correlations with government school budgets, I’m finding correlations with GDP.
One would expect GDP to be related to school budgets.
Which is different and the causal direction is easy to understand: more education/IQ gives a country the ability to add more value-add to its economy (GDP = value added).
One would expect the causation to flow in BOTH directions, hence the high correlations.
But the most important part is that my correlations with all measures I tested (life expectancy, fertility, GDP/capita, HDI, homicide) aren’t only stronger, they are the same no matter what country I include in my dataset. So whatever I measured, it has more explanatory power for the main measures of socio-economic development than Lynn’s IQs and debunks his claim that his IQs are the most important cause of variation in national prosperity.
Even if Lynn did claim that, you haven’t debunked him because you haven’t proved education is the cause of these high correlations. It could be GDP + IQ causing education causing more GDP etc. Rich smart countries get educated and get richer. Shocking!
and I find better associations with all aspects of development than Lynn does, irrespective of the causal direction.
Lynn’s data is not that reliable for individual countries since it’s just based on whatever studies he could find in the literature, so it doesn’t surprise me that authoritative data from the United Nations is more predictive, especially since education reflects not only the national IQ, but also the skills, work ethic, resources, and values of the country.
And yet your own matrix shows Lynn’s data better predicting life span than your data (0.84 vs 0.76) and homicide (-0.35 vs -0.01).
You also may have tried to manipulate the data by including only the most populous countries.
And the IQ/education correlation is much higher than the height/weight one,
Not much higher. The IQ-education correlation is about 0.57 for full-scale IQ and 0.47 for performance IQ (see table 4.6):
https://books.google.ca/books?id=ee4KTFdIabAC&pg=PA117&lpg=PA117&dq=IQ+WAIS+years+of+education&source=bl&ots=4S0ceFrmV8&sig=EGZkh11cwByFrlfkXopbcNnP4ZI&hl=en&sa=X&ei=U8KiVZ3sJtjToAStoJyQDQ&ved=0CEgQ6AEwBw#v=onepage&q=IQ%20WAIS%20years%20of%20education&f=false
By contrast the correlation between weight and squared height is about 0.45 in adults and 0.81 in kids.
Click to access 10.1016%40j.endonu.2013.06.001.pdf
In adult athletes, the correlation is 0.78:
Click to access 91581-EXP-student4-001.pdf
What you could not explain however is how Barbados, Jamaica, Gabon, Botswana or the Bahamas manage to get well developed economies and high quality of life in spite of IQs in the range of mental retardation according to Lynn.
Lynn’s data is not reliable at the country level because he only has a few studies of questionable quality per country. Where his data might be a lot more reliable is at the regional level (i.e. sub-Saharan Africa, East Asia, Northwest Europe etc) because by averaging many countries in a region, the errors for individual countries cancel out.
Having said that, I agree that mental retardation for entire countries is absurd but that doesn’t necessarily mean Lynn manipulated the data, it could just mean paper-pencil IQ tests are culturally biased for people in less developed countries because as Nell (2000) argued “they are less test-wise, less interested, more anxious, work less efficiently, or give up sooner on items they find difficult”
LikeLike
Literacy score != years of education.
Indeed, education and the time spent in school obviously is the main thing that improves literacy scores in life and it probably explains most of the Flynn effect. Then individual reading, commitment to schoolwork and teaching standards can causes differences in the way individuals acquire those literacy skills but I think years of education is the best proxy we have for literacy. It’s better than literacy rate because it makes no difference between different levels of mastery beyond the ability to read and write simple sentences.
There is a reason why literacy, years education and IQ are all interrelated and good proxies for each other. If you look at the WAIS-IV’s subtests g-loadings, the verbal parts are more g-loaded than the performance ones. The highest being vocabulary.
https://books.google.fr/books?id=vMR9b7dshrQC&pg=PA49&lpg=PA49&dq=subtest+g+loading&source=bl&ots=7FikGNWy2q&sig=o2WEo8mFeUTdxpaLt-T52l9oEFY&hl=en&sa=X&ved=0ahUKEwjuqOCvlK_WAhVQJ1AKHQbWBwEQ6AEIYzAL#v=onepage&q=subtest%20g%20loading&f=false
Likewise, reading proficiency is an important determinant of school achievement for easily understandable reasons and it improves brain function.
Click to access SLMR_IndependentReading_V3.pdf
https://www.theguardian.com/books/2014/jan/23/can-reading-make-you-smarter
So everything adds up. “g” is a measure of literacy, which is under socio-cultural influence. It explains group differences and the Flynn effect better than any other model.
Your analysis assumes that differences in schooling are the only cause of international IQ gaps which is debunked by the fact that these IQ gaps occur at ages when kids are still in school.
They do not attend the same schools, the 1992 study you quote was from apartheid South Africa. Lol! how can you claim to control for anything in apartheid South Africa? Blacks and whites lived on different planets. And all the other studies you can mention are based on samples that do not meet the representativeness of professional demographic analysis.
Now you could argue it’s PARTLY caused by their parents leaving school early, but then you’d have to use the independent effect of parental IQ on one’s IQ;
That’s what I partly do by averaging adult and children schooling characteristics.
you used the independent effect of one’s own schooling on one’s IQ which makes no sense given how early in life international IQ gaps appear.
It makes more sense than anything you wrote on your blog. My measure of children performance is school life expectancy, which is not exactly one’s schooling, it’s the time they’re expected to stay in school based on current enrollment rates. It means that when you claim Lynn’s samples show gaps appearing early, it only means that even if still in school, a large part of the schooled children are at risk of leaving school early because they’re not learning. And that translates in lower school life expectancy.
One would expect GDP to be related to school budgets.
Partly, but not exactly, countries with the same GDP/capita differ vastly in the share of national income that is spent on education.
One would expect the causation to flow in BOTH directions, hence the high correlations.
Education increasing value added makes more sense than value added increasing education. Because value added wont be spent on education to the same extent in all countries.
Even if Lynn did claim that, you haven’t debunked him because you haven’t proved education is the cause of these high correlations. It could be GDP + IQ causing education causing more GDP etc. Rich smart countries get educated and get richer. Shocking!
I did prove that because my correlations are not just stronger, they’re invariant.
Lynn’s data is not that reliable for individual countries since it’s just based on whatever studies he could find in the literature
You mean every study that could make his point.
And yet your own matrix shows Lynn’s data better predicting life span than your data (0.84 vs 0.76) and homicide (-0.35 vs -0.01).
Again, what matters the most here is invariance, international consistency of correlation coefficients. Lynn’s data losing predictive power once Africa is removed prove that that his correlations are only artificially higher due to the fake manipulated African scores. My correlations maintaining their predictive power with and without level prove worldwide reliability of my estimates.
You also may have tried to manipulate the data by including only the most populous countries.
No, these correlations are still worth for 70% of the world’s population and it removes oil-rich countries with very high GDP per capita and other extreme outliers, it also gives world regions the same weight in the correlations. Because when there are 50 African countries and only 5 in East Asia, it gives way too much weight to the African data in the calculation of the correlation coefficient.
Not much higher. The IQ-education correlation is about 0.57 for full-scale IQ and 0.47 for performance IQ (see table 4.6):
It explains 50% more variance, and IIRC, the correlation you cite is about school grades, not years of schooling which is considered a good proxy for IQ in GWAS studies. One would never say height genes are a good proxy for weight genes.
Lynn’s data is not reliable at the country level because he only has a few studies of questionable quality per country. Where his data might be a lot more reliable is at the regional level (i.e. sub-Saharan Africa, East Asia, Northwest Europe etc) because by averaging many countries in a region, the errors for individual countries cancel out.
Lol! there is no such thing, no other international data is calculated this way. No one would say GDP figures are more reliable on the continental level than on the country level. Because there is high variance in GDP and GDP-influencing factors within a continent so it would be absurd to say since two countries have the same racial majority and are neighbors, they must be just as rich. The Dominican Republic is richer than Haiti (which is black), but it’s much poorer than Barbados (which is black too) So you need to use national data instead of a “mean Caribbean GDP” that would not reflect the large differences within the region. Saying continental level data is more reliable than country data is assuming that continental ancestry significantly influences country average. And the errors you mention are not errors, they are intentional selection of unrepresentative data. Don’t get it twisted, when serious analysts have no reliable data, they just don’t report estimates.
Having said that, I agree that mental retardation for entire countries is absurd but that doesn’t necessarily mean Lynn manipulated the data it could just mean paper-pencil IQ tests are culturally biased for people in less developed countries because as Nell (2000) argued “they are less test-wise, less interested, more anxious, work less efficiently, or give up sooner on items they find difficult
IQ scores in the mental retardation range not absurd, they’re only absurd if we assume that it truly reflects actual functioning instead of only test scores. But it’s truly absurd to believe that a country like Jamaica is run by retards or has a school system that doesn’t accustom its population to test-taking skills that are reflected in IQ scores higher than 80. By estimating advanced black countries in the Caribbean in the 70s and by estimating under-developed China above 100, Lynn had no intent to give a cultural-bias explanation to account for this. You’re too gullible.
LikeLike
RR, Jensen was making progress towards a theory of individual differences before he died. See his book Clocking the Mind
LikeLike
Indeed, education and the time spent in school obviously is the main thing that improves literacy scores in life and it probably explains most of the Flynn effect.
They’re related but I repeat, literacy scores != years of education so citing the high correlation between literacy scores and IQ does not prove your nonsense claim that years of schooling is the only cause of national IQ gaps. Even among people with the same years of completed schooling, literacy scores differ enormously.
They do not attend the same schools, the 1992 study you quote was from apartheid South Africa. Lol! how can you claim to control for anything in apartheid South Africa?
Which shows the absurdity of you claiming years of education is the only cause of national IQ gaps. Countries can differ in all kinds of ways that affect IQ, beyond just mean schooling, with apartheid being an example.
That’s what I partly do by averaging adult and children schooling characteristics.
All you’re doing is averaging the expected IQ of adults with the expected future IQ of kids based on the wrong assumption that years of schooling is the only cause of IQ.
My measure of children performance is school life expectancy, which is not exactly one’s schooling, it’s the time they’re expected to stay in school based on current enrollment rates. It means that when you claim Lynn’s samples show gaps appearing early, it only means that even if still in school, a large part of the schooled children are at risk of leaving school early because they’re not learning. And that translates in lower school life expectancy.
So now that your claim that years of schooling is the only cause of national IQ differences has been debunked, you’re now claiming that even while still in school, countries that are X numbers of years less schooled than Great Britain are also X number of years behind in actual learning even before they dropout.
If so, by the time they’re adults they are effectively 2X years behind Great Britain in schooling, so by your method, all the IQ gaps should be double by adulthood. So when you claim Africa’s mean IQ is 72, because they average 7.57 years less schooling than Great Britain, and each missed year deducts 3.7 points, you’re actually claiming that by adulthood, they’re effectively 15.14 years less schooled than Great Britain.
Great Britain IQ – 15.14(3.7) = Adult African IQ of 44
Absurd!
Partly, but not exactly, countries with the same GDP/capita differ vastly in the share of national income that is spent on education.
But the two are correlated so the correlation between national education and GDP is partly just rich countries being able to afford to educate the masses.
Education increasing value added makes more sense than value added increasing education.
They’re not mutually exclusive. The causation would work in both directions thus making the correlation extra high.
Again, what matters the most here is invariance, international consistency of correlation coefficients. Lynn’s data losing predictive power once Africa is removed prove that that his correlations are only artificially higher due to the fake manipulated African scores. My correlations maintaining their predictive power with and without level prove worldwide reliability of my estimates.
Actually it may show just the opposite. Correlations are expected to decline when you restrict the range of scores which is what you did by removing African countries:
http://davidmlane.com/hyperstat/A68809.html
Lynn’s declining predictive power is exactly as expected. It’s your numbers that are behaving suspiciously.
No, these correlations are still worth for 70% of the world’s population and it removes oil-rich countries with very high GDP per capita and other extreme outliers, it also gives world regions the same weight in the correlations. Because when there are 50 African countries and only 5 in East Asia, it gives way too much weight to the African data in the calculation of the correlation coefficient.
Such arbitrary decisions on your part create the appearance of data manipulation.
It explains 50% more variance,
Height explains FAR MORE of the variance in childhood weight than IQ explains variances in adult education.
and IIRC, the correlation you cite is about school grades, not years of schooling
No table 4.6 specifically says “years of education”
which is considered a good proxy for IQ in GWAS studies. One would never say height genes are a good proxy for weight genes.
That’s because it’s assumed that the non-IQ components of education are non-genetic, yet the non-height component of weight is still seen as genetic. The former assumption is false however:
Click to access 15273.full.pdf
Lol! there is no such thing, no other international data is calculated this way. No one would say GDP figures are more reliable on the continental level than on the country level.
That’s because for other international data points we have excellent country by country data points.
Saying continental level data is more reliable than country data is assuming that continental ancestry significantly influences country average.
No, it assumes nothing about cause. It’s just the well known principle of aggregation:
https://link.springer.com/article/10.3758/BF03208007
Don’t get it twisted, when serious analysts have no reliable data, they just don’t report estimates.
Actually they do, particularly in fields where they don’t have the luxury of reliable data, for example in anthropology they might estimate the brain size of an extinct hominin based on just a couple skulls of unknown representativeness. These are just considered the best estimates we can make at the time, and as more and better data comes in, they’re revised.
By estimating advanced black countries in the Caribbean in the 70s and by estimating under-developed China above 100, Lynn had no intent to give a cultural-bias explanation to account for this.
I know Lynn’s numbers seem very wrong for Australian aboriginals so I would not be surprised if he’s wrong or biased in a lot of other areas too, but your article didn’t land a single punch.
You’re too gullible.
No gullible is you arguing the average adult African IQ is 44 and not even realizing you’re arguing that.
LikeLike
They’re related but I repeat, literacy scores != years of education so citing the high correlation between literacy scores and IQ does not prove your nonsense claim that years of schooling is the only cause of national IQ gaps.
The relation is not coincidental.
-verbal tasks are the most g-loaded
-reading improves cognition
-schooling teaches reading
-IQ improves as schooling expands
Logical conclusion: IQ is a proxy for literacy
This makes more sense than all your estimations of IQ from “number of splits” or brain size. The former being based on nothing, the latter being based on a much weaker correlation coefficient than literacy or education.
Even among people with the same years of completed schooling, literacy scores differ enormously.
Not enormously, but it’s due to the fact that in Western countries, students are kept in school even if they’re not learning due to legal school-leaving age and lowering standards for students to graduate. There is no such thing in the developing world where students only stay in school if they’re learning, or if they can afford to stay in school (which is correlated).
Which shows the absurdity of you claiming years of education is the only cause of national IQ gaps. Countries can differ in all kinds of ways that affect IQ, beyond just mean schooling, with apartheid being an example.
I’m not exactly making this claim, I’m claiming that IQ estimates make much more sense if they’re calculated as if years of schooling are treated as the only cause of variance. I accept an error margin of 5 points, but not an error margin of 20 points as seen in China or Jamaica. And the only reasons to explain Lynn’s senseless estimates is that he wanted to make it seem like race is the only predictor of IQ. Otherwise, you need to explain why the Chinese have such poor educational and socio-economic indicators and despite a supposedly superior IQ which is claimed to be the best predictor of those things. And you have to explain why Jamaica is in the opposite situation.
So now that your claim that years of schooling is the only cause of national IQ differences has been debunked, you’re now claiming that even while still in school, countries that are X numbers of years less schooled than Great Britain are also X number of years behind in actual learning even before they dropout.
No, you don’t get it. Those who remain in school are learning something, those who persist into college probably have learned more than Britons who have watered down diplomas. You’re forgetting that many in the developing world are schooled in excellent private schools or have private instructors to help them. Those who drop out are mostly poor, rural and attending underfunded public schools. School life expectancy roughly estimates the size of this population that brings the national average down.
If so, by the time they’re adults they are effectively 2X years behind Great Britain in schooling, so by your method, all the IQ gaps should be double by adulthood. So when you claim Africa’s mean IQ is 72, because they average 7.57 years less schooling than Great Britain, and each missed year deducts 3.7 points, you’re actually claiming that by adulthood, they’re effectively 15.14 years less schooled than Great Britain.
Great Britain IQ – 15.14(3.7) = Adult African IQ of 44
Absurd!
What’s truly absurd is the strawman you’re attacking. I make no claim on an average African IQ to begin with. The African IQs that I estimate go from 58 to the high 80s. Secondly, your assumption that I’m implying that years of education could be twice less effective in improving IQ in Africa is absurd, which is why neither me or anyone else estimates an IQ of 44 for African adults.
Now, would you care to explain which data point looks anomalous to you, and why?
But the two are correlated so the correlation between national education and GDP is partly just rich countries being able to afford to educate the masses.
Partly, but international income variation is more subtle than just rich versus poor, and countries of similar GDP/capita can have vastly different school expenditure.
They’re not mutually exclusive. The causation would work in both directions thus making the correlation extra high.
No, oil rich countries trump the correlation for instance, and their lower IQ than expected from GDP reflects their severe lack of education spending.
Actually it may show just the opposite. Correlations are expected to decline when you restrict the range of scores which is what you did by removing African countries:
http://davidmlane.com/hyperstat/A68809.html
Lynn’s declining predictive power is exactly as expected. It’s your numbers that are behaving suspiciously.
No, for instance, Lynn’s correlations are higher within the top 20 than in the whole list. So range restriction does not affect Lynn’s correlations.
Such arbitrary decisions on your part create the appearance of data manipulation.
It’s a well justified decision, I wanted to remove outliers like countries at war, resource rich countries, and not having Luxembourg given the same weight as China in my calculation. So I chose to include only the top 20 countries for my data to still be representative of 70% of the world’s population. Lynn’s correlations did not suffer from my choice, and my correlations were stronger in both lists.
Anyway, you’re forced to acknowledge that years of education are a better predictor of every outcome that Lynn claims to be caused by IQ than IQs estimated by Lynn himself.
Height explains FAR MORE of the variance in childhood weight than IQ explains variances in adult education.
Who cares? You know full well that obesity becomes higher in adulthood. And what we’re discussing is the analogy you made with Samoans, which made no sense. The cause of their obesity is known, what is unknown is the weight/height correlation among them. I use years of schooling as a good proxy for IQ, which makes much more sense than you using brain size and just saying “some exceptions have to be expected” when things do not add up. Again, tell me which country estimates do not add up in my chart.
That’s because for other international data points we have excellent country by country data points.
My estimates are based on such excellent country by country data points. As a result, all the correlations I find are stronger and invariant.
No, it assumes nothing about cause. It’s just the well known principle of aggregation:
A principle that you’re misinterpreting.
It applies when you’re measuring the same thing. It’s absurd to estimate an “African IQ” unless you assume that a Nigerian sample can be treated as representative of a Gabonese sample. If you say they’re representative, you must justify it, and Lynn’s justification is that countries of similar ancestry have the same IQ.
Actually they do, particularly in fields where they don’t have the luxury of reliable data, for example in anthropology they might estimate the brain size of an extinct hominin based on just a couple skulls of unknown representativeness.
Anthropology more often presents these characteristics as a range, instead of a confirmed average in the way Lynn says the average IQ of Africa is 68 without mentioning the possibility of high variation between countries.
Anyway, anthropology is a thing, demographics and economics statistics do not publish data of insufficient reliability, neither do they write books about it.
I know Lynn’s numbers seem very wrong for Australian aboriginals so I would not be surprised if he’s wrong or biased in a lot of other areas too, but your article didn’t land a single punch.
It did, it did prove that whatever the meaning of my estimates, they’re a better predictor of everything Lynn claims to be caused by his national IQ.
No gullible is you arguing the average adult African IQ is 44 and not even realizing you’re arguing that.
Can you tell me where I’m estimating an average adult African IQ? You’re the only one making things nonsensical here. Look at your blog, it’s a complete disaster.
LikeLike
verbal tasks are the most g-loaded
Actually on the most recent Wechsler adult intelligence scales, the non-verbal figure weights subtest is the most g loaded:
https://www.ncbi.nlm.nih.gov/pmc/articles/PMC3263563/
Also, the heritability of IQ, along with its correlation with physiological traits like brain size and reaction time doesn’t fit by your claim that IQ is merely a function of schooling.
Logical conclusion: IQ is a proxy for literacy
Your estimates aren’t based on literacy but on years of schooling.
This makes more sense than all your estimations of IQ from “number of splits” or brain size.
No it makes no sense at all to estimate IQ from years of completed schooling, when you’re comparing the estimates to IQ scores of kids who have not yet completed school.
I’m not exactly making this claim, I’m claiming that IQ estimates make much more sense if they’re calculated as if years of schooling are treated as the only cause of variance. I accept an error margin of 5 points, but not an error margin of 20 points as seen in China or Jamaica. And the only reasons to explain Lynn’s senseless estimates is that he wanted to make it seem like race is the only predictor of IQ. Otherwise, you need to explain why the Chinese have such poor educational and socio-economic indicators and despite a supposedly superior IQ which is claimed to be the best predictor of those things. And you have to explain why Jamaica is in the opposite situation.
As I already explained, Lynn’s data is not reliable enough to be taken literally at the national level, only by averaging all the countries in a given category does it yield useful data.
Secondly, you need to look at the ages of those tested. If they were school kids, perhaps China’s IQ goes down if they were tested as adults and Jamaica’s IQ goes up.
Lastly, if race does affect IQ, then we’d expect an uneducated East Asians to have higher IQs than educated blacks, for the same reason we expect short men to have more weight (especially fat-free weight) than tall women: The sex-weight correlation trumps the height-weight correlation, so perhaps the race-IQ correlation is trumping the education-IQ correlation.
No, you don’t get it. Those who remain in school are learning something, those who persist into college probably have learned more than Britons who have watered down diplomas. You’re forgetting that many in the developing world are schooled in excellent private schools or have private instructors to help them. Those who drop out are mostly poor, rural and attending underfunded public schools. School life expectancy roughly estimates the size of this population that brings the national average down.
No you don’t get it. Forget about private vs public schools and just focus on the average African since we’re discussing averages. If the average black African 8th grader is 8 years less educated than the average British 8th grader, as he would have to be for your schooling theory to explain the low IQs at young ages, then what happens if he decides to drop out in the eighth grade? By the time he’s 25 he’s still going to be 8 years behind a British 8th grader, and thus 13 years behind same age Brits, so by your own formula (deduct 3.7 points for each year behind in schooling) he’d have an IQ around 50.
No, for instance, Lynn’s correlations are higher within the top 20 than in the whole list.
Then the increased correlation among the top 20 is what needs explaining, not the reduced correlation when black Africa is removed, which is expected from range restriction.
It’s a well justified decision,
Anything can be justified post-hoc, Afro. As Mark Twain liked to say, “there are lies, damn lies, and statistics”
Lynn’s correlations did not suffer from my choice, and my correlations were stronger in both lists.
Yet your education-GDP suspiciously correlation skyrocketed after you manipulated the data.
Anyway, you’re forced to acknowledge that years of education are a better predictor of every outcome that Lynn claims to be caused by IQ than IQs estimated by Lynn himself.
Your own matrix shows that before you excluded Africans, Lynn’s IQs correlated better for most outcomes.
Who cares? You know full well that obesity becomes higher in adulthood.
But even in adulthood weight and height are almost as highly correlated as IQ and years of education
And what we’re discussing is the analogy you made with Samoans, which made no sense. The cause of their obesity is known,
And Lynn would claim the causes of the IQ-education mismatches you document are known, you just don’t agree with his explanation.
what is unknown is the weight/height correlation among them.
And you don’t know the IQ-education correlation in 90% of the countries you discuss.
I use years of schooling as a good proxy for IQ, which makes much more sense than you using brain size and just saying “some exceptions have to be expected” when things do not add up.
I tried to see how well brain size could predict the IQs of populations, but I didn’t assert than any exceptions are caused by the IQ data being manipulated, nor did I suggest a crude proxy variable should replace studies of directly measured IQ, which is what you’re doing.
Again, tell me which country estimates do not add up in my chart.
I already cited a massive study by Owen giving a much lower IQ for South Africa than you give.
My estimates are based on such excellent country by country data points. As a result, all the correlations I find are stronger and invariant.
Again, it’s analogous to taking excellent country by country data on weight and using it to estimate height, and then claiming Samoans must be taller than whites since they’re heavier, and claiming any data to the contrary is manipulated. As black national merit scholar G-man correctly observed, your logic is circular.
It applies when you’re measuring the same thing. It’s absurd to estimate an “African IQ” unless you assume that a Nigerian sample can be treated as representative of a Gabonese sample.
No Afro, it doesn’t assume the two populations represent one another, the only assumption is that Nigerians and Gabonese are both samples in larger population (the larger sample could be black Africans, or it could be all humans). The point is data from any specific country is likely to have error, but if the error is random (i.e., no deliberate manipulation), overestimates and underestimates will tend cancel each other out as more countries are included, so the average IQ for all black Africa will be more accurate than the average IQ of any one country in black Africa, and the average IQ of the entire World, will be more accurate than the average IQ for a specific region like black Africa.
It did, it did prove that whatever the meaning of my estimates, they’re a better predictor of everything Lynn claims to be caused by his national IQ.
No they’re not better predictors in most cases according to your own matrix, and even if they were, so what? It’s like saying weight is a better predictor of success in the NFL than height is, thus the height data is inaccurate. Makes no sense.
I’d expect education to better predict GDP because both education and GDP reflect a country’s level of development as Melo implied below, and because education reflects not only IQ but also hard work and skills. For the same reason I’d expect basketball skill to better predict success in the military than height, since height merely reflects height, while basketball skill reflects height combined with coordination and team work.
Look at your blog, it’s a complete disaster.
You’re just mad cause your article’s a hot mess, as G-man and Melo have observed. Attacking my blog wont save it.
LikeLike
Hello Pumpkinsperson, I’ve heard about you.
You should know that there is nothing which give us clear proportion of the heredity of IQ:
https://www.youtube.com/watch?v=mWBOxz5lA_4 (it’s a video which was approved by an actual geneticist so…)
Even adoption studies tell you nothing important about IQ/heredity on race:
http://www.mdpi.com/2079-3200/5/1/1/htm
IQ probably do not test what you want it to test: http://citeseerx.ist.psu.edu/viewdoc/download?doi=10.1.1.110.9895&rep=rep1&type=pdf
IQ do not really predict job performance:
https://www.ncbi.nlm.nih.gov/pmc/articles/PMC4557354/
So yeah, your position is nothing but a theory, not a fact.
LikeLike
PP,
We have already discussed in the past the problems of heritability assumptions in twin studies. Overestimation of heritability is a problem. (I will expand on this later.)
Again, as we’ve been through before, useless. Size doesn’t matter for brain size. Erectus, microcephalics normal/above average IQ, expertise, tramatic brain injury, etc (Skoyles, 1999; Skoyles and Sagan, 2002: 240-244).
Such small correlations of .2-.3 show that there are numerous other factors that effect RT than ‘speef of processing’ including (but not limited to): “misunderstanding instructions, familiarity with equipment, motivation to do the task, sensory acuity, learned response strategies, time spent on sensory processing and motor action rather than decision time, attention, arousal, task orientation, confidence and anxiety. Such research appears to be up another cul de sac. But, like frustrated yet hopeful prospectors, IQ devotees keep returning to RT” (Richardson, 2017: 91).
RT is also trainable (Dye, Green, and Bavelier, 2011; Green and Bavelier, 2012), so due to this I don’t think it’s a good correlate for ‘g’ (whatever that is).
LikeLike
I just cannot understand how South Asian IQ is so low. How can Indian IQ be lower than Amerindian IQ when India was vastly more important than south America in world history, as well as contributing much more in terms of science and culture? It just doesn’t make sense to me. And if Indian IQ is basically African-tier, how is it Sri Lanka scores in the low 90s?
LikeLike
Because they are poor countries with low education. IQ is not about race
LikeLike
Because his numbers are not the IQs of those countries, they’re the IQs countries would have if years of schooling were the only cause of national IQ differences.
LikeLike
Because his numbers are not the IQs of those countries
Neither are Lynn’s, they’re the unweighted average of un-professionally selected samples.
they’re the IQs countries would have if years of schooling were the only cause of national IQ differences.
Which is likely the case.
LikeLike
@Afrosapiens It’s obviously not the case. Compare Saudi Arabia to Finland, Vietnam to South Africa, China to Egypt.
India may have had a higher environment-adjusted avg IQ in earlier times, or, more likely, the difference is just due to different population densities, which was a more important variable than avg IQ in ancient times.
LikeLike
South Africa is more developed than Vietnam, China slightly more than Egypt, Saudi Arabian citizens are richer than Finns.
or, more likely, the difference is just due to different population densities, which was a more important variable than avg IQ in ancient times.
Yes, IQ makes no sense in historical comparisons.
LikeLike
We’re not talking about development here, but average national IQ. South Africa obviously has a lower avg IQ than Vietnam, Saudi Arabia much lower than Finland, Egypt much lower than China. This is clear from the test score data, as well as from the bulk of anecdotal evidence.
LikeLike
Pithom, what about dismissing Afrosapiens’s data and correlation to make your point. You say that his IQ average can’t be true without any correct arguments so go ahead, destroy his correlations
LikeLike
more on twitch fiber bullshit.
as people get older their fiber composition changes. the type ii are converted to type i.
then there’s kim collins. the fastest time he ever ran he ran at age 40.
9.93s
While the 9.96 will remain as the M35 World Record, at age 40 years, 54 days, in a new age category, Collins improved his national record to 9.93 +1.9 at the NRW Gala in Bottrop, Germany.[4] He is the first man over age 40 to break the 10 second barrier. This yet again extended his own record as the oldest man to run a sub 10 second 100m, which continues with each sub-10 performance.
voltaire is unpopular in france. french is now JEWISH . sad!
voltaire said: I Disapprove of What You Say, But I Will Defend to the Death Your Right to Say It
LikeLike
Put this in the relevant threads on fiber typing. Thanks.
LikeLike
“as people get older their fiber composition changes. the type ii are converted to type i.
then there’s kim collins. the fastest time he ever ran he ran at age 40.”
Was this finding consistent with people who trained or did this apply just for those that didn’t?
LikeLike
Phil, please reply to off-topic comments on the other thread.
LikeLike
(approx) 90 for barbados certainly makes more sense than the 79 figure given by Lynn.
I figured that that it was likely to be too/inaccurately low (not too surprising since it’s from Lynn), and that the real average was likely closer to the approximately 91-93 for the Bahamas, and the somewhat higher figure for Bermuda. I look forward to seeing more data from the region (and others).
LikeLike
Yeah, the low 90s is what we must expect from Barbados’ socio-economic indicators. Contrary to Lynn’s estimates, there is no black nation in the Caribbean that can realistically score below 80, except Haiti for which I estimated an IQ of 73, which is still higher than the scores in the 60s that Lynn and even Malloy estimated for this country. Subsaharan Africa’s middle-income economies also score in the 80s.
Lynn’s estimates are worthless.
LikeLike
“Jm8 = peepee.”
I’m definitely not PP, that’s for sure.
(perhaps I’m misunderstanding something)
LikeLike
Don’t mind mug of pee.
Peepee shows signs of mental retardation that no one could fail to notice.
LikeLike
Edit: “(perhaps I’m misunderstanding something—I most likely am)”
LikeLike
“how much does learning to speak english increase a frenchman’s IQ? another very important question.”
I wondered that too, just after reading your last post (on Anglophone vs francophone blacks.
LikeLike
Don’t mind mug of pee, he’s trolling and since he uses my gravatar, his comments are now in the trash.
LikeLike
“RealAfrosapiens” is mug of pee/mugabe/ian smith/ilovehitler/whatever stupid name.
Now about African countries, first there aren’t real Francophone/Anglophone Africans, these countries have official languages that are inherited from colonialism but virtually none is spoken as a mother tongue by Black Africans.
Secondly, I don’t see a real difference. The lowest of the lowest estimates are in the Sahelian belt and the horn of Africa. These countries are very rural and barely touched by modernity. But I can’t see a link with French colonialism, since countries like Benin, Togo, Cameroon, the Congo(s) and Gabon which are more modern also have higher estimates, the highest being Gabon: 84.
LikeLike
Edit: “…reading your last comment (on anglophone vs. francophone…”
LikeLike
That was him? Strange that I didn’t notice the different name (from yours). That’s weird, well don’t I feel dumb. It makes sense now that it was a troll
LikeLike
LOL! Never mind.
LikeLike
“Now about African countries, first there aren’t real Francophone/Anglophone Africans, these countries have official languages that are inherited from colonialism but virtually none is spoken as a mother tongue by Black Africans.
Secondly, I don’t see a real difference. The lowest of the lowest estimates are in the Sahelian belt and the horn of Africa. These countries are very rural and barely touched by modernity. ”
Yeah, that makes a lot more sense. I should have checked the data.
LikeLike
Edit: “…Yeah, that makes a lot more sense. I should have checked the data—a bit of a mental lapse on my part I guess..
LikeLike
It happens 😉
LikeLike
To AfroSapiens:
The new report by Becker, (whatever other problems it may have)—and which I saw you commented on at Unz where James Thompson discussed it—, finds an IQ of 93 for Barbados (from IQ test data)—and 91 for the Bahamas—. So we can at least but to rest Lynn’s claim that Barbados scores at 79 (it’s clearly higher, ca. low-mid 90s).
LikeLike
True, but look how other commenters react at the sight of European countries scoring in the 80s. People will not get over Lynn’s hierarchy.
LikeLike
Cont:
Becker link:
below under “favorites” as well as under “national”:
https://drive.google.com/file/d/0B3c4TxciNeJZWUx5bzBWZ1BuMUk/view
Edit:
“(despite the other problems it may or likely has, underestimating the IQs of many other countries)—and which I saw you commented”
LikeLike
Edit: “…93 for Barbados (from IQ test data)—and 91 for the Bahamas—. So we can at least put to rest Lynn’s claim…”
“*put to rest”—mistakenly written at first as “but to”…
LikeLike
Also, the Barbadian data was actually from people afflicted with kwashiorkor and marasmus, or people that had at one time/as children been afflicted (yet two more—in addition to all the others—diseases/afflictions that can significantly lower IQ). So it seems maybe it’s possible that healthy Barbadian controls could score higher.
“Long-term effects of early kwashiorkor compared with marasmus. II. Intellectual performance.”
https://www.ncbi.nlm.nih.gov/pubmed/3119812
“Relation of Kwashiorkor in Early Childhood and Intelligence at School Age”
https://www.nature.com/pr/journal/v5/n11/pdf/pr1971371a.pdf?origin=ppub
LikeLike
Indeed. I think I remember this study. I posted a while back on peepee who dismissed it out of disbelief
LikeLike
Also, the kwashiorkor/marasmus information is in the “Collection” section of the Becker (google sheets) IQ link I linked.
“…who dismissed it out of disbelief”
Yeah. He does seem to have a way of doing that.
LikeLike
Minor correction:
One Barbadian study/sample used (in the aforementioned Becker study) came from a group of normal Barbadian adults who averaged at an IQ of 94 (though the study also found/reported a sample of adults who had been malnourished in infancy and they scored at only 78—much lower than the healthy controls who scored 94—a difference of 16 points).
The other sample came from a study of adolescents in which some had suffered from kwashiorkor of marasmus as young children, but only the healthy controls’ score was used (they scored around 90, at 89.5), and the afflicted groups (with kwashiorkor or marasmus) scored considerably/quite significantly lower)—the sample came from a study comparing afflicted and less affected/relatively healthy Barbadian adolescents, and finding large differences (I cited it above). In both studies, both affected samples and healthy controls came from about the same socio-economic background (in one study many across both groups were siblings)
So the combined average for Barbados, as mentioned, was 93.
Also, interestingly , the sample with the higher score (94) was more recent (Weber 2014) than the other one (Galler 1987), so perhaps this is due to/part of the Flynn effect (at least partly). though, the higher scoring sample is older than the other one (adult vs adolescent), and the ages are far enough apart that it may perhaps be a bit more something like improvement within a cohort due to educational or other environmental factors, than an across cohort effect—though the report mentions that severe infant malnutrition is now much less common than when the study was done, so a recent rising IQ effect may be likely at least partly due to that, and a recent low-mid 90s score should, as the studies show, be expected for the country.
“Thus, whereas moderate-severe cases of infant malnutrition were of significant concern when this study was undertaken in the 1970’s, infant malnutrition is now virtually eliminated from the island due to its improved economy and the impact of island-wide nutrition-related education”
(those afflicted with kwashiorkor or marasmus—excluded from the healthy controls in the second mentioned sample/study— scored iqs much lower than the others at 74 and 72, showing the significant iq depressive effects of those conditions and malnourishment, suggesting that the depressive effects of likely even worse conditions—like malaria, hookworm, etc—common in poorer countries in Africa and elsewhere, could be even worse/more severe, especially when combined, as they likely often are, with conditions like kwashiorkor, marasmus, other forms of malnutrition etc.)
https://www.ncbi.nlm.nih.gov/pmc/articles/PMC4131534/
“In 2006, the BNS undertook to assess outcomes in its participants in mid-adulthood, including neuropsychological, psychiatric, and social functioning, as well as physical health. There was an estimated 9-fold increase in the prevalence of IQ in the range of intellectual disability (≤70) in the previously malnourished group, and basic academic skills were significantly depressed, even after adjusting for the effects of standard of living throughout childhood and adolescence (Waber, et al., 2013).”
“Long-term effects of early kwashiorkor compared with marasmus. II. Intellectual performance.”
“The effect of early malnutrition and related conditions at the time of episode still emerged as significant even when the current environmental factors were controlled for.”
In a Mexican study, healthy vs. afflicted differences of a similar magnitude:
https://www.nature.com/pr/journal/v5/n11/pdf/pr1971371a.pdf?origin=ppub
“Measured intelligence at school age was compared in 37 previously severely mal- nourished children and their siblings. The malnourished children all had been hos- pitalized for kwashiorkor…”
“The siblings had never experienced a bout of severe malnutrition requiring hospitalization. The sibling controls were all within 3 yearsof age of the index cases. Full scale WISC IQof the index cases was 68.5 and of the con- trols 81.5. Verbal and performance differences were of similar magnitude and in the same direction.”
LikeLike
Edit: …”and the groups’ ages/dates are far enough apart given the respective dates…”
LikeLike
Edit “…(the study also contained/reported a sample of adults who had been malnourished in infancy and they…”
LikeLike
Edit: “In studies, both affected samples and healthy controls came from generally similar socio-economic backgrounds, “recruited as children from the same classrooms and neighborhoods” (Waber 2014). (in one study, the last one from Mexico, those across both groups were siblings, thus from the same background).
The Waber study mentions that: “…Although these environmental influences (my note: socio-economic correlates like parental education, income etc.) were themselves systematically associated with cognition and academic achievement as would be expected, they nevertheless did not mediate the association between malnutrition and cognitive compromise (Galler, Ramsey, & Forde, 1986; Galler, et al., 1983; Waber, et al., 2011).”
LikeLike
I can’t get behind some of these numbers. Spain adult average at 87? An 85 IQ precludes you from most basic work competency, according to neuroscientist, Richard Heiar. I can’t imagine half of Spain’s population being completely extraneous. These numbers have to be wrong.
LikeLike
I was equally surprised by Spain’s adult IQ below 90. But here is how I explained it to myself:
-Spain’s adult population is very old and grew up under a fascist dictatorship, when the country was poor, education was poorly funded and brain drain was high. We see the same low adult IQ in Portugal and Greece. These three southern European country have the same history and a large inter-generational gap, which is indicative of a large Flynn effect. I wonder how developed they would if they hadn’t joined the European Union which highly subsidized them. We have clues that Greece is not entirely able to manage a first world economy independently like Germany and France do.
I don’t believe in IQ thresholds. 85 is the supposed IQ of African American adults, and obviously, much more than 50% of African adults can be competent workers, they’ve been working in factories since the 1920s. I don’t even know what is “basic work competency”. Even in Niger, where I found an adult IQ of 57, people engage in crafts, agriculture, animal husbandry and trade and support themselves independently. You don’t see a population of impotent adults there.
My opinion on IQ tests is not that they reflect “intelligence” but IQ test competency and some aspects of logical thinking that depend on exposure to formal schooling.
These numbers have to be wrong.
I think your interpretation is wrong. Because whatever you think of these numbers, in the case of Spain, it’s the conversion of an average educational attainment equaling middle school dropout level.
LikeLike
That’s what I found on education and skills among Spanish adults.
Click to access Country%20note%20-%20Spain.pdf
Click to access Spain-EAG2014-Country-Note.pdf
The OECD is the organization that manages the PISA ranking.
LikeLike
Wow, I’m really surprised to see a race realist allowing a black man to give an credible opinion on IQ.
Don’t get me wrong, I’m not saying that race realist can’t be wrong but it’s nice to see people in this site actually trying to reach for an honest conversation.
People like tara mcarthy and the alternative hypothesis (Ryan Faulk) are far to narcissic to argue honestly, everyone has bias but Ryan and Tara can’t minimize their bias, in contrary to the owner of this site.
Kudos!!!!!
LikeLiked by 1 person
Hey Afrosapiens! Great article but pumpkinperson posted a criticism of your article which you didn’t respond: https://notpoliticallycorrect.me/2017/09/05/worldwide-iq-estimates-based-on-education-data/#comment-4231
I’m not claiming that you’re wrong and I’m not claiming that pumpkinperson is wrong, I’m just interested by your opinion on his comment.
Thanks
LikeLike
Yes, I’m replying very soon.
LikeLike
By the way Afrosapiens, what do you think of the alternative hypothesis last video?
It would be nice to have an great honest opposing view here.
LikeLike
Hi, sorry I’ve been busy lately. Back to you soon.
LikeLike
Take your time but be careful. The alternative hypothesis apparently edited the video he responded too to make it look like “shit”
Here’s the original video he responded too. There is an ongoing war between the alternative hypothesis and black lightning.
I’m just curious about your thoughts on their arguments. No need to be precise though.
LikeLike
I played most of both videos. I completely side with black lightening. I will elaborate on my opinion in a more detailed reply later.
LikeLike
Which IQ test are the most reliable then Afro? Since you proved that Lynn’s data is flawed.
LikeLike
Sorry, your comments were marked as spam.
Which IQ tests are the most reliable? I don’t think one is better than an other, Lynn’s data is biased because of confirmation bias in data selection.
There are many tests on the market, some pretend to be culture-fair so they are more often administered to non-western populations. But even the culture-fairness assumption is disputed.
Otherwise, when it comes to Westerners, the Welscher Adult Intelligence Scales is the most widely used test in psychology.
LikeLike
What are the most reliable IQ test then? Since you showed that Lynn’s data is flawed.
I try to post this comment numerous times but it doesn’t work everytime. Is it a problem with wordpress?
LikeLike
Will you go against other hereditarians?
Also, what do you think of adoptions studies showing Koreans at the top?
http://emilkirkegaard.dk/en/?p=5663
You can also click on the “adoption” tag from this blog to see 4 other article about adoption studies.
It seems to show that education is irrelevant among adoptees, what do you think of this?
LikeLike
Will you go against other hereditarians?
Yes, I will probably go against Alternative Hypothesis and Anonymous Conservative, he’s not really a HBDer but he keeps pushing an even more misinformed version of r/K than HBDers do.
Also, what do you think of adoptions studies showing Koreans at the top?
These studies have been debunked in a recent meta-analysis showing methodological flaws. Also, a recent Swedish study using non-adopted siblings as controls shows significant IQ gains lasting through adolescence that are associated with the level of education of adoptive parents.
LikeLike
What about you ron? Any links proving your claim?
Also, Afro may be right, see: http://www.mdpi.com/2079-3200/5/1/1/htm
Do you have anything beside using insults?
LikeLike
Verbal tasks are more g loaded because all sub tests are tests.
Also it’s fallacious to assume that any country could replicate Norway’s exact policies, when populations vary so much in culture,values, geography, genetics and size. I’d argue that access to communication and culturally stability would be better proxies. Plus this doesn’t quite fit reality to the T. With Australia supposedly being the most intelligent countries when south Korea and Nordic countries greatly outperform them in innovation. It is very evident how intelligent China is and even Philippine immigrants can be quite intelligent, so this is probably the least accurate for easy Asian type ethnicities, tho I would like to see the corrected data when you use east Asians as the standard.
But these numbers are far more accurate than lynns. I just don’t see how subsaharans could have the mental ability of elementary students
https://www.google.com/amp/s/www.bloomberg.com/amp/news/articles/2017-01-17/sweden-gains-south-korea-reigns-as-world-s-most-innovative-economies
LikeLike
I don’t think that you nailed the point of this article.
Maybe you should see Afrosapien’s responses to pumpskinperson just above.
LikeLike
The point was obvious, he even said it multiple times. He was simply converting years of schooling to projected IQ and then comparing it to lynns. Demonstrating that Lynn’s was possibly manipulated because his was more predictvely consistent. But the predictive power is also quite blatantly inflated because 1) he didn’t actually give anyone an IQ test and 2) as Pumpkin already iterated and Afro himself suggested, he assumes Schooling is the only casual factor regarding national IQ differences. It’s not actually predicting anything beyond what we already know, that education and intelligence are intertwined, what this study has accomplished is creating a more accurate framework for future HBD theories and even more IQ estimates. But of course Lynn’s data is still going to trump Afro’s in some aspects.
LikeLike
He already admitted that he accept a marge of error between 1-5 IQ point.
Also, china is overrated.
“About 84 percent of Shanghai high school graduates go to college, compared to 24 percent nationally.”
LikeLike
You’re misunderstanding. Lynn’s data is a better predictor of IQ because it actually administered IQ tests. The higher consistency within Afro’s correlations to HDI only persist because schooling itself is a better predictor of HDI than IQ not because Afro’s IQ scores are accurate. Schooling is a direct proxy of cultural/ technological development whereas IQ is a proxy for g potential.
LikeLike
Lynn’s work us garbarge.
Is IQ average are the unweighted average of un-professionally selected samples.
LikeLike
I guess, you’ll just keep missing the point. Fine with me.
LikeLike
What is g? ‘Processing speed’? ‘Power’? ‘Strength’? ‘Energy’? ‘Capacity’? Those terms are not scientific. ‘Intelligence’ also lacks a theoretical framework, which is why these unscientific terms are used in place of a sound, coherent theory of g and individual differences in ‘intelligence’. So-called ‘general intelligence’ is not physiological, it’s not ‘a thing’. As Muagbe say, is it like adiposity? Stroke volume? Blood cell count? If it is a physiologic process—as is usually claimed—then it must be similar to all of the others—with a wide variation of ‘normal’, with people living normal lives in a range of what is considered ‘normal’. We only notice something is off in extreme cases—i.e., extreme disabilities.
For instance, with blood pressure (BP), some researchers argue to change what is ‘normal’ (Taylor, Wilt, and Welch, 2011). There is also a 5 to 10 percent variation in serume cholesterol in the general population (Hegstead and Nicolosi, 1987) and people live good lives, even with the wide range of variation.
Reaction time being a proxy for g also fails since it falls prey to way too many confounds. Such small correlations (between .2 and .4) show that other factors mediate RT than ‘processing speed’. Ken Richardson states that differences in RT can stem from “‘misunderstanding instructions, to familiarity with the equipment, to motivation to do the task, to sensory acquity, to learned response strategies, time spent on sensory processing and motor action rather than decision time, attention, arousal, task orientation, confidence and anxiety” (Richardson, 2017: 91).
So which physiologic variable is g like?
LikeLike
By the way Melo, what do IQ tests test?
LikeLike
” So-called ‘general intelligence’ is not physiological, it’s not ‘a thing”
Don’t be silly. Studies on primates have verified that our brain is wired to be efficient at a wide range of mental tasks, meaning a g factor is neurologically observed.
“In this context, these reservoir networks reproduce the highly recurrent nature of local cortical connectivity. Recombining present and past inputs, random recurrent networks from the reservoir computing framework generate mixed selectivity which provides pre-coded representations of an essentially universal set of contexts. These representations can then be selectively amplified through learning to solve the task at hand. We thus explored their representational power and dynamical properties after training a reservoir to perform a complex cognitive task initially developed for monkeys.”
http://journals.plos.org/ploscompbiol/article?id=10.1371/journal.pcbi.1004967
The bais of other scientists does not reflect what is actually true. Meaning, just because lynn or rushton tried to imply inferiority to lower IQ races does not mean IQ is rank order in nature . We know from neurological studies that specific parts of the brain have differing functions Like the visual cortex and visual acuity and when these parts are damaged their are detrimental side effects.
“Damage to the left parietal lobe can result in what is called “Gerstmann’s Syndrome.” It includes right-left confusion, difficulty with writing (agraphia) and difficulty with mathematics (acalculia). It can also produce disorders of language (aphasia) and the inability to perceive objects normally (agnosia).
Damage to the right parietal lobe can result in neglecting part of the body or space (contralateral neglect), which can impair many self-care skills such as dressing and washing. Right side damage can also cause difficulty in making things (constructional apraxia), denial of deficits (anosagnosia) and drawing ability.”
https://www.neuroskills.com/brain-injury/parietal-lobes.php
Secondly, we know that Human brain size(specific components and absolute mass), network complexity, blood flow, neural density etc. have all increased dramatically over relatively short evolutionary periods, we know this from studies of archaic and modern groups so it would make sense that individuals have genetic variation in these traits and that selection has persisted of increased amounts of it.
Finally we know that the brain is a whole integrated system. The g factor on IQ tests is not fully reflective of the physiological aspect of g, IQ tests correlate well with eachother but they all test more or less the same thing, the body is controlled by your brain yet IQ tests do not measure Athletic ability, or musical, or even personality. All of which are mediated by the brain. All else equal an individual with more of the aforementioned traits will be more intelligent, in all categories not just on IQ tests. IQ tests simply measure reasoning ability and academic success which is evident by SAT scores. Even the glucose metabolisim thing is a variable in intelligence. Mental inclinations of individuals will be dictated by the proportion of their brain and which variable they have more or less of. But g itself is the aggregation of all those proportions. So within this instance two individuals can express the same g but have wildly different mental characteristics.
So this Idea that you cant tell the difference between an intelligent and less intelligent counterpart from Brain anatomy is beyond stupid, so go put on some 6 inch heels cuz you’re reaching.
LikeLike
So if g is physiological, which physiological/neurological process in the body does it mimic?
I agree. And if were physiological and if physiologists studied general intelligence, then they wouldn’t put it in a rank order. That’s bullshit that psychologists do.
Damage to the brain causes problems. This isn’t novel. However, a wrench in the claim of brain size being needed for high IQ is wrong, as I have discussed on traumatic brain injury.
There is individual physiologic variations in a whole suite of traits. I’ll get specifics later but there is a wide range of physiologic variables, and individuals can live good lives in that large range. So you’re talking about selection and individual physiologic variation. What is the explanatory theory for why individuals differ in so-called general intelligence? Jensen and Deary state there is no theory. That’s a huge problem, as I’ve repeatedly said. Other physiologic process have theories, for instance sliding filament theory which explains how muscles contract, but there is no theory for why individuals differ in so-called general intelligence.
Of course it isn’t, because 1) it’s not physiologic and 2) IQ tests cannot capture all of what we call ‘intelligence’, because it is strongly linked to culture (even Raven’s Progressive Matrices, contrary to Jensen’s (1998) claims).
This is the only kind of “construct validity” that IQ tests have; their correlation with other IQ tests. However IQ tests aren’t like breathalyzers, which is calibrated against blood alcohol volume. Drink more alcohol, then there is a concurrent rise in blood alcohol level. No such thing for IQ and IQ tests. No theory, no construct validity.
Read the paper ‘What IQ Tests Test‘ by Ken Richardson and get back to me.
There is neither a cause nor direction that is identified by such correlations with glucose metabolism.
I’m not reaching at all. There are other explanations other than “general intelligence” or “higher IQ” (whatever they are, or test).
LikeLike
“if g is physiological, which physiological/neurological process in the body does it mimic?”
You must not have fully red or understood what I was telling you, I lean more towards the latter because I’ve never viewed you as intellectually lazy.
Physically, the brain and It’s specifics is what reflects intelligence, I already cited neurological evidence which you ignored for some strange reason.
“brain size being needed for high IQ is wrong”
Well duh, but it does help, a bigger brain will translate to higher function. This is factual.
“What is the explanatory theory for why individuals differ in so-called general intelligence”
Genetic variation? I don’t know, why would every one have an identical brain?
“1) it’s not physiologic and 2) IQ tests cannot capture all of what we call ‘intelligence’, because it is strongly linked to culture (even Raven’s Progressive Matrices, contrary to Jensen’s (1998) claims).”
1) It’s a measure physiologic traits 2) No, that is not why.
I’m only going to repeat myself one more time so make sure you actually understand before replying this time. IQ only measures some aspects of intelligence, or only the magnitude of activity within specific parts of the brain. Wouldn’t you agree that physical ability is partly of intelligence? The brain does in fact control the body. An IQ test wouldn’t correlate much with football though but they’d both correlate with how healthy, how big, how many neurons etc etc you had in whatever region dictates whatever particular task you had to do in question. General mental ability is exactly that it wouldn’t be confined to just reasoning nd problem solving that’s so one dimensional, again and for the last time IS tests correlate with each other because they ‘ll test the same thing, the g factor is not synonymous with GMA.
“Drink more alcohol, then there is a concurrent rise in blood alcohol level. No such thing for IQ and IQ tests. No theory, no construct validity.”
False. Someone with the a higher number of neurons in the appropriate regions of the brain will score higher on an IQ test.
“Read the paper ‘What IQ Tests Test‘ by Ken Richardson and get back to me.”
I’ve read the paper, it’s not convincing. Rr do you even know what kind of questions are asked on the wais? No offense but youd have to be a complete moron to think IQ tests don’t measure some kind of mental aptitude
Maybe this study will give you closure
https://www.ncbi.nlm.nih.gov/pmc/articles/PMC2529190/
LikeLike
Sorry for the grammatical errors. If you have any trouble deciphering let me know so I can rectify it.
LikeLike
autism isn’t just a river in egypt.
rectify your own grammar meLo.
don’t ask the man to do it for you.
LikeLike
Well if he gets it then there is no need to. I’m not asking him to correct it, just to let me know if he doesn’t understand any particular statements. I’ve been using a phone for wordpress lately, which I’m not used to the autocorrecting feature at all.
LikeLike
I do not really think that you’ve read the paper about what does IQ test test Melo.
You seems to misunderstand RR’s point.
LikeLike
No, his point is irrelevant. The fact is that IQ tests do measure some level of cognitive aptitude and just because socio-economic status affects it doesn’t means it’s unreliable. Plus he assumes a Steadman that IQ tests measure every part of intelligence
LikeLike
Where do I assume that IQ tests measure every part of intelligence? Quote please. I’ll address your other comment later today. And no the point isn’t irrelevant.
LikeLike
MeLo, I guess you meant strawman that IQ tests measure every part of intelligence. You must realize how important it is, imagine what’d happen if rulers didn’t measure every part of a distance or thermometers every part of a temperature. That’d be a huge problem.
So as long as no one can link IQ to a measurable physiological process or a set of processes, research in this area will remain stuck to the correlation+conjecture stage as it has been for more than 100 years now.
LikeLike
Melo we also need to discuss how IQ tests are constructed.
Afro, good points. The physiological basis of g is very important. Correlations don’t cut it. And if it were physiological, as I have argued, then it wouldn’t be rank ordered. Would it make sense for g, if it were physiological, to be put in a rank order, the only physiological variable to be ranked? No it would not. Hereditarians don’t understand physiology.
LikeLike
Afro, RR,
“imagine what’d happen if rulers didn’t measure every part of a distance or thermometers every part of a temperature. That’d be a huge problem.”
First off, that is a false analogy. Why do you assume it should require one kind of test? We know which individuals have higher levels of GMA from neuroimaging, and we know how much of the variance in these measurements are due to intelligence. It can be quantified by Cortical thickness and Grey/white matter volume, Cortical glucose metabolic rate, but IQ is not the entirety of GMA. The brain is not a temperature nor is it a distance All of it is quantifiable but not to the point of translation into standardized mathematical model like the WAIS. Is there an IQ test for motor function, no but motor function still correlates with it.
http://www.jneurosci.org/content/19/10/4065
http://www.sciencedirect.com/science/article/pii/0160289688900165
http://www.nature.com/mp/journal/v17/n10/full/mp201266a.html?foxtrotcallback=true
http://www.sciencedirect.com/science/article/pii/S014976341500250X?via%3Dihub
https://academic.oup.com/cercor/article-lookup/doi/10.1093/cercor/bhl125
http://pediatrics.aappublications.org/content/130/4/e950.1
“So as long as no one can link IQ to a measurable physiological process or a set of processes Afro, good points. The physiological basis of g is very important. Correlations don’t cut it. ”
Except they have and still do as I already demonstrated, I’ll be expecting a response to those studies including the one one on macaques the next time you two respond. In fact there is actually a theory on individual intelligence differences, with enormous amounts of emprical data to back it up.
https://www.ncbi.nlm.nih.gov/pubmed/17655784
“Reviewing studies from functional (i.e., functional magnetic resonance imaging, positron emission tomography) and structural (i.e., magnetic resonance spectroscopy, diffusion tensor imaging, voxel-based morphometry) neuroimaging paradigms, we report a striking consensus suggesting that variations in a distributed network predict individual differences found on intelligence and reasoning tasks. We describe this network as the Parieto-Frontal Integration Theory (P-FIT). The P-FIT model includes, by Brodmann areas (BAs): the dorsolateral prefrontal cortex (BAs 6, 9, 10, 45, 46, 47), the inferior (BAs 39, 40) and superior (BA 7) parietal lobule, the anterior cingulate (BA 32), and regions within the temporal (BAs 21, 37) and occipital (BAs 18, 19) lobes. White matter regions (i.e., arcuate fasciculus) are also implicated. The P-FIT is examined in light of findings from human lesion studies, including missile wounds, frontal lobotomy/leukotomy, temporal lobectomy, and lesions resulting in damage to the language network (e.g., aphasia), as well as findings from imaging research identifying brain regions under significant genetic control. Overall, we conclude that modern neuroimaging techniques are beginning to articulate a biology of intelligence. We propose that the P-FIT provides a parsimonious account for many of the empirical observations, to date, which relate individual differences in intelligence test scores to variations in brain structure and function.”
https://www.ncbi.nlm.nih.gov/pubmed/20176936
“Statistically significant associations were found between g and damage to a remarkably circumscribed albeit distributed network in frontal and parietal cortex, critically including white matter association tracts and frontopolar cortex. We suggest that general intelligence draws on connections between regions that integrate verbal, visuospatial, working memory, and executive processes.”
https://academic.oup.com/brain/article-lookup/doi/10.1093/brain/aws021
“Here, we investigated the neural substrates of the general factor of intelligence (g) and executive function in 182 patients with focal brain damage using voxel-based lesion–symptom mapping. The Wechsler Adult Intelligence Scale and Delis–Kaplan Executive Function System were used to derive measures of g and executive function, respectively. Impaired performance on these measures was associated with damage to a distributed network of left lateralized brain areas, including regions of frontal and parietal cortex and white matter association tracts, which bind these areas into a coordinated system. ”
http://www.sciencedirect.com/science/article/pii/S0160289608000925
” The main findings are consistent with the P-FIT, supporting the view that general intelligence (g) involves multiple cortical areas throughout the brain. Key regions include the dorsolateral prefrontal cortex, Broca’s and Wernicke’s areas, the somato-sensory association cortex, and the visual association cortex. Further, estimates of crystallized and spatial intelligence with g statistically removed, still share several brain areas with general intelligence, but also show some degree of uniqueness.”
“And if it were physiological, as I have argued, then it wouldn’t be rank ordered.”
What do you mean by rank order? like in the sense that one rank is “better” than another?
LikeLike
meLo,
First off, that is a false analogy
Remember the first question: what do IQ tests test?
What do rulers and thermometers measure? Easy to tell, right?
What do IQ tests test? Can’t reply. They don’t measure a quantity of any physical/physiological reality. They’re a construct (IQ) intended to measure another construct (g). Astrologists must have these kinds of measurements too.
All the things you quoted below are correlations and associations, but no one can tell and demonstrate what causes these associations in a way I can tell you how blood oxygenation contributes to keeping organs alive.
Don’t get me wrong though, I’m not saying correlations mean nothing, I’m saying they prove nothing unless we can empirically observe what causes them.
LikeLike
IQ tests measure a bunch of things, do I need to name off sections? The point is we know that higher scores are associated with thicker grey/ white matter and the efficiency of neuronal connections in the brain. I demonstrated the correlation works backwards with my link to demonstrating exercise’s affect on the brain and the affect medical school training had on the brain. What do you suppose caused these increases? Most of the brain grows during adolescence which heavily implies a direct causal. Excessive increases the production of neurotrophic factors and learning increases neural connections and cortical thickness through neuroplasticity. Again, you can’t hand wave this evidence I already provided citations for the effects of trauma on the brain. IQ is a measurement of cognitive ability which has been shown time and time again to be caused by differences in brain structure/development
LikeLike
IQ tests measure a bunch of things, do I need to name off sections?
“a bunch of things” is not a valid biological value. Even if you mean “general mental health”, that’s not scientifically satisfying, no doctor would be interested in a “general health factor” that’d explain say 70% of the variance in life expectancy and then tell a patient with all the symptoms of HIV that he’s just fine and doesn’t need treatment because his general health score is okay.
The point is we know that higher scores are associated with thicker grey/ white matter and the efficiency of neuronal connections in the brain. I demonstrated the correlation works backwards with my link to demonstrating exercise’s affect on the brain and the affect medical school training had on the brain.
No meLo, these associations are nothing like explaining a physiological process like respiration causing lungs to absorb oxygen from the air, oxygen being then carried to the organs by blood cells which (or contributes to) ensures the survival of these organ’s cells. Oxygenation is measurable, it’s not a bell curve with values that are expressed in relation to what should be “normal oxygenation” in an hypothetical Gaussian distribution. You get that? You get that IQ is not a construct that originates from bio science and that meets the standard of a biological measure, right?
What do you suppose caused these increases?
What I suppose or what you suppose is not what matters, what matters is what causal mechanism one can observe in controlled laboratory experiment.
Most of the brain grows during adolescence which heavily implies a direct causal.
Wrong, most brain growth happens between conception and age 3.
However, if you mean that critical changes in some neural processes happen during adolescence, then it’s right, but you need to do more than imply that they are causal, you need to demonstrate it.
Excessive increases the production of neurotrophic factors and learning increases neural connections and cortical thickness through neuroplasticity.
Fine, then is it what IQ tests measure like thermometers measure temperatures?
Again, you can’t hand wave this evidence I already provided citations for the effects of trauma on the brain.
No hand waving, I just think we do not have the same definition of “evidence” and “measurment”. Your reasoning is post hoc ergo procter hoc, I tell you again, you’re not necessarily wrong, you’re just speculative and not getting beyond observing patterns of association whose underlying causes are not demonstrated, except for your point on neuroplasticity above which is the type of things that IQ should measure with a perfect correlation of 1.
IQ is a measurement of cognitive ability which has been shown time and time again to be caused by differences in brain structure/development
First, not exactly, the claim is that brain properties cause “g” which in turn causes most of the variance in IQ test scores, which only makes it a rough estimate. That’s what the most convinced psychometricians will tell you.
Secondly, we’re back to the core issues. What is the biological meaning of “g”.
For instance, the biological meaning of visual acuity is how cone cells process light signals and transmit information to your brain.
See more here: https://en.wikipedia.org/wiki/Visual_acuity#Physiology
And yet, even with a simple, well understood physiological mechanism, the measurement of visual acuity is not without problems.
https://en.wikipedia.org/wiki/Visual_acuity#Measurement_considerations
So, just imagine how thin is the scientific basis for claiming valid and reliable assessment of intelligence.
Hope you get my point this time.
LikeLike
This is insulting, you have not read any study I have presented and you continue to ignore evidence. The brain controls the body, we know factually that the brain creates a level of self awareness, essentially some parts of cognition are reactional, some are not. When certain parts of the brain are damaged these mental abilities are affected severely. This is evidence of direct causation. Like when you break your arm, your arm will cease to function properly. When you damage your brain it ceases to function properly. We know which parts of the brain control which cognitive functions, through the same processes that visual acuity is is actualized. Neurons send information across the brain. More neurons equals more information, but of course thays a simplification. So ive clearly demonstrated the biological reality of g, if youd like to learn more, read the paper on macacyes. Your assertion that IQ only measures some variance is correct, I don’t know why you assumed I believed the opposite, the normal distribution is one of the reasons why the correlation will never be 1. In fact Iq only measures some parts of cognition, which I already stated.
So you’ve added nothing new to the convo and still resort to semantics and hand waving.
I have shown direct causation, you have not demonstrated otherwise. MRI studies are not post hoc Procter hoc reasoning. So next time you want me to get the loint, you should make sure you actually have one.
LikeLike
meLo, don’t be so dramatic. I’m never claiming that cognitive ability has nothing to do with the brain. The point no one has been able to precisely identify intelligence in the brain. Identifying intelligence requires explaining how cells interact with each other and have their behaviors influenced by chemical elements to produce something that we can call intelligence.
Drunkenness is physiologically understood for instance, we know how alcohol molecules modify consciousness.
Moreover, brain injury, even severe, doesn’t necessarily impair cognitive function. There are also cases of brains rewiring themselves after injury. Reeducation can allow people to recover motor function after brain injury. So the brain is not a rock.
That said, none of your studies answer the question that is what do IQ tests measure. A bunch of things is not a reply, there is nothing that measures “a bunch of things” in science meLo.
LikeLike
I already showed that excersize increases compounds that affect neuronal growth. Neurons are the physiological agents of Intelligence. To put it as simple as possible for you, parts of the brain have varying functional purposes. When a specific task needs a solution, neurons fire between synapses to communicate sensory information with each other. This information translates to thought and then action. Consciousness is more or less than result of a need for hypothetical thinking when reactionary responses are inefficient. The p fit theory states:
“General intelligence requires specific brain regions and incorporates:
Sensory processing, primarily in the visual and auditory modalities, including specific temporal and parietal areas
Sensory abstracting and elaboration by the parietal cortex (especially the supramarginal, superior parietal, and angular gyri)
Interaction between the parietal cortex and frontal lobes for hypothesis testing available solutions.
Response selection and inhibition of competing responses by the anterior cingulate
This theory proposes that greater general intelligence in individuals results from the greater communication efficiency between the dorsolateral prefrontal cortex, parietal lobe, anterior cingulate cortex, and specific temporal and parietal cortex regions.”
We already know what parts of the brain have what function and recovery from brain trauma is even further evidence of causation. Neurons also form together to help increase memory capacit, The macaque study showed that neurons pool In reservoirs specifically so they can be used in all sorts of cognitive tasks, especially novel problem solving. And General intelligence is a reflection of the entire brain.
The WAIS tests: Verbal Comprehension Index (VCI)Perceptual Reasoning Index (PRI)Working Memory Index (WMI)Processing Speed Index (PSI)
None of those studies were meant to answer a stupid question, they all demonstrated the biological basis of g.
LikeLike
I’ll respond in depth to your other comment to me in a day or 2, I’m reading all the cites you provided again.
Uh? Who are you telling this to? I’m a CPT, I know this already. I even wrote an article on exercise and cognitive ability.
So PFI-T states ‘g’ requires specific brain regions and incorporates . . .
Here is a quote from Intelligence: New Findings and Theoretical Developments By Nisbett et al (2012):
This possibility is suggested by a review of 37 structural and functional neuroimaging studies of “intelligence and reasoning tests” by Jung and Haier (2007) in which they proposed a parieto frontal integration theory of intelligence (P-FIT) that was based on the identification of specific overall frontal and parietal brain regions as well as specific temporal and occipital areas that were reliably activated across most studies reviewed. The authors, as well as several commentators on the theory, however, noted the considerable heterogeneity in the findings of the various studies included in the review. Many brain regions were implicated by a small percentage of the studies, whereas relatively few were identified by more than 50% of the studies (Colom, 2007).
But that “stupid question” is very relevant.
And on brain trauma, I wrote an article about that. People with severe TBI can have IQs in the normal range. Numerous studies show this.
You’re saying that brain damage changes people a lot of the time and changes functioning… No shit. You need to review the studies I cited in my TBI article.
More thoughts in a few days after I reread all the studies you cited.
LikeLike
Melo,
Neuroimaging such as fMRI?
There have been problems with fMRI.
Not really:
We demonstrated that estimation of CT was not consistent across methods. In addition, among SBM methods, there was considerable variation in the spatial pattern of CT-cognition relationships. Finally, within each SBM method, results did not replicate in matched subsamples.
…
Nevertheless, the lack of replicability found in the literature could be extended to other relevant psychological variables, particularly when complex behaviors are considered.
Reproducibility of Brain-Cognition Relationships Using Three Cortical Surface-Based Protocols: An Exhaustive Analysis Based on Cortical Thickness
Further, we have problems figuring out what the connections between 302 neurons in a roundworm; we don’t know what all of the connections do. So if we have trouble figuring that out, something so ‘simple’, what do you think the human brain—with its tens of billions of neurons and trillions of connections—will take to unlock ‘the code’?
That intellectual functioning is both associated with cortical thinning and cortical thickening is puzzling.
Changes in Thickness and Surface Area of the Human Cortex and Their Relationship with Intelligence
“Quantified”? It’s just a correlation. If someone has less grey/white matter than someone else, then how many IQ points is that?
There are huge problems with this. Drinking a sugary drink can improve performance on one test (but not another).
Cognitive demand and blood glucose
Does Thinking Really Hard Burn More Calories?
And see my previous citation from Ken Richardson’s book The Making of Intelligence.
Meaningless. there are just correlations, nothing concrete.
There was a correlation between Halley’s comet and inflation. Which causes which? Does the appearance of Halley’s comet cause inflation or does inflation cause the appearance of Halley’s comet? It’s the question of the ages.
As I said in an earlier comment, most of HBD is just correlations; post hoc, ergo propter hoc.
So explain how and why individuals differ in intelligence, ‘g’ (whatever they are). I’d love to hear it.
All of those links on the PFI-T are observations (people do X better than others), not describing a theory of how and why individuals differ in so-called intelligence. Deary and Jensen state there is no such theory; I’ve yet to see anyone articulate such a theory. So this leads us to a very important question: if we don’t know what IQ/intelligence is nor how to define it, then how are we finding ‘genes for intelligence?
Now let’s get into the nitty-gritty.
Something I’ve been wanting to discuss is the construction of IQ tests. They have been deliberately constructed to exhibit a normal distribution but I will show that psychological traits are not normally distributed below. Furthermore, tests are devised by, as I’m sure you know, trying out the items in advance so that 50 percent of individuals get the answer correct while the smaller amount of items that the testees get are either right or wrong. So as you can see, it’s a forced normal distribution when few biological processes are normally distributed (physiologic processes, for example which ‘g’ supposedly is).
Traits that are important to survival are not normally distributed because natural selection produces numerous phenotypes which would be above average.
For Whom the Bell Holds: Performance distributions rarely fit a bell curve.
The study, “The Best and the Rest: Revisiting the Norm of Normality of Individual Performance” by Ernest O’Boyle Jr. and Herman Aguinis, presents a new paradigm for understanding why applying a normal distribution, that assumes the majority of individuals will perform in an “average” manner, does not present an accurate picture of the way that individual performance unfolds in an organization. In fact, as some of us may witness in our own organizations, the findings of this research provide evidence that the majority of work is carried out by a small number of people that out-perform the rest. Thus, the “picture of performance” is better represented by a Paretian distribution, which resembles the shape of a ski slope, where under-performers are at the upper most starting point of the slope and high performers are at the tip of the end.
The Best and the Rest: Revisiting the Norm of Normality of Individual Performance
Without that normal distribution, things start to crumble… IQ tests are constructed with the knowledge of who is going to be more ‘intelligent’ than another.
One thing that shows that IQ tests are tests of social class is the Flynn Effect. The rise in IQ scores coincides with the rise in the middle class. This also coincides with the fact that Flynn himself has said that the Effect is more noticeable on Raven’s Matrices (Richardson, 2002). Variance in IQ scores are explained by numerous socio-cognitive factors which differentially prepare individuals for said tests. Correlations between IQ and SES are meaningless too by the way (read Richardson, 2002).
And while that paper on individual differences and behavior/’intelligence’ is interesting, it does not articulate a theory of why individuals differ in so-called general intelligence. I’ll have more comments on that paper later.
Richard Haier writes: “The results indicate that g-scores derived from different test batteries do not necessarily have equivalent neuro-anatomical substrates, suggesting that identifying a “neuro-g” will be difficult.”
Gray matter and intelligence factors: Is there a neuro-g?
LikeLike
“Neuroimaging such as fMRI? There have been problems with fMRI.”
I’m aware but the bug that had been in the system for 15 years only occurred in AFNI and it only effects activation mapping studies not other methods like MVPA or DFC.
70% chance of finding at least one false positive does not mean that “70% of positives are false.
http://blogs.discovermagazine.com/neuroskeptic/2016/07/07/false-positive-fmri-mainstream/#.Wd6L0GhSyM_
“Not really: We demonstrated that estimation of CT was not consistent across methods. In addition, among SBM methods, there was considerable variation in the spatial pattern of CT-cognition relationships. Finally, within each SBM method, results did not replicate in matched subsamples. Nevertheless, the lack of replicability found in the literature could be extended to other relevant psychological variables, particularly when complex behaviors are considered.”
Yes really: Do you have a link to that study without a paywall? I’ve been trying to read it. Interestingly, I had noticed that the authors made a prior paper discussing P-FIT theory before, but I think they had changed the parameter they were criticizing to only cortical thickness the following year. Either way i have a study that was made after that analysis so it isn’t affected by the reproducibility problem(yet) and it uses Multi- voxel pattern analysis so It isn’t affected by any kind of bug either. Wow would you look at that it still confirms GMA as a real neurological concept
“Based on the available evidence, we hypothesized that diverse CCAs are all positively but only weakly associated with rGMV in widespread brain areas. To test this hypothesis, we used the data from a large sample of healthy young adults [776 males and 560 females; mean age: 20.8 years, standard deviation (SD) = 0.8] and investigated associations between rGMV and scores on multiple CCA tasks (including non-verbal reasoning, verbal working memory, Stroop interference, and complex processing speed tasks involving spatial cognition and reasoning). Better performance scores on all tasks except non-verbal reasoning were associated with greater rGMV across widespread brain areas. The effect sizes of individual associations were generally low, consistent with our previous studies. The lack of strong correlations between rGMV and specific CCAs, combined with stringent corrections for multiple comparisons, may lead to different and diverse findings in the field.”
And on top of that it even addresses your Martinez paper!
“it was concluded that although some areas in the frontal lobe (Brodmann area 10) and parietal lobe (Brodmann area 39, 40) were often significantly associated with psychometric intelligence (50% of studies), almost all brain areas analyzed showed some level of correlation with psychometric intelligence in at least some studies”
“his study found that different preprocessing methods led to divergent results in a sample of approximately 40 subjects; however, even if the same method was applied, results differed in the replication sample. Therefore, the sources of these inconsistencies are currently unclear. However, many previous studies also included relatively small sample sizes (N < 100) compared to more recent structural studies and thus lacked statistical power. In addition to low effect size and statistical power, it is also possible that the multiple areas showing significant associations with CCA in different studies are in fact functionally associated with diverse CCAs. A series of recent studies using huge sample sizes (N > several hundred) of young adults showed that associations between individual aspects of cognition and regional gray matter structure were generally low16. Moreover, our previous study on simple processing speed involving several hundred subjects showed that performance was positively correlated with widespread regional white matter volume (rWMV) across different simple processing speed tasks; furthermore, the strengths of the associations were generally low and no single area showed significant specific correlations between rWMV and simple processing speed. Based on these considerations, we hypothesized that diverse CCAs are all positively associated with rGMV in widespread areas but that each association is weak.”
Essentially indicating that g is a real phenomenon and that the variability of results is actually expected.
“In the late 1970s and early 1980s, several groups began exploring the impacts of removing portions of the sensory inputs. Michael Merzenich and Jon Kaas and Doug Rasmusson used the cortical map as their dependent variable. They found—and this has been since corroborated by a wide range of labs—that if the cortical map is deprived of its input it will become activated at a later time in response to other, usually adjacent inputs. At least in the somatic sensory system, in which this phenomenon has been most thoroughly investigated, JT Wall and J Xu have traced the mechanisms underlying this plasticity. Re-organization is not cortically emergent, but occurs at every level in the processing hierarchy; this produces the map changes observed in the cerebral cortex”
https://en.wikipedia.org/wiki/Cortical_map#cite_note-Wall_et_al_2002-2
http://www.sciencedirect.com/science/article/pii/S0165017302001923?via%3Dihub
“Further, we have problems figuring out what the connections between 302 neurons in a roundworm; we don’t know what all of the connections do. So if we have trouble figuring that out, something so ‘simple’, what do you think the human brain—with its tens of billions of neurons and trillions of connections—will take to unlock ‘the code’?”
Ad ignoratiam
“That intellectual functioning is both associated with cortical thinning and cortical thickening is puzzling.”
Modus Tollens. Plus, that same study states directly afterward:
“These changes may reflect important transitions from childhood to adulthood. Moreover, change in cortical thickness is only one aspect of cortical development; the surface area of the cortex is also of importance (Raznahan, Shaw, et al. 2011). Interestingly, changes in cortical surface area in relation to intelligence have not been studied in longitudinal designs in man, despite the fact that changes in the surface area may be as relevant to intelligence as those in cortical thickness have proven to be. Therefore, we examined the relationship between intelligence and cortical development, defined as changes in cortical thickness and surface over time in healthy human subjects”
“Thus, similar to the relationship between intelligence and cortical thickness, it is a greater change in cortical surface over time that is related to higher IQ rather than the absolute surface area: It is the individuals with highest IQ who showed the largest changes in the surface area during development.”
Essentially proving that intelligence and its mechanics(the brain) are sensory-experience dependent
https://en.wikipedia.org/wiki/Denying_the_antecedent
“Quantified”? It’s just a correlation. If someone has less grey/white matter than someone else, then how many IQ points is that?”
I don’t know how many IQ points that is but you could figure out how many neurons that is. Actually you could figure it out for IQ too possibly but there is no way it would be completely accurate. Also “its just a correlation” is a weak excuse. Please explain, when does a correlation become causal? We know that learning increases Neural connetions and brain volume so does excerise we know the correlations flow in both directions so this implies causality.
“Aerobic exercise promotes adult neurogenesis by increasing the production of neurotrophic factors (compounds that promote growth or survival of neurons), such as brain-derived neurotrophic factor (BDNF), insulin-like growth factor 1 (IGF-1), and vascular endothelial growth factor (VEGF).”
https://www.ncbi.nlm.nih.gov/pmc/articles/PMC4314337/
“Magnetic resonance images were obtained at three different time points while medical students learned for their medical examination. During the learning period, the gray matter increased significantly in the posterior and lateral parietal cortex bilaterally. These structural changes did not change significantly toward the third scan during the semester break 3 months after the exam. The posterior hippocampus showed a different pattern over time: the initial increase in gray matter during the learning period was even more pronounced toward the third time point. These results indicate that the acquisition of a great amount of highly abstract information may be related to a particular pattern of structural gray matter changes in particular brain areas.”
http://www.jneurosci.org/content/26/23/6314
So explain how and why individuals differ in intelligence, ‘g’ (whatever they are). I’d love to hear it.
They differ because of natural variation in Neuronal connections, the efficiency, the size, the density etc. these differences can of course be attributed to different experiences, and differences in genetics., they all have an affect on cognition and this has been shown multiple times. Read the paper[s], maybe you’ll understand better, In fact as mugabe says “still waiting”. You’ve yet to respond to my paper on macacues nor have you actually read any of my links. They all show neurological correlates with g, and its going to take more than hand waiving and half truths to make them go away.
“All of those links on the PFI-T are observations (people do X better than others), not describing a theory of how and why individuals differ in so-called intelligence. Deary and Jensen state there is no such theory; I’ve yet to see anyone articulate such a theory. So this leads us to a very important question: if we don’t know what IQ/intelligence is nor how to define it, then how are we finding ‘genes for intelligence?”
Jensen wouldn’t know shit about Neurology. You haven’t heard of such a theory because you haven’t researched at all. I literally only had to look at wikipedia to find Pfit theory. It is the dominant theory in neuroscience on individual intelligence differences.
“Something I’ve been wanting to discuss is the construction of IQ tests. They have been deliberately constructed to exhibit a normal distribution but I will show that psychological traits are not normally distributed below.”
Jesus christ, no shit. Go argue with some HBDer who thinks intelligence is normally distributed because I don’t. I would actually argue that 99.99999% of biological traits are not normally distributed. This is why people who say over representation is evidence of jewish conspiracy, are fucking retarded.
“One thing that shows that IQ tests are tests of social class is the Flynn Effect.” .
“Correlations between IQ and SES are meaningless too by the way (read Richardson, 2002).”
Those statements contradict eachother
“And while that paper on individual differences and behavior/’intelligence’ is interesting,”
“it does not articulate a theory of why individuals differ in so-called general intelligence.”
LMAO, as do these. And it does explain the differences in g you just didn’t read it as usual!
“Richard Haier writes: “The results indicate that g-scores derived from different test batteries do not necessarily have equivalent neuro-anatomical substrates, suggesting that identifying a “neuro-g” will be difficult.”
That’s nice, but what Haier was trying to accomplish was establishing a more concrete framework for scientists to build future studies on, which in fact they did as a majority of my links were using the necessary corrections that richard haier suggested in that paper, which you would know if you had actually read any of them. Even then, his study still showed good evidence for neuroanatomical g in regards to spatial ability
LikeLike
Damn, I forgot about this blog since days. Not only, I didn’t get a response for my post but also, I don’t even need to argue against the afrocentrist and the blacked centrist, you’re doing it better than me for that Melo, great job!
They can’t argue against recent studies, that’s why they ignore your recent studies, I don’t even care about old studies that I use to back me up anymore, recent are enough and establish well how races should be ranked going by intelligence.
Nature is racist
LikeLike
Which post didn’t you get a response to?
LikeLike
Do you remember his retarded tirade in French that’s in the trash?
LikeLike
Oh yea. I’ll run it through a translator and respond to it by the weekend.
LikeLike
I can’t guarantee that Google will be able to detect the language though. His French is illiterate.
LikeLike
Lol! Yeah don’t waste my time and share your insights elsewhere.
LikeLike
They ignore your studies because they can’t respond to it, you’re doing the gods work debunking those “facts denier”.
I know that one of them is black but the other is probably Indian or Mexican, that’s why they can’t accept facts
LikeLike
What “facts” do I not accept? Why do you assume motivation? You know what’s fallacious right?
LikeLike
I too am aware. I was going to ninja-edit my comment with Neuroskeptic’s article but said F it since I knew you’d cite it.
I am well aware. Did anything in my previous comment imply that I believed that? Please do not insult my intellect. Thank you.
Libgen busts through paywalls. Input the captcha.
In regards to the brain-imaging studies you cite, scroll to pg. 162 and read Norgate and Richardson’s (2007) response to Jung and Haier (2007):
Finally, we note that their whole model is based on a feedforward model of higher cerebral functions, which many would argue is outmoded. Looking for simple deterministic bases of intelligence variation does not reflect how the dynamics of the brain work (Freeman 2001). Having evolved to deal with changeable environments, cognitive systems must wring predictability from deep structures in the dynamic flow of information using massive reciprocal connections and cooperative processing between centres. This suggests quite different foundations for a theory of intelligent systems (Richardson 2006).
Intelligent systems is something that we must discuss in the context of this discussion.
but that each association is weak. How weak? How much of the variance in ‘CCA’ does it explain? If it’s anything like these new ‘genes for’ IQ studies explaining ~4 percent of the variance, then who cares? Is a low variance something to rejoice over?
I contest this. I wrote: Further, we have problems figuring out what the connections between 302 neurons in a roundworm; we don’t know what all of the connections do. So if we have trouble figuring that out, something so ‘simple’, what do you think the human brain—with its tens of billions of neurons and trillions of connections—will take to unlock ‘the code’? It was a question; I wasn’t stating that it wasn’t possible, just stating a truism: we have problems with such a ‘simple brain’ with so few neurons. Then expand that to the human brain with billions of neurons and trillions of connections. Not fallacious. I did not state that we would never know; just that with the current state of knowledge, there is a long, long road ahead.
I didn’t assume anything to be true just because something has yet to be proven false. I just made a statement of fact.
What are you Modus Tollens’ing? What you replied to was not an argument, it was a statement.
Modus Tollens is as follows:
P1: If X is true then Y is true.
P2: Y is false.
C1: Therefore X is false.
Where did I deny the antecedent? Please use syllogistic logic.
If p, then q. Not p. Therefore, not q.
Where did I use this argument form?
By the way, denying the antecedent is sometimes a legitamate argumentative strategy.
Anyways, here is the conclusion:
These findings suggest that intelligence is more related to the magnitude and timing of brain changes during development than to brain structure per se. The presence of cortical changes at all ages covered by this study also suggests that the development of the cortex is never completed, but rather continues to change depending on someone’s intelligence.
I would also add the fact that differing experiences would cause differences in brain volume/matter/thickness/etc as well.
Speaking of development, we need to discuss intelligent development/systems as well.
I disagree. See the conclusion (and my addition) that would affect these things as well.
If you knew how many neurons it was then would you know exactly how many IQ points it would be?
So what is the point if it would not be completely accurate? Imagine that weighing people had a huge margin of error and that it did not accurately depict weight at that point in time. Imagine if stadiometers had such wide variation and there were huge differences in measured height in, say, a few weeks between measures. Would that be a useful measure? One of my points about this so-called physiologial ‘g’ thing is this: if it is physiological, then 1) what are the causes and 2) if we find these causes, then, going back to my question, if someone had say less white matter than someone else, how many IQ points is that?
‘g’ is supposed to be ‘physiological’. But the way that ‘g’ is proposed does not fit any other physiological process that we know in the body!
Well for one, when one of the correlated values is controlled for and the correlation is still robust. And correlation is not really significant for causation too. Also see what the APA says:
Inferring causality from nonrandomized designs is a risky enterprise. Researchers using nonrandomized designs have an extra obligation to explain the logic behind covariates included in their designs and to alert the reader to plausible rival hypotheses that might explain their results. Even in randomized experiments, attributing causal effects to any one aspect of the treatment condition requires support from additional experimentation.
Statistical Methods in Psychology Journals: Guidelines and Explanations
As I said earlier, I know this. I wrote an article on this: Exercise, Longetivity, and Cognitive Ability
Just because exercise improves cognitive ability—from more oxygenation to the brain to bring up one example—doesn’t prove that there is a bio-basis to ‘g’.
1) I’m not handwaving. 2) They’re not ‘half-truths’.
I do understand it.
Re macaques: provide the main quote that backs your assertion. I read the paper twice.
The first sentence from the abstract: “Primates display a remarkable ability to adapt to novel situations.”
Primates display this remarkable ability to adapt to novel situations due to intelligent systems/physiology. This evolved due to the changeability of the environment and evolved due to organisms encountering novel and challenging environments. Thinking about the homeodynamic-ness of our physiology and how it evolved. Thus, it’s not about ‘variations in genes’, but it’s about how an organism can respond to novel, ever-changing environment.
See the response from Norgate and Richardson (as well as the others).
Neurology deals with disorders of the nervous system. Sure it’s the dominant theory, just like the CI/CO model is the dominant theory in obesity research.
I do concede that the Jensen quote was 9 years before the Haier and Jung study. See the numerous commentaries on the paper and we can discuss that as well (currently reading through them).
Are you serious? IQ tests are constructed with the assumption that human psychological traits rest on a bell curve! The book is not called “The Bell Curve” for nothing!
Psych traits aren’t normally distributed; so if psych traits are not normally distributed, then the assumption that IQ scores lie on a ‘bell curve’ (like all other psych traits) is incorrect.
No they do not. “You didn’t read the paper”, so you wouldn’t know.
The idea that IQ is, in effect, simply a measure of social class (here viewed as degree of sociocognitive-affective preparedness for IQ tests) is sometimes dismissed with reference to other correlations between IQ and socioeconomic status (SES) (Brody, 1997; Mackintosh, 1998). For example, Jensen (1998) says that IQ is only moderately associated with actual SES ratings, with typical correlations of only .3–.4 for children, and that IQ is a better predictor of adult social status than parents’ SES (therefore, that IQ is measuring something more than mere SES). As Jensen (1998) puts it, ‘SES is an effect of IQ rather than a cause’ (p. 491).
The problem with this line of argument is that of assuming that parents’ SES, defined almost always as current occupation, income or level of education, is itself a precision measure of social class. On the contrary, as Mills (1995) explains, ‘The economic and social factors are one thing: psychological feelings may or may not be associated with them in expected ways’ (p. 208). As Suzuki and Valencia (1997) concur, what parents ‘do’ is more important than ‘what they are’. Social class is a compound of the cultural tools (knowledge and cognitive and psycholingustic structures) individuals are exposed to; and beliefs, values, academic orientations, self-efficacy beliefs, and so on. Such factors are consistently better predictors of IQ and attainments than is SES (Martinez, 2000). Mackintosh (1998) reviews a number of studies showing that parental ‘attitudes’ to education and achievement are better predictors of children’s IQ than is SES. (pg. 298)
And:
This idea is supported by what has become known as the ‘Flynn effect’, after surveys showing the steady rise in average IQ scores in many populations over recent decades (Flynn, 1998; Neisser, 1998). This is a continuing puzzle to g theorists because it could not be due to genetic changes over the short period in question. And as Flynn (1998) notes, ‘IQ gains have not been accompanied by an escalation of real world cognitive skills . . . an evolution from widespread retardation to normalcy, or from normalcy to widespread giftedness’ (p. 61). These leaps in average IQs do, however, correspond to the demographic swelling of the middle classes over the period in question. This means greater exposure to middle-class cultural tools, improved self-esteem and self-confidence, as well as more specific] symbolic and technological procedures (Greenfield, 1998). This explanation for the Flynn effect is also supported by the fact that it is more prominent with non-verbal tests like the RPM than with verbal tests (Flynn, 1998). (pg. 297)
What IQ Tests Test—Ken Richardson (2002)
Please excuse my previous miswording.
No it doesn’t. Why do individuals differ in ‘intelligence’, this ‘mystical g’? What is the reason?? And what do you mean ‘as usual? I read everything that people provide me in discussions. Just because I don’t accept your arguments does not mean that I did not read the papers. I’m asking you to artculate a theory of how and why individuals differ in so-called ‘g’.
Also re P-FIT:
The authors, as well as several commentators on the theory, however, noted the considerable heterogeneity in the findings of the various studies included in the review. Many brain regions were implicated by a small percentage of the studies, whereas relatively few were identified by more than 50% of the studies (Colom, 2007).
Intelligence: New Findings and Theoretical Developments
Ouch…
Correct, ‘it is nice’. Anyway, the commentary from Norgate and Richardson is apt here.
LikeLike
RR,
“Uh? Who are you telling this to? I’m a CPT, I know this already. I even wrote an article on exercise and cognitive ability.”
I think I was talking to Afro.
“So PFI-T states ‘g’ requires specific brain regions and incorporates . . .”
?? Is that the only but information you’ve taken from these texts? Sad.
“Here is a quote from Intelligence: New Findings and Theoretical Developments By Nisbett et al (2012):”
I’ve provided conclusive studies linked to pfit theory after nisbett et al(2012)
Please provide relevant citations.
“And on brain trauma, I wrote an article about that. People with severe TBI can have IQs in the normal range. Numerous studies show this.”
No. This is dishonest of you. The majority of your studies showed that TBI was associated with lower IQ’s. “normal range” is 90-110.
“You’re saying that brain damage changes people a lot of the time and changes functioning… No shit. You need to review the studies I cited in my TBI article.”
I did, and if you understood my point you’d realize that this shows intelligence is seated in the brain. “intelligence” are thoughts and actions which are generated by neurons, the more efficient the communication of nuerons is between parts of the brain, the more intelligent it is.
“The oscillations are generated by rhythmic GABA-ergic inhibitory activity in interneurons with an extraordinarily high metabolic rate. The hubs are richly endowed with interneurons and therefore highly vulnerable to disturbed energy supply. Consequently, deficient paralimbic activity and self-awareness are characteristic features of many disorders with impaired oxygen homeostasis. Such disorders may therefore be treated unconventionally by targeting interneuron function.:”
A very interesting study on self awareness and the brain.
http://www.sciencedirect.com/science/article/pii/S0149763416300410
” after I reread all the studies you cited.”
You never read them to begin with.
“I am well aware. Did anything in my previous comment imply that I believed that? Please do not insult my intellect. Thank you.”
Well yes the fact that you presented it as a bigger deal than it was and tried to hand wave 15 years of research because of some cognitive dissonance. I don’t think you’re stupid RR. I wouldn’t converse with you if I thought you were.
” which many would argue is outmoded.”
Like who?
“Having evolved to deal with changeable environments, cognitive systems must wring predictability from deep structures in the dynamic flow of information using massive reciprocal connections and cooperative processing between centres. This suggests quite different foundations for a theory of intelligent systems (Richardson 2006).”
…..No, it implies our Intelligence would be general in nature, ESPECIALLY if we evolved to survive changing environments.
“Intelligent systems is something that we must discuss in the context of this discussion.”
…Well go on.
but that each association is weak. How weak? How much of the variance in ‘CCA’ does it explain? If it’s anything like these new ‘genes for’ IQ studies explaining ~4 percent of the variance, then who cares? Is a low variance something to rejoice over?
What it’s saying is that multiple parts of the brain are activated for one cognitive task, meaning the brain is interconnected, the low correlation is expected in this sense.
“I didn’t assume anything to be true just because something has yet to be proven false. I just made a statement of fact.”
Ad ignoratiam because you assume that our ignorance of roundworm neurology means we must be equally ignorant of human nuerology.
“Where did I deny the antecedent? Please use syllogistic logic.”
You assumed that a positive correlation between cortical thickness and intelligence would mean cortical thinning is negatively associated. Which isn’t the case.
“By the way, denying the antecedent is sometimes a legitamate argumentative strategy.”
Yeah sometimes, but not in this case.
“I would also add the fact that differing experiences would cause differences in brain volume/matter/thickness/etc as well.”
Yeah, I already said that in a previous comment.
I don’t know how many IQ points that is but you could figure out how many neurons that is.
“If you knew how many neurons it was then would you know exactly how many IQ points it would be?”
Maybe, I feel like it would take complicated math. Maybe pumpkin can help.
“So what is the point if it would not be completely accurate?”
Because neuroimaging is a better ruler than IQ is. I never contested this.
Well for one, when one of the correlated values is controlled for and the correlation is still robust.
That only works if there is one causal factor.
1) I’m not handwaving. 2) They’re not ‘half-truths’.
I do understand it.
“Re macaques: provide the main quote that backs your assertion. I read the paper twice.”
” How then can the nervous system be prewired to anticipate the ability to represent such an open class of behaviors? Recent developments in a branch of recurrent neural networks, referred to as reservoir computing, begins to shed light on this question. The novelty of reservoir computing is that the recurrent connections in the network are fixed, and only the connections from these neurons to the output neurons change with learning. The fixed recurrent connections provide the network with an inherent high dimensional dynamics that creates essentially all possible spatial and temporal combinations of the inputs which can then be selected, by learning, to perform the desired task. This high dimensional mixture of activity inherent to reservoirs has begun to be found in the primate cortex. Here we make direct comparisons between dynamic coding in the cortex and in reservoirs performing the same task, and contribute to the emerging evidence that cortex has significant reservoir properties.”
Derp derp derp you must of only read that first sentence twice LOL.
“See the response from Norgate and Richardson (as well as the others).”
I did, it’s garbage. DId you know the neural efficiency hypothesis coincides strongly with pfit theory?
“Are you serious? IQ tests are constructed with the assumption that human psychological traits rest on a bell curve! The book is not called “The Bell Curve” for nothing!”
IQ is a measurement aka a representation not an actual thing. Are you mentally challenged?! The tails of the distribution are fatter and there is a slight lean to the right. Of course intelligence is not a perfect normal distribution.
“No they do not. “You didn’t read the paper”, so you wouldn’t know.”
I meant your statements, not the papers. I didn’t read the paper because I’m not fucking talking about SES and IQ.
“No it doesn’t. Why do individuals differ in ‘intelligence’, this ‘mystical g’? What is the reason?? ”
Communicational efficiency of neurons.
“I’m asking you to artculate a theory of how and why individuals differ in so-called ‘g’.””
I have, multiple times.
“Ouch…”
Jesus you’re cancerous. Again, please provide relevant citations. I have presented 2017 studies.
LikeLike
Melo,
I wrote about TBI. I cited a few studies on the IQs of people before and after TBI (severe, and mild-to-severe). Even people with severe TBI don’t see dramatic decreases in IQ as you would predict:
TBI can occur with a minimal hit to IQ (Bigler, 1995; Wood and Rutterford, 2006; Crowe et al, 2012). IQs can still be in the average range at a wide range of ages/severities, however the older one is when they suffer a TBI, the more likely it is that they will incur little to no loss in IQ (depending on the severity, and even then they are still in the average range). It is interesting to note that TBI may have been a selective factor in our brain evolution over the past 3 million years from australopithecines to erectus to Neanderthals to us. However, the fact that people with severe TBI can have IQ scores in the normal range shows that the brain size/IQ correlation isn’t all it’s cracked up to be.
Traumatic Brain Injury and IQ
Even if in the traumatically damaged brain, normal brain size-IQ relations do not hold, as demonstrated previously, there may be some relation to injury severity. For example, a less severe injury should result in less structural damage. Thus, a more normal brain size-IQ relation may be observed in the less severely injured. However, this was not found to be the case. By analyzing the previously cited data by separating patients by their GCS into two groups (see Table 2), one with moderate-to-severe injury (GCS < 9) and the other with mild-to-moderate injury (GCS > 10), no difference in IQ was observed along with no significant correlations between brain size and IQ.
Brain morphology and Intelligence
See also Wood and Rutterford (2006):
Long‐term effect of head trauma on intellectual abilities: a 16‐year outcome study (Table 2 is the relevant table, replicated Bigler et al 1995.)
LikeLike
My previous calculation from the worldwide data yielded a correlation coefficient of 0.65 between my IQ estimates and GDP/capita
Virtually the same strength as the negative 0.6 correlation between skin color and real GDP per capita (see table 3).
Click to access 10.1016%40j.intell.2005.04.002.pdf
And unlike the education-GDP correlation, the skin color-GDP correlation is not circular, since GDP doesn’t affect skin color but it does affect education.
So an HBDer could apply the exact same logic as Afro but use skin color to estimate IQ instead of education, and if any country scored higher than their skin color predicts, they could dismiss the data as manipulated by politically correct academics, just like Afro claims data that doesn’t fit his simple model is manipulated by racist agendas.
LikeLike
You’re just using IQ/skin color as a counter argument and don’t actually believe that skin color causes IQ right? Remember Jensen’s (2006) thoughts on Templer and Arikawa’s (2006) paper.
Further, skin color is a proxy for exposure to infectious disease which have a higher correlation with IQ than cold winter and Kanazawa’s Savanna Hypothesis. I’ll bring sources later.
LikeLike
So an HBDer could apply the exact same logic as Afro but use skin color to estimate IQ instead of education, and if any country scored higher than their skin color predicts, they could dismiss the data as manipulated by politically correct academics, just like Afro claims data that doesn’t fit his simple model is manipulated by racist agendas.
Ironically, the skin color/GDP per capita correlation would result in values that match my ranking better than Lynn’s, especially since East Asian countries, who are darker skinned than Europe and North America have lower GDP per capita.
But any smart person understands that this correlation is not causal, that environments that select for darker skin also have higher endemic disease burden and lower agricultural productivity, which results in worse nutritional and health outcomes which in turn holds back economic development.
More importantly, the outliers are easy to explain, the black Caribbean countries that have much higher GDP per capita also have higher agricultural productivity and lower disease burden, oil-rich countries of all races have their GDP inflated by oil exports and prices and so on.
On the contrary, Lynn’s outlying values are strictly restricted to race and his sole explanation is that race causes variation in IQ although no such thing has ever been demonstrated.
Lynn’s agenda:
https://www.splcenter.org/fighting-hate/extremist-files/individual/richard-lynn
LikeLike
By the way here is Ken Richardson’s review of Lynn’s and Vanhanen’s IQ and the Wealth of Nations.
In other words, the average IQ of a population is simply an index of the size of its middle class, both of which are results of industrial development. So, an association between IQ and national wealth is hardly surprising, though its causal direction is the opposite of that assumed by L&V. But I would not take the ‘evidence’ presented in this book to serve arguments either way. Of the 185 countries in the sample, ‘direct evidence’ of the ‘national IQ’ is available for only 81! National IQs for 101 countries are simply estimated from ‘most appropriate neighbouring countries’, that is, the ‘known IQs’ (sic) of their ‘racial groups’ (p 72). But, even for most of the others, ‘direct evidence’ is putting it strongly, as even a cursory glance at the motley tests, dates, ages, unrepresentative samples, estimates, and corrections show. A test of 108 9–15-year olds in Barbados, of 50 13–16-year olds in Colombia, of 104 5–17-year olds in Ecuador, of 129 6–12-year olds in Egypt, of 48 10–14-year olds in Equatorial Guinea, and so on, and so on, all taken as measures of ‘national IQ’.
…
I will also be brief on the crude ‘genetic’ model being promoted here. In an age when we know beyond doubt that there are very few truly additive, Mendelian loci for complex traits (Glazier et al, 2002), why is it that psychologists continue to test and report additive-only models? Because the only methods available (twin and adoption studies) are incapable of testing any other model! And why are such estimates of additive gene variance so huge (80% of total IQ variance according to L&V)? Because they are riddled with methodological defects. (The poor empirical standards in this area are really quite shocking, in my view.) On the ‘racial’ categories, upon which this book is fundamentally predicated, see the Editorial in Nature Genetics (24, 97–98, 2002): ‘the concept of race is a social and cultural construction which has no scientific justification in human biology’.
This is not so much science, then, as a social crusade. The Pioneer Fund of America, champion of many dubious causes in the past, will obtain little credit from having assisted this one. The myriad corrections and estimates aside, this is a blast from another age, an old-fashioned attempt to give an imperial mindset biological validity. As Binet himself said, when he saw his test being wielded like a dipstick by Anglo-American eugenicists, ‘we must protest against this brutal pessimism’.
I wouldn’t claim that Lynn’s data is ‘racist’ (whatever that means), but it is based on hilariously small samples of young children.
LikeLike
It is racist, from the simple fact that it uses racial composition to estimate the IQs of countries where data is missing. No one would do it if they’re not claiming that race causes IQ.
Otherwise, yes the sampling methodology is very poor in countries for which Lynn claims to have actual data. His values are not replicable and instead of acknowledging the flaws and working on a better methodology to draw conclusions like any honest scholar would do, he stubbornly defends his narrative that fits his well known agenda.
LikeLike
that race causes variation in IQ has never been demonstrated?
yes. the only things that cause variation in IQ using the above sense of “cause” are a kick in the head, malnutrition, encephalitis, etc.
education doesn’t “cause” variation in IQ using “cause” in afro’s sense.
the splc isn’t an authority on anything afro. it’s a (((front))). everyone in the US knows this.
LikeLike
education doesn’t “cause” variation in IQ using “cause” in afro’s sense.
It does, it teaches test-taking and logic skills that influence one’s attitude to IQ tests.
the splc isn’t an authority on anything afro. it’s a (((front))). everyone in the US knows this.
Authority or not, they quote Lynn’s very words and report mere facts. If you read the page, you can’t point to anything that’s made up.
LikeLike
But any smart person understands that this correlation is not causal.
no. but a dumb person would say such a thing. the claim is that skin color is strongly correlated with genetic variation which is causal.
LikeLike
no. but a dumb person would say such a thing. the claim is that skin color is strongly correlated with genetic variation which is causal.
This claim is dumb.
LikeLike
hilariously small samples
you don’t know what makes a sample large or small, let alone hilariously so. IQ tests themselves are normed on no more than 2,000.
please tell us all about the sample variance and sample mean distributions. you can’t. leave the statistics to people who know pro-wrestling is fake.
LikeLike
please tell us all about the sample variance and sample mean distributions. you can’t. leave the statistics to people who know pro-wrestling is fake.
This is not a mere statistician job. Only a demographer could do the professional sampling effort that would be representative of a population.
LikeLike
I wouldn’t call it ‘racist’ to estimate country IQs with the IQ from neighboring countries, just sloppy and based just on mainly on temperature/skin color correlations.
I do agree that Lynn stubbornly defends his data and that he it is highly flawed, especially in the case of Equatorial Guinea. That’s not defendable.
LikeLike
This is racist because there are other correlates of IQ like disease, education or GDP/capita that could be used to estimate countries where data is missing. Using race instead of those variables is an ideologically motivated choice.
LikeLike
It does, it teaches test-taking and logic skills that influence one’s attitude to IQ tests.
you’re pathetic afro. you don’t even understand your own arguments let alone mine. you really are just an affirmative action lamp shade.
LikeLike
now afro is contradicting himself.
he believes genetic variation within races causes variation in IQ scores, but not between races.
please don’t quote (((lewontin))). he’s been shown to be a fraud by hsu and many others.
LikeLike
Lol!
“Hsu and many others”
Okay lol. No Lewontin’s fallacy is a myth, his point is valid.
LikeLike
But those correlates (disease/education) would, in effect, be proxies for ancestry/race anyway.
LikeLike
Not necessarily, because there is a high degree of variation among countries of the same race. No one would guess Jamaican or Barbadian data from Nigerian values or Chinese ones from Japanese one. Doing it is assuming that Jamaicans and Barbadians as well as Chinese and Japanese must have the same IQs because they belong to the same race and race is the only relevant variable in national IQ.
LikeLike
Most HBD theories are post hoc, ergo propter hoc fallacies.
LikeLiked by 1 person
True. However infectious disease can be a better proxy than race for a geographic area. Like, compared to Africa, there is a low disease burden in East Asia.
LikeLike
Yes, but if you go in more detail and look at disease burden and other quality of life variables in China, Mongolia and North Korea, IQs above 100 just do not add up.
LikeLike
This is racist because there are other correlates of IQ like disease, education or GDP/capita that could be used to estimate countries where data is missing. Using race instead of those variables is an ideologically motivated choice.
Actually when data was missing Lynn typically used the IQs of neighboring countries to estimate the country’s IQ, not race. Neighboring countries reflect not only race, but living standards and culture. Only in a minority of cases (i.e. mixed race countries) was race used and even then, he typically based the estimates on the IQs of co-ethnics in neighboring countries because he understood that members of the same race differ enormously depending on what part of the World the’re in (i.e. black in Africa average 67 but blacks in the U.S. average in the 80s; even without white admixture)
LikeLiked by 1 person
environments that select for darker skin also have higher endemic disease burden and lower agricultural productivity, which results in worse nutritional and health outcomes
Which is yet another reason why your article is so silly. By estimating IQ entirely from the effect of schooling on IQ, you ignore the enormous role of health and nutrition on brain development and IQ test performance.
Lack of schooling can not at all explain why black South Africans score below IQ 70 even before they leave school, however poor health, nutrition and disease might largely explain why black Africans scores 18 points below black Americans (even before either group drop drops out of school).
LikeLike
No he didn’t ignore these factors, because his correlation also correlate with HDI, can you into thinking pumpskinperson?
Btw, I posted some studies to you, you responded to none. I guess that you just can’t respond to them.
LikeLike
Actually when data was missing Lynn typically used the IQs of neighboring countries to estimate the country’s IQ, not race.
No, that’s why he did not estimate Haiti’s IQ based on the Dominican Republic. He gave Haiti an African score based on race.
Which is yet another reason why your article is so silly. By estimating IQ entirely from the effect of schooling on IQ, you ignore the enormous role of health and nutrition on brain development and IQ test performance.
You’re silly. Those things that affect brain development affect education just as much as they can affect IQ test performance, so years of education are still the best proxy for cognitive performance.
Lack of schooling can not at all explain why black South Africans score below IQ 70 even before they leave school, however poor health, nutrition and disease might largely explain why black Africans scores 18 points below black Americans (even before either group drop drops out of school).
You’re aware that you’re referring to apartheid-era South Africans right, an era when schooling for blacks was poor. My estimates are drawn from 2015 data, that’s more than 20 years later.
LikeLike
You’re just using IQ/skin color as a counter argument and don’t actually believe that skin color causes IQ right?
Causation is irrelevant to my point. Afro’s argument is that education correlates highly with national IQ, and predicts GDP per capita, so we should be very suspicious when a country’s reported IQ doesn’t match its education level.
Well skin color correlates even better with national IQ than education does, and predicts GDP per capita about as well as education does, so by Afro’s own logic, we should be suspicious when a country’s IQ doesn’t match its skin color.
Of course Afro will say that the education correlation is causal and the skin color correlation is just a byproduct of tropical disease, but that’s just an assumption. No one has proved that tropical disease entirely explains the correlation between skin color and IQ; at best they’ve found it correlates better with national IQ than skin color does, but that’s to be expected because disease is both a product (i.e. sanitation skills) and a cause of IQ , while race is at best just a cause.
Further no one has proven that education is the only cause of national IQ differences and indeed this is debunked by the fact that samples from low IQ countries score very low even when everyone is still in school.
LikeLike
so we should be very suspicious when a country’s reported IQ doesn’t match its education level.
No, we should only be suspicious when mismatch only follows a specific racial pattern and that race is claimed to be the reason for this mismatch.
Because, if one claims (as Lynn does) that IQ is the cause of differences in GDP, HDI, and education, then you need to explain why so many black countries have much better outcomes than expected from Lynn-estimated countries and why Mongolia, China or North Korea do so poorly.
Outliers are not a problem unless you can account for the difference with variables whose role in IQ satisfyingly demonstrated.
LikeLike
No one has proved that tropical disease entirely explains the correlation between skin color and IQ
It’s been proven that tropical disease depresses IQ, it hasn’t been proven that skin color does. So when a stronger correlation whose causal role is well established has about the same global distribution as skin color or yam consumption, you conclude that that those latter variables are coincidental.
at best they’ve found it correlates better with national IQ than skin color does, but that’s to be expected because disease is both a product (i.e. sanitation skills) and a cause of IQ , while race is at best just a cause.
Lower correlations are logically expected to be a byproduct of stronger correlations.
Further no one has proven that education is the only cause of national IQ differences and indeed this is debunked by the fact that samples from low IQ countries score very low even when everyone is still in school.
Various HBD scholars have claimed reverse causality, that IQ causes variation in education and that it is the most important cause. Whatever the causal direction, you’re still facing the same mismatches that need to be explained.
IQ differences while still in school do not debunk the causal role of education. Lower IQ samples will simply have a lower school life expectancy, because they learn little and drop out early. These samples are just snapshots that lack the quality of longitudinal measurements.
LikeLike
You’re silly. Those things that affect brain development affect education just as much as they can affect IQ test performance, so years of education are still the best proxy for cognitive performance.
Your own matrix shows national IQs correlate 0.79 with national education. By contrast national skin color correlates 0.91 with national IQ:
Click to access 10.1016%40j.intell.2005.04.002.pdf
So skin color is a better proxy for IQ at the national level than education is. As an HBD denier you might argue that the education correlation is more causal, but now that you’ve implied the cause of the IQ-education correlation is disease stunting both IQ and education, rather than low education stunting IQ, that argument no longer makes sense, nor do your IQ calculations, which were based on the effect of schooling on IQ, not the effect of disease on both.
What a mess.
You’re aware that you’re referring to apartheid-era South Africans right, an era when schooling for blacks was poor. My estimates are drawn from 2015 data, that’s more than 20 years later.
Then why the hell are using 2015 IQ estimates to debunk Lynn’s 20th century IQ data?
Your article is a HOT MESS!
LikeLike
Your own matrix shows national IQs correlate 0.79 with national education. By contrast national skin color correlates 0.91 with national IQ:
National IQ as measured by Lynn, which proves nothing.
So skin color is a better proxy for IQ at the national level than education is. As an HBD denier you might argue that the education correlation is more causal, but now that you’ve implied the cause of the IQ-education correlation is disease stunting both IQ and education, rather than low education stunting IQ, that argument no longer makes sense, nor do your IQ calculations, which were based on the effect of schooling on IQ, not the effect of disease on both.
If you had read my article, you’d have noticed this part:
What a mess.
Lol!
Then why the hell are using 2015 IQ estimates to debunk Lynn’s 20th century IQ data?
Because I haven’t read Lynn or any HBDer warning that those values were not valid anymore as of 2015.
Your article is a HOT MESS!
Keep calm peepee and read that post I wrote for you on the history of Africa.
LikeLike
It’s been proven that tropical disease depresses IQ,
Show me the proof.
it hasn’t been proven that skin color does
The single best study on race and IQ (the Minnesota trans-racial adoption study) found that being black depressed IQ by about 15 points, and being half black depressed IQ by about 7 points, even when the kids were raised in a white upper class home, and in the case of half-blacks, born in a white womb.
And while the study has admittedly not been replicated, and could not control for all confounds, I have yet to see a single controlled study so precisely quantifying the effect of disease load on IQ. If they exist I’m happy to read them.
LikeLike
Show me the proof.
Click to access 00b7d53a2c6e161af0000000.pdf
Click to access Parasite-Prevalence-and-the-Worldwide-Distribution-of-Cognitive-Ability.pdf
The minnesota study, as well as other adoption studies have their flaws discussed and corrected here:
http://www.mdpi.com/2079-3200/5/1/1/htm
LikeLike
No, we should only be suspicious when mismatch only follows a specific racial pattern and that race is claimed to be the reason for this mismatch.
Maybe if you looked at the specific studies Lynn was citing, and the education level and nutrition level AT THE TIME WHEN THE STUDY WAS DONE, his numbers would make more sense.
LikeLike
Maybe if you looked at the specific studies Lynn was citing, and the education level and nutrition level AT THE TIME WHEN THE STUDY WAS DONE, his numbers would make more sense.
Keep it together peepee, it’s not my job to do it. It’s Lynn’s job to list all the possible confounding variables before jumping to the conclusion that race explains the differences in IQ and then writing whole books and giving conferences about it.
LikeLike
National IQ as measured by Lynn, which proves nothing.
They’re the only direct measurements we’ve got.
If you had read my article, you’d have noticed this part:
Glad you admitted the correlation was not causal
Because I haven’t read Lynn or any HBDer warning that those values were not valid anymore as of 2015.
There was also no warning not to eat the book. Some thing are understood
LikeLike
They’re the only direct measurements we’ve got.
No, not really, other researchers have come up with different results by applying a systematic sample selection method. Lynn’s values are unreplicable and most are not even direct measurments.
Glad you admitted the correlation was not causal
Educational attainment is caused by many factors and is the best predictor of IQ that one can find. Regardless of pupil characteristics, keeping them in school and learning longer is supposed to increase their IQ as it happened in Norway without simultaneous nutritional or health changes.
There was also no warning not to eat the book. Some thing are understood
No, specifying the date of an estimate is one basic procedure in demographic statistics. But Lynn couldn’t do it since he aggregates studies from different decades or estimates IQ without having national samples at all.
LikeLike
You should stop pumpskinperson, it’s humiating for you. Lynn’s data is disproved, not valid anymore.
You’ve nothing credible anymore to hold your position AS A FACT beside a theory, your dogmatism should be over.
LikeLike
Theories explain observations. Just because something is “only a theory” doesn’t disprove it. If that were the case, then the theory of evolution would be in huge trouble.
LikeLike
Keep it together peepee,
You’re the one resorting to childish name calling (“peepee”), not me. I merely used capital letters because I’m too lazy to use italics.
it’s not my job to do it.
It’s not your job to do any of this, but if you’re genuinely interested in getting to the truth, reading the studies Lynn cites would be a good start.
LikeLike
You’re the one resorting to childish name calling (“peepee”), not me.
And what else do you think your desperate attitude deserves? Feel lucky you’re not censored on this blog like I am on yours.
I merely used capital letters because I’m too lazy to use italics.
Sure, you’re just triggered.
It’s not your job to do any of this, but if you’re genuinely interested in getting to the truth, reading the studies Lynn cites would be a good start.
Please, I’ve done it more than you, we all know what type of samples he mostly uses in Africa: sick, disabled, undernourished or illiterate people, or apartheid school children. Lol. I know the truth, you are the one who shields himself from it and ignoring the simple fact that Lynn treats all these samples as normal and representative.
LikeLike
The minnesota study, as well as other adoption studies have their flaws discussed and corrected here
At least the Minnesota study had a quasi-experimental design. The studies you cite on disease load are merely correlational.
LikeLike
At least the Minnesota study had a quasi-experimental design. The studies you cite on disease load are merely correlational.
The Minnesota study has no info on the biological IQ of the parents, so no genetic inference can be made. So that’s far from quasi-experimental and that’s not a replicated study.
This study clearly explains the process by which malaria impairs brain function:
http://www.ajtmh.org/docserver/fulltext/14761645/64/1_suppl/tmed_64-01-0068.pdf?expires=1506988122&id=id&accname=guest&checksum=5690FFBF39A58AC1599297B947060165
LikeLike
No, not really, other researchers have come up with different results by applying a systematic sample selection method.
Only for sub-Saharan Africa. I know of no other worldwide data base on directly measured national IQs, other than Lynn’s.
Lynn’s values are unreplicable and most are not even direct measurments.
Except in the cases of estimates which he clearly states are estimates, they are directly measured
Educational attainment is caused by many factors and is the best predictor of IQ that one can find.
You have no way of knowing if it’s a good predictor at the national level, because you reject the only international IQ data base we have (lynn’s); within countries it’s hardly better than predicting height from weight as I documented above. The point is anomalies and mismatches are to be expected and accusing Lynn of racism every time you find a mismatch does not advance the debate, especially when you haven’t even read his sources.
No, specifying the date of an estimate is one basic procedure in demographic statistics.
Not in this type of research. For example one of the most famous data bases in anthropology is the Smith and Beals database on 20,000 crania from all over the World, that is constantly cited in population research, and those crania form ethnic aggregates from many different decades.
LikeLike
Only for sub-Saharan Africa. I know of no other worldwide data base on directly measured national IQs, other than Lynn’s.
Rindermann has done it in South-East Asia, Malloy has done it in South-East Asia and the Caribbean, they both had vastly different estimates from Lynn’s.
Except in the cases of estimates which he clearly states are estimates, they are directly measured
That doesn’t make them nationally representative. Especially when he aggregates data from different decades.
You have no way of knowing if it’s a good predictor at the national level, because you reject the only international IQ data base we have (lynn’s); within countries it’s hardly better than predicting height from weight as I documented above. The point is anomalies and mismatches are to be expected and accusing Lynn of racism every time you find a mismatch does not advance the debate, especially when you haven’t even read his sources.
My estimates have a correlation of 0.79 with Lynn’s, which makes them a good predictor of Lynn’s IQ. The major difference is that my estimates correlate more strongly with development variables and do not result in outliers that owe their scores to their racial composition.
Not in this type of research. For example one of the most famous data bases in anthropology is the Smith and Beals database on 20,000 crania from all over the World, that is constantly cited in population research, and those crania form ethnic aggregates from many different decades.
LOL! that 1984 study only has 326 citations. No one would calculate height, weight or any other variables this way.
This is trash research, nothing that meets scientific standards.
LikeLike
Theories explain observations. Just because something is “only a theory” doesn’t disprove it.
Thanks RR!
LikeLike
No problem. That’s one of my biggest pet peeves. “X is “only a theory”, therfore Y is false.” Nothing irks me more, science wise, then to hear that.
LikeLike
The Minnesota study has no info on the biological IQ of the parents, so no genetic inference can be made. So that’s far from quasi-experimental and that’s not a replicated study.
They know the education levels of the biological mothers and you seem to think that’s a good proxy for IQ. And is there any reason to suspect black and mixed race couples who give their kids for adoption are more below their racial average than whites who give their kids for adoption?
This study clearly explains the process by which malaria impairs brain function
I don’t doubt it, but claiming disease entirely explains the skin color IQ correlation is such an extreme claim that you need a study that can precisely quantify the effect size
LikeLike
They know the education levels of the biological mothers and you seem to think that’s a good proxy for IQ.
Paternal IQ matters too if you claim it’s genetic.
Anyway, the decreased IQ is just a statistical artifact as the study I linked to demonstrates. So no, the adopted children did not regress to a biological potential.
And is there any reason to suspect black and mixed race couples who give their kids for adoption are more below their racial average than whites who give their kids for adoption?
Of course, the wish of every parent is to raise their children, only socio-economic hardships lead to give up children to adoption and these hardships are said to correlate with IQ.
I don’t doubt it, but claiming disease entirely explains the skin color IQ correlation is such an extreme claim that you need a study that can precisely quantify the effect size
No, you just need common sense, both variables virtually have the same geographic distribution, but one (disease burden) correlates more strongly to IQ, so the second (skin color) whose causal role in IQ has not been demonstrated is coincidental, as would be yam consumption.
LikeLike
I never stated that a theory is wrong, just that pumpskinperson is pretty dogmatic on something not fully proven.
LikeLike
I never stated that a theory is wrong, just that pumpskinperson is pretty dogmatic on something not fully proven.
Exactly. Not proven at all actually.
LikeLike
“Theories explain observations. Just because something is “only a theory” doesn’t disprove it. If that were the case, then the theory of evolution would be in huge trouble.”
I literally never stated that kind of thing! There is difference between discussing about a theory and being dogmatic about it.
Please RR do not misinterrpret me like that.
LikeLike
Of course, the wish of every parent is to raise their children, only socio-economic hardships lead to give up children to adoption and these hardships are said to correlate with IQ.
But that doesn’t explain why the white adopted kids scored about 7 points higher than the mixed race adopted kids who scored about 7 points higher than the black adopted kids. All three had biological parents who gave them up for adoption; the only difference was race.
No, you just need common sense, both variables virtually have the same geographic distribution, but one (disease burden) correlates more strongly to IQ, so the second (skin color) whose causal role in IQ has not been demonstrated is coincidental, as would be yam consumption.
I thought you said correlations with Lynn’s IQ data proved nothing, but when the correlation supports your case, you cite them.
And yet you seem to be mistaken. According to the 2010 paper Parasite prevalence and the worldwide distribution of cognitive ability by Christopher Eppig et al, parasite load correlates -0.82 with national IQ which is weaker than the -0.92 correlation between average skin darkness and national IQ ( Templer & Arikawa, 2006).
However you’re correct that in Eppig et al’s study, parasite load correlated better with IQ than winter temperature (a weaker measure of ancestral climate than skin color), however they still found that winter temperature predicted some of the IQ variance independently of parasite load and all other variables in the study.
You know what didn’t have independent predictive power in their study? Education.
So yes, parasite load explains the lion’s share of the variance in national IQ differences, but not all of it. The authors concluded that when all other variables are held constant infectious disease is the best predictor of intelligence by a large margin. The effects of years of education are not significant, while temperature and evolutionary novelty seem to have distinct predictive power beyond infectious disease.
Of course Lynn already knew disease/nutrition mattered greatly when discussing international IQ differences. He even estimated that black Africans would score over a dozen points higher if reared in the U.S.
LikeLike
But that doesn’t explain why the white adopted kids scored about 7 points higher than the mixed race adopted kids who scored about 7 points higher than the black adopted kids. All three had biological parents who gave them up for adoption; the only difference was race.
It wasn’t, age at adoption, pre-adoptive placements, education and income of adoptive parents greatly differed by race.
So, no, this Minnesota study, even before the statistical corrections doesn’t make your point at all.
I thought you said correlations with Lynn’s IQ data proved nothing, but when the correlation supports your case, you cite them.
Correlations with Lynn’s data prove nothing, but when they’re consistent with other professionally measured socio-economic outcomes they can be taken seriously. I’m especially speaking of the correlations with GDP/Capita, in which case the skin color correlation is coincidental to the disease burden one.
However you’re correct that in Eppig et al’s study, parasite load correlated better with IQ than winter temperature (a weaker measure of ancestral climate than skin color), however they still found that winter temperature predicted some of the IQ variance independently of parasite load and all other variables in the study.
Parasites aren’t the only pathogenes whose spread is limited by cold winters, and pathogenes are not the only influence on IQ. It’s no secret that northern countries (as well as Australia, New Zealand, Argentina, Chile and Uruguay) are more developed that tropical ones, so temperature is confounded by many other development variables, like nutrition.
I’m quite suspicious of their measure of skin color from a 1967 study. Skin color is not exactly an adaptation to temperature but to UV radiation instead, so skin color isn’t a cold winter theory argument, many dark populations live in and are adapted to cool/cold regions like Ethiopia, Tibet, the Arctic, Southern Africa, the Andes… Even the West and Central African rainforest is somewhat cooler than the East African Savanna. So skin color is not the measure of ancestral temperature that they pretend it is.
You know what didn’t have independent predictive power in their study? Education.
Because education can’t be an independent variable like temperature or parasites, education doesn’t bite you like a mosquito nor pours on you like the rain.
The effects of years of education are not significant, while temperature and evolutionary novelty seem to have distinct predictive power beyond infectious disease.
Evolutionary novelty is void of any scientific sense. Cities are “evolutionary novel” for instance, do they account for them?
Of course Lynn already knew disease/nutrition mattered greatly when discussing international IQ differences. He even estimated that black Africans would score over a dozen points higher if reared in the U.S.
Where in the US? Inner cities? Suburbs? Rural Areas? Mississippi? Massachusetts?
LikeLike
Evolutionary novelty, re distance from the Savanna (Kanazawa’s hypothesis) was disproven in that study by Eppig et al. They also noted that Wicherts et al (2010) falsified the Savanna hypothesis as well.
You also have to remember that certain evolutionarily novel environments would have fewer parasites due to a certain ecosystem (parasite load being lower in northern latitudes, for instance).
LikeLike
Why do you say that, RR? They write:
while temperature and evolutionary novelty seem to have distinct predictive power beyond infectious disease.
In other words even after controlling for disease, both evolutionary novelty and winter temperature both independently predict a nation’s IQ.
That’s pretty amazing because evolutionary novelty and cold winters must be so highly correlated, that it’s amazing that each one has independent predictive power
LikeLike
You also have to remember that certain evolutionarily novel environments would have fewer parasites due to a certain ecosystem (parasite load being lower in northern latitudes, for instance).
But they found evolutionary novelty predicted national IQ independently of parasite load, and so did cold climates.
LikeLike
yes afro. lewontin is a fraud. this is why it is possible to identify someone’s race from his genome with 100% accuracy. there is structure to a set of genomes in addition to its allele frequencies, a correlational structure.
but this is math. i know in france the education is very specialized, so you’ve probably only learned up to third grade math in the US. peepee had to tell you what a correlation was. sad!
LikeLike
the very fact that 100% of the evidence is consistent with the dumb negro theory is damning. afro can argue that the evidence is not dispositive. but the fact that there is to date zero evidence which disproves the dumb negro theory…afro can’t grasp the importance of this. it’s too “meta” for him. sad!
show me bahamian blacks score higher than croatian whites and your case looks better. show me moldovans score lower than ghanaians.
why are all of the facts, all, evidence for the prosecution afro?
the defense has zero evidence. all it has is questioning the relevance of the prosecution’s evidence.
afro is mounting what is called “the oj defense”.
Johnnie Cochran: You see, the prosecution, they’re desperate! Yeah, they’re grabbing at anything! They keep telling everyone – Ms. Clark, the press – that the defense has been playing the “race” card! The “race” card! But what you don’t hear – and I can’t believe the press hasn’t mentioned this – that, all the while, the prosecution has been playing the “evidence” card. Yeah! Oh, yeah! Day in, day out! “Your Honor, we have this ‘evidence’ that we’d like to present!” “We have a witness who will clearly explain this ‘evidence’!” You follow the pattern? Evidence here, evidence there, evidence eveywhere! But that’s not what this case is about!
LikeLike
To Ron Burgundy:
“show me bahamian blacks score higher than croatian whites and your case looks better.”
I don’t know about Croatian whites scoring lower, but; the average measured IQ in Croatia is about 90.
https://iq-research.info/en/page/average-iq-by-country/hr-croatia
And the average iq in the Bahamas is 93.
The Bahamas is 90% black (the other non-black 10% of the population being/containing a mix of whites, mulattos, and South Asians/East Indians). Assuming the aforementioned remaining 10% of non-black Bahamians has an average iq of 100, the black majority would have to be at least about 90-1 in iq—and it’s not even entirely certain that the non-black fraction scores higher at all—(but since the mix of groups making up the non-black 10% likely has an iq a bit/somewhat lower than 100, the black fraction’s iq likely is more like 91-92).
So Bahamian blacks and Croatian whites appear to score about the same (or the former possibly a little higher).
LikeLike
HDI would be a better matching variable since it reflects living conditions better than GDP/Capita.
Croatia has a higher HDI than all these high income Caribbean countries, Moldova a higher HDI than Ghana. Moldova is an ex-Soviet republic with much better health and education infrastructure inherited from the USSR and no tropical disease. It’s economy shrank due to transition to capitalism and loss of Russian support.
Anyway, those black Caribbean countries compare favorably to Croatia in education and IQ despite lower HDI.
Trinidad and Tobago has better PISA scores than more comparable countries like much whiter Argentina and Brazil.
Mugabe can’t think. Sad!
LikeLike
should be: “black majority would have to be at least about 90-91”
Also, it is notable that Malaria is much lower (almost non-existant, though it was higher in earlier times) in the Bahamas, (and education widespread) both also being true of Bermuda, see link below—(though some other diseases that possibly could have depressive effects on iq—though perhaps to a lesser extent—still exist to some degree in the Bahamas).
LikeLike
Edit: “I don’t know about Croatian whites scoring lower (possibly slightly lower, or they might score about the same), but…”
LikeLike
Jm8, you’re comparing IQs reported by Lynn to IQs reported by a blogger. You have to use the same source for both countries.
Lynn’s 2006 estimates say 90 for Croatia and 84 for Bahamas:
LikeLike
Iirc, I say 94 for Croatia and 89 for the Bahamas. Controlling for HDI, thr Bahamas must score higher, so should do Barbados and St. Vincent.
LikeLike
afro continues the oj defense.
just more ad hoc and contradictory excuses or outright lies.
he claims poverty explains black failure, but doesn’t explain why poorer whites score higher in croatia and moldova. and no source for his claim that the bahamas scores higher on IQ tests.
and ignorance or lies regarding argentina.
I. argentina scored higher than T&T on the pisa. it scored the same as croatia. for lazy korinthenkackers who need a link: https://www.oecd.org/pisa/pisa-2015-results-in-focus.pdf
II. the average argentine is 15% native american. i guess afro thinks costa rica is white too. sad!
III. a plurality of T&Ters are east indian.
i also forgot to mention that when US pisa scores are broken down by race the same pattern is seen. asians ahead of whites ahead of mestizos ahead of blacks. it’s a festivus miracle.
one must appreciate the dementia he’s dealing with when he deals with afro. in france it is a crime to say that jerry lewis isn’t funny. http://www.unz.com/article/living-under-the-french-hate-speech-laws/
LikeLike
Argentina’s PISA score is just for the city of Buenos Aires actually. Anyway, as Jm8 says, T&T scores higher than many caucasoid countries.
LikeLike
Reminder that PISA is not a proxy for ‘IQ’, contrary to what hereditarians say.
LikeLike
True, the ranking comes from a huge report that highlights many factors.
LikeLike
To PumpkinPerson
Jm8, you’re comparing IQs reported by Lynn to IQs reported by a blogger. You have to use the same source for both countries.
Lynn’s 2006 estimates say 90 for Croatia and 84 for Bahamas:”
The data reported (by Jason Malloy in his blog is based on the data that exists for the Bahamas. Lynn’s figure (used by him for the Bahamas) was not based on any actual Bahamian data.
“IQ and the Wealth of Nations (2002) does not have a study for The Bahamas, but estimates an IQ of 78 by using the score from Barbados (p. 74). IQ and Global Inequality (2006) estimates an IQ of 84 by averaging the scores from Cuba and the Dominican Republic (p. 55), and this is the estimate still reported in the most recent book (Lynn & Vanhanen, 2012, p. 20).”
I am not sure what sources he uses for Croatia (I suppose it is possible that his figure for that country is not well supported either—I will have to look for more sources on Croatia), but the figures for the Balkan countries seem to generally be within that range (the low-mid 90s).
LikeLike
It wasn’t, age at adoption, pre-adoptive placements, education and income of adoptive parents greatly differed by race.
There were such differences between the adopted black kids and the adopted white kids, but that doesn’t explain the 6-9 point gap between the adopted whites and the adopted mixed race kids.
https://en.wikipedia.org/wiki/Minnesota_Transracial_Adoption_Study
Parasites aren’t the only pathogenes whose spread is limited by cold winters, and pathogenes are not the only influence on IQ. It’s no secret that northern countries (as well as Australia, New Zealand, Argentina, Chile and Uruguay) are more developed that tropical ones, so temperature is confounded by many other development variables, like nutrition.
All these variables are intercorrelated so the more you control for, the less independent effect they will have. Lynn considers disease a subset of nutrition because disease prevents the body from using nutrients.
Because education can’t be an independent variable like temperature or parasites, education doesn’t bite you like a mosquito nor pours on you like the rain.
That’s not what independent effect means. It means the correlation doesn’t vanish when other variables are controlled. If Lynn’s data was derived from adult samples (who actually differ in completed schooling) instead of school kids, education would have an independent effect because years of schooling really does increase performance on IQ tests (though I doubt it actually increases intelligence)
LikeLike
But I suspect Jason Malloy would also report a higher figure for Croatia than Lynn did
LikeLike
http://www.mdpi.com/2079-3200/5/1/1/htm
Pumpskinperson, this meta-analysis talk about multiple groups with different admixture too.
Did you really read this link?
LikeLike
To AfroSapiens:
“I say 94 for Croatia and 89 for the Bahamas.”
The data shows a Bahamas score bit higher than that (around 91-93). Approximately 94 for Croatia may be right.
LikeLike
My margin of error is about +- Points. Maybe 10 points under exveptional circumstances, but mismatches like China’s 22 points are just impossible.
LikeLike
“The data shows a Bahamas score bit higher than that (around 93)”
LikeLike
And the average iq in the Bahamas is 93.
I believe Jason reports IQs in U.S. norms, meaning an IQ of 100 = U.S. mean.
By contrast Lynn uses a scale where IQ 100 = U.S. white mean
Lynn converts U.S. norms to white norms by subtracting 2 points from U.S. norms (which is a bit simplistic) which reduces Bahamas to 91.
Next you have to adjust for the fact that 15% of the Bahamas was non-black, so the black majority would likely average 89.
LikeLike
To PumpkinPerson
“Next you have to adjust for the fact that 15% of the Bahamas was non-black, so the black majority would likely average 89.”
the Bahamas is about 10% non-black (see my comments below). The 10% is about 5% whites, 2% mixed descent black/whites, and smaller numbers of others (including East Indians)
LikeLike
“…(see my comments below the Bahamas entry/source). The census reports ca. 10%. the “
LikeLike
Your source (Malloy) said:
The population, not much larger than 350,000, is 85% black, 12% white, and 3% Asian and Latin American.
He didn’t provide a source though.
Wikipedia agrees with you though, but they don’t provide a source either.
Of course the demographics may have changed. Most of the IQ studies Malloy cites are from the late 20th century.
LikeLike
To Ron Burgundy:
“I. argentina scored higher than T&T on the pisa. it scored the same as croatia. for lazy korinthenkackers who need a link: https://www.oecd.org/pisa/pisa-2015-results-in-focus.pdf
…III. a plurality of T&Ters are east indian.”
T&T still scores in the range of Turkey and Albania (significantly Above Macedonia/FYROM, and above several South East European, Latin American and Middle Eastern countries—Lebanon, Kosovo, Mexico, Costa Rica (and above a few S.E. Asian ones like Thailand and Indonesia).
T&T is about 36% black and 37% East Indian (the major groups), and 24% mixed race.
https://en.wikipedia.org/wiki/Demographics_of_Trinidad_and_Tobago#Ethnic_groups
LikeLike
I confess i was not that certain on my PISA scores. Anyhow, one love, one blood peace brothers. See you.
LikeLike
To PP:
Your source (Malloy) said:
The population, not much larger than 350,000, is 85% black, 12% white, and 3% Asian and Latin American.
He didn’t provide a source though.”
I provided a source in the comments, the 2010 Bahamas census.
Click to access CENSUS2010084903300.pdf
It has Blacks at about 318,000 (of total 351,000) which is about 90.5%, whites at ca. 16,000 (roughly 5 %), mixed race black/whites ca. 7,000 (about 2%), mixed black/other ca. 2,000, Asian and Indian roughly 3,000.
“black 90.6%, white 4.7%, black and white 2.1%, other 1.9%, unspecified 0.7% (2010 est.)”
“African (90.6%), or mixed African with other races (2.7%). 4.7% of the population is European, 0.4% Asian and 0.2% East Indian.”
http://www.indexmundi.com/the_bahamas/demographics_profile.html“
LikeLike
“T&T is about 36% black and 37% East Indian (the major groups), and 24% mixed race (the last group likely often a racial mix of black and East Indian, or “dougla” as they call those people in Trinidad).
LikeLiked by 1 person
Yeah and they have a couple of what we’d call hispanic as well.
LikeLike
PP,
Sorry, I conflated Kanazawa’s Savanna Hypothesis (which does include evolutionary novelty) with just plain old evolutionary novelty.
Eppig et al “seriously question the ability of linear distance from sub-Saharan Africa to measure evolutionary novelty, undermining the foundation of Kanazawa’s hypothesis.” I misremembered there.
I will concede being wrong there, however, infectious disease still does explain the variance better than all other measures tested; northern latitudes don’t have parasite/disease prevalence and, therefore, are shielded from whatever physiologic effects that occur from parasite/disease burden.
LikeLike
“Yeah and they have a couple of what we’d call hispanic as well.”
True. (its a very small group but) Many of them would likely fall into the mixed race fraction and some might have black ancestry, and/or have some native Amerindian ancestry, especially small community around the small region of Arima where some people are of culturally Hispanized Carib descent—and still have a style of folk music in Spanish called parang—(Hispanized and converted to Catholicism by Spanish missionaries during the Spanish colonial period)—both descended from local Island Caribs and from those that came later from nearby Venezuela). Most of the black population though seems to have come as slaves in the British and French periods, or from other British and French Caribbean Islands.
LikeLike
So Bahamian blacks and Croatian whites appear to score about the same (or the former possibly a little higher).
if true this is evidence for the defense. afro should find more such facts.
it’s not enough to attack the prosecution’s evidence when there’s a mountain of it or claim the the cops framed the black man because racism.
i’ve written the SPLC about afro. he will now be on their list next to andrew anglin.
LikeLike
“I believe Jason reports IQs in U.S. norms, meaning an IQ of 100 = U.S. mean.
By contrast Lynn uses a scale where IQ 100 = U.S. white mean”
Do you have a source (at least for the norm Lynn uses)? I will try to look for one myself.
LikeLike
Lynn uses British norms which remove 2 points relative to US ones.
LikeLike
Right. The “Greenwich norms”.
LikeLike
if it were really the case that black bahamians scored the same as croatians this would be very interesting. croatia is a poorer country than the bahamas, yet has a higher HDI as afro has said. would it be an alibi?
but then if bahamians were given the pisa and scored the same as T&Ters and thus lower than croatians would the education causes IQ theory be disconfirmed?…maybe…the differences may be too small to mean anything.
of course the SD is important too. not just the mean. the high achievers in natsci are all european, jewish, indian, or chinese with a few arabs. no blacks. no native americans. no abos. no polynesians. not one. that seems odd. it must be racism.
here’s a list of african nobel laureates. https://en.wikipedia.org/wiki/List_of_African_Nobel_laureates
zewail is an arab. cohen-tannoudji is a jew.
4 white gentiles have won nobels in natsci. all from ZA.
LikeLike
PP,
1) This assertion is an appeal to authority. 2) Jason Malloy has published in the journal Medical Hypotheses:
James Watson tells the inconvenient truth: Faces the consequences
You’re “a blogger” too, should we disregard what you say that’s been rebutted by actual social scientists?
LikeLike
Moreover, Lynn has no more authority on picking samples than anyone else that is not a demographer.
LikeLike
Right RR, I was thinking that PP used appeal to authority with Medical Hypotheses, just wanted to add that he used that with a journal which actually have problems:
Aids denialism saga:
http://onlinelibrary.wiley.com/doi/10.1111/j.1467-9566.2010.01312.x/abstract;jsessionid=96E71D3ABF717CC5CAAC15D94867D661.f04t04
Problems with their team.
http://medicalhypotheses.blogspot.fr/2010/05/rip-medical-hypotheses.html
LikeLike
Thanks for the citation. I’m interested in any logical, factual theories/arguments, no matter how kooky they may be. As long as good, strong logic is used and it’s backed by facts and not emotions.
Concerns were raised about the implications for academic freedom of this boundary work in defence of peer review as a core practice in science. The paper concludes, however, that Duesberg’s freedom to write what he likes remains intact, but that if he wants his work to carry the imprimatur of science, he now has to subject it to peer review.
I agree with this.
LikeLike
Medical Hypothesis is not even a serious journal.
They published papers in support of aids denialism…etc
LikeLike
Okay… lol.
LikeLike
Got a source for that? I’d like to read the paper.
PP’s assertion is still an appeal to authority, whether or not the journal he published in is kooky or not. It’s worth noting that neuroscientist/philosopher John Skoyles has published in that journal as well.
Human balance, the evolution of bipedalism and dysequilibrium syndrome
Is autism due to cerebral–cerebellum disconnection?
It seems that, as the journal’s name indicates, the journal publishes medical hypotheses. So the fact that it supported AIDS/HIV denialism is irrelevant.
LikeLike
so now afro claims only a professor of demography can choose a representative sample. pathetic. korinthenkacker extraordinaire. sad! if one has a list of all 12 year olds or whatever all he need do is pick a random bunch and the sample is representative the sample mean for a population, irrespective of the variable’s distribution converges to a normal distribution with SD = (1/sqrt(N))population SD. so 100 chillens is enough to get the mean to +/- 3 points with 98% probability assuming the population SD is 15 points. 15/sqrt(100) = 1.5. sample mean +/- 21.5 = 3.
afro, what is the punishment for saying that jerry lewis was never funny? if i sent an email to someone in france saying how unfunny jerry lewis was would france ask for my extradition from the US to stand trial for hate speech against a commander of the legion of honor?
LikeLike
http://austinresearch.co.uk/the-importance-of-representative-samples-and-how-to-get-them/
https://en.wikipedia.org/wiki/Sampling_(statistics)
LikeLike
wtf is wrong with you RR?
the whole point of afro’s article is that education is a proxy for IQ.
and IQ is itself a proxy for fuck’s sake.
there are test scores. some of these tests call themselves IQ tests. some don’t. the difference is just marketing. how autistic do you have to be not to know this?
IQ is NOT a thing.
besides this is just more OJ defense.
afro has yet to produce an alibi. he has yet to produce any evidence which is inconsistent with the dumb negro theory.
all he can do is claim that each grain of sand in the mountain of prosecution evidence is fake and that the cops are racists. how about that mr fung!
i’m a better defense lawyer than he is. sad!
LikeLike
skin color is correlated with the physical geography of one’s ancestors. it is not dumb to suppose that what is similar in those geographies where darker skin arose also caused stupid to arise. for example, black people.
LikeLike
Of course it is dumb when we know there are stronger confounding correlates whose effect on IQ is much better demonstrated.
LikeLike
yes afro. poverty, malnutrition, illiteracy, etc. make IQ scores from the developing world meaningless. and yes lynn is retarded.
but these confounds don’t exist when these darker skinned peoples live in western europe or the US or australia etc. and they are not elites from their home countries.
LikeLike
but these confounds don’t exist when these darker skinned peoples live in western europe or the US or australia etc. and they are not elites from their home countries.
And the IQ scores aren’t the same either. These confounds still do exist though, there are large differences in quality of life within countries. African American men have the life expectancy of Bangladeshi men for instance, so the things that cause them to live this short can possibly depress their IQs.
Disease burden explains differences in IQ within the US.
Click to access 10.1016%40j.intell.2011.02.008.pdf
LikeLike
yes obviously afro. but poor whites score higher than middle class blacks in the US. must be racism.
and ideal comparison would be a fairly rich caribbean island country which is almost all black, so racism can’t be an excuse, with a slightly poorer white country. do bahamians score as high on IQ tests as croatians? if not why not? IMF (2016) GDP (PPP): bahamas 24,555, croatia 22,795. or do ghanaians score the same as moldovans? if not why not?
LikeLike
and ideal comparison would be a fairly rich caribbean island country which is almost all black, so racism can’t be an excuse, with a slightly poorer white country. do bahamians score as high on IQ tests as croatians? if not why not? IMF (2016) GDP (PPP): bahamas 24,555, croatia 22,795. or do ghanaians score the same as moldovans? if not why not?
Matching for GDP is not the same as matching for personal income, you need to account for income inequality, cost of life, GDP sectoral composition (Gulf Emirates have sky high GDP/capita for instance) and other variables.
LikeLike
if you could collect several examples where the blacks scored higher, then this would prove your case. but if you can’t, then you can still make excuses.
the parasite load vs state IQ is the same as latitude vs state IQ. the racial composition varies with latitude in the US. the SE is a third black. the sw is a third latino.
am i the only one who finds afro’s causal racism offensive? he should be arrested for hate speech.
LikeLike
…an ideal comparison…
LikeLike
Middle class blacks still have more problems than poor white, read Afro’s article on Poverty and his comment section.
LikeLike
i understand that afro. the best figure would be median household income, but its far harder to come by. it would also be important that years of schooling doesn’t differ much between the bahamas and croatia. you’d also have to exclude the 10% of bahamians who are white.
what’s so absurd and hateful about afro:
first. he thinks blacks aren’t responsible for their plight but poor whites are. he calls them “white trashes”. he’s also for eternal wage stagnation and greater and greater income and wealth inequality in order to avoid inflation.
second. afro claims he has had everything these same poor whites have not had. he cannot possibly understand why any intelligent person would vote FN. his elite education makes some thoughts unthinkable for him.
third. afro does not appreciate the freudian nature of racism and the differences in sexual behavior and appetite between the races. it is only at puberty that people start to separate based on race. his own obscene level of promiscuity is an example which he is not ashamed of.
fourth. the case for genuine racial differences is not proven. i agree. but equality isn’t proven either, and the weight of the evidence is on the side of genuine differences. this evidence is not fabricated, biased, or racist.
LikeLike
you just made that up drake. it’s the opposite of the truth.
the oj defense is made by those too dumb to know they’re making it. in a court of law afro would lose. the jury wouldn’t have to deliberate.
LikeLike
“you’d also have to exclude the 10% of bahamians who are white.”
5% are white. There rest are mixed black/white (about 2%) and various smaller numbers of other groups like East Indians).
LikeLike
afro is right that achievement and ability cannot be separated. this is something peepee cannot understand.
in order to demonstrate that more education causes higher IQ one would have to have two populations which were identical in every way except in their amount of education. no such study has been done.
in order to demonstrate race causes differences in IQ … except in their race. this has been attempted with adoption studies. the results were that, as young children, adopted blacks scored much higher than their counterparts who weren’t adopted score in the US, but by the age of 18 there was no difference.
using afro logic this is very strong evidence that race causes variation in IQ.
LikeLike
No, because this study’s follow up was affected by sample attrition.
LikeLike
what study? why would the dumb kids stay and the smart kids leave?
LikeLike
The Minnesota transracial adoption study. I’ll link to a meta-analysis on transracial adoption studies later on tonight.
LikeLike
the only legitimate criticism of the minnesota study is that the biological parents’ IQs weren’t measured. if they were much lower than the black mean, then the adoptees may have scored higher than expected based on their parents’ IQs.
but whatever…the minnesota study is not in favor of the “race is biologically irrelevant” crowd. if the 18 year old adoptees had scored lower than the white adoptees but still much higher than the black mean this could have been explained by whatever “racism” they experienced, but the fact that the scores were the same is very bad for the afro-supremacist side.
i think their scores as young children were very important, and this supports my theory that at puberty the black brain shrinks by 50%.
LikeLike
LOL! No, these are just statistical flaws, and indeed we don’t know parental IQs, so no genetic inference can be made. Now it is just one unreplicated study that’s in contradiction with the findings of other similar studies.
LikeLike
Afro, is it this study?
http://www.mdpi.com/2079-3200/5/1/1/htm
It seems great but I admit, it’s quite hard for me to understand it.
I saw hereditarians saying the small sample size of this study make it irrelevant.
What do you think?
LikeLike
Yes, this is this study. As usual, 5he hereditarians just say whatever because this study only analyses other studies.
LikeLike
So if I understand well, the adoption studies didn’t take account of the flynn effect or things like that?
LikeLike
Yes, the Asian adoptees IQs were not adjusted for old norms which artificially inflate them.
LikeLike
also. in the US 25% of black males over the age of 24 suffer from neurosyphilis. i’ve read that in france this is 50% and in haiti 75%, but in haiti syphilis is passed from mother to child usually. it’s hard to believe, but it’s true.
LikeLike
why did you delete my source?
i thought RR wanted sources.
[RR: No porn. Scholarly sources. Be serious here please.]
LikeLike
Ron, you shouldn’t talk like if you have the upper hand on this debate. In fact, there is no upper hand from any side at all.
Anyway, in your place, I wouldn’t be proud of flawed evidence, Lynn’s data is unreliable as RR and Afrosapiens proved.
Adoption studies are meaningless http://www.mdpi.com/2079-3200/5/1/1/htm
BTW, like RR said to other people, what does IQ test test Ron ?
http://citeseerx.ist.psu.edu/viewdoc/download?doi=10.1.1.110.9895&rep=rep1&type=pdf
LikeLike
just more of the oj defense from drake.
LikeLike
afro and other apologists of black failure have yet to produce an alibi. that’s very suspicious.
LikeLike
Afrosapien did in his article about poverty and his article about history of Africa.
But I guess that your biased brain make you unable to read them.
LikeLike
were the tests taken by a representative sample of students? idk. but moldova and croatia scored higher than T&T. there was no black county on the list. T&T is richer than both by a lot. but T&T is also more unequal. though T&T is less unequal than the US.
LikeLike
You sure spam a lot, but you post few sources validating any of your claims.
LikeLike
it’s only spam to a moron. my comments are the only ones here that aren’t retarded.
LikeLike
Hey Afrosapiens! A race realist which I talk and debate with shared me replies which he consider as a direct “rebuttal” of your articles about brains/poverty and this one by youtube comments.
I asked him for direct links of the comments responding to your articles but he was on his phone and only gave me screenshots, I truly apologize for that:
I dunno if they truly goes against your articles though, I highly doubt it.
Though on it?
LikeLike
By the way, the guy who have write these comments believe in biological determinism.
Though on it RR?
LikeLike
After 2nd reading of these comments, the guy barely do anything to disprove you at all, he seems to do autistic screeching on your articles, and his tone is shitty too. Still wanted to share it with you anyway.
The guy try to explain the IQ of african americans, say that flynn effect has nothing to do with race difference in intelligence by quoting Rushton…Etc
LikeLike
Yeah, even a bot would do better. Sometimes it seems like they copy and paste some pre-made rebuttals that they regurgitate without even reading the articles they intend to refute.
LikeLike
Drake, that’s definitely copy pasta. Give the link to the YouTube video and I’ll jump in there later tonight.
My thoughts on biological determinism are in the comments of this article. Few traits are 100 percent genetic in nature.
LikeLike
“Sometimes it seems like they copy and paste some pre-made rebuttals that they regurgitate without even reading the articles they intend to refute.”
I agree. I’m sure many of them are copy/pastes, clearly they’re often ready-made. I see many of the same ones frequently on youtube, clearly mass spammed, and also repeatedly appear in the comments sections of lots of articles and blogs on vaguely relevant topics all over the internet. They often don’t care about being plausible because they assume (perhaps rightly) that enough people share their biases.
I try not to respond to too many of them. If I did, I’d probably never get finished dealing with their and their followers’ aggressively snide and dismissive, dishonest and shitposty responses and I’d probably die of stress. These people seem obsessed (like they can only save their souls by converting the world to “one true doctrine”; that “blacks are inferior”). They’re like aggressive fundamentalists (with their own missionary pamphlet-style church literature).
LikeLike
Hey RR! Don’t worry, the race realist that I talk with is a nice guy, he already asked to the other guy who posted these pasta on youtube to comment here and the guy apparently accepted, he will comment here directly.
LikeLike
Thanks for sharing, tell him to comment on here. His rebuttal is very weak I quickly read and all his pseudo arguments have been debunked by me and others. And similarly to Brian, it’s just tiring and boring to repeat the same things over and over.
LikeLike
Thanks for your response!
LikeLike
Yeah, it doesn’t look very strong from what I’ve seen, and he does not seem to have read much of your article/other counter-evidence (and it’s interspersed with smugly dismissive and unsubstantiated handwaving and accusations of “lefty drivel”). His “kid points” claim appears largely wrong. In some of the black (and other non-white and third world) countries in your chart, the scores increase with age from childhood toward adolescence/young adulthood, not decrease (the same is often seen especially with the second generation of immigrant groups in the UK, including black ones—and in the Bahamian IQ source I linked, being from a country where secondary school attendance is near universal.
(And even so, the local adults create the environment that influences the scores of kids. So I would guess that in a country where, for instance, blacks are the majority, even the scores of kids belonging to the majority group/general population will somewhat reflect the cognitive environments created by local adults who socialize/teach them, and thus can still likely be somewhat informative.)
His point about blacks from high income families scoring lower than whites from lower income families, is not seen in the UK, (or in the US when it comes to US born blacks from immigrant families—especially true in the case of Nigerians and Ghanaians where the second generation of two black immigrant parents scores above the white average and the parental generation), as Chanda Chisala has shown—the opposite of what racialist regression to the mean expectations would predict. The pattern in US blacks (of local/US slave descent) is not likely a broad racial one, and may likely have a strong cultural/environmental contribution/component.
He claims that Lynn only allows 5-6 points for IQ depression for poor nutrition, but never mentions the effects off disease burden (and even Lynn hypothesized about 15 points of IQ depressive effect.).
It’s a sloppy and unthinking response. like he doesn’t think he really needs to make sense or care , because so many people are already on the bandwagon anyway (I see that a lot)
You’re right, it certainly gets tiring, but the barrage (or campaign really, in a loose sense) of repetitive (and often disingenuous) arguments will not stop for some time I suspect, and thus I feel (or fear) usually should not be ignored.
LikeLike
Btw, I saw a guy who shared with you Black Lightning video about race realism and the response to it by the alternative hypothesis.
Well, black lightning is making a response to the alternative hypothesis’s response, he said in his twitter that it’s almost finished.
Since you have watch these videos, what links should Black Lightning use against the alternative hypothesis according to you?
In my case, I shared to him RR’s links on IQ and his flawed correlations with job performance, your article on poverty and this one, black lightning love your articles BTW and he’s also glad that someone agree with him about how flawed Lynn’s data is (I also shared to him RR’s last article).
You or RR can talk to him on twitter if you’re interested. I said RR too because I know he like opposing views, especially if the tone is correct (Black Lightning’s response to the alternative hypothesis will have no insult, unlike Ryan Faulk’s response to him who called him “black tranny lightning”).
Black Lightning already said the points of his videos isn’t to disprove the hereditarians, he said that he can’t claims that hereditarians are wrong, but his goal is to disprove the conclusions made from flawed data and unconclusive data, that’s what he mean by “debunked”.
LikeLike
Cool! I think Black Lightning’s arguments to A.Hypothesis are about flawless, and he seems to know what he talks about much better than A.Hypothesis. I’ll watch his videos later to see what he could build up but I remember finding him really efficient.
LikeLike
It’s not necassary, you already saw Black Lightning recent video on Race Realism apparently, it was the best version of his videos on Race Realism (he reapeat himself a lot on his old videos about race realism and added arguments barely relevants before, his last video on it is his best version with all his relevant arguments).
Are you interested by talking to black lightning on Twitter?
What about you RR?
LikeLike
Sure I want to talk to anyone. Then time decides what I can allocate to each debate. I’m off now, getting high so I’ll be back tomorrow.
LikeLike
https://twitter.com/thealthype/status/915788259602587648
This guy is too egocentric/dogmatic, he definitely need to go back to reality
LikeLike
afro and RR are a self-parody. afro contradicts himself again with his claim of many factors.
ALL OF THE INFO IS CONSISTENT WITH THE DUMB NEGRO THEORY. EVERY SINGLE TIME THERE HAS BEEN THE CHANCE FOR THIS THEORY TO BE DISPROVED IT HAS NOT BEEN.
LikeLike
Care to explain how I’m a self-parody?
LikeLike
yes! and this bermuda data is for adults!
if this data is true it proves that under the right circumstances whites and blacks average the same IQ. i wonder what the SDs were. in the US the black IQ SD is much smaller than the white, thus the total absence of black geniuses…except thelonius monk of course.
LikeLike
you are a self-parody because…
you see the trees but not the forest.
you’re bogged down in minutiae.
LikeLike
Expand on these thoughts. Give examples.
LikeLike
ha ha ha!
unfortunately i’m not sure if you’re joking or just engaging in more incognizant self-parody.
whatever.
the OJ case is the metaphor.
the defense attacked every pebble of evidence in the prosecution’s mountain. the trial took 11 months. in that whole time the defense never gave any exculpatory evidence.
a seed of doubt sowed in 1000 places. the defense sows 1000 tares. but it is never shown that the ground is solid rock.
LikeLike
this bermuda evidence is sufficient to prove afro’s case.
but he doesn’t appreciate why.
and apparently neither do you.
the point isn’t to jabber. the point is to decide.
italians are known for their loquacity.
LikeLike
call it voir dire. i’m telling you how to make your case afro.
if the figures for croatia and bahamas are correct this is the closest thing to an alibi i’ve heard of. the hereditists would argue that e euros are much dumber than nw euros for genetic reasons. caribbean blacks do much better in the US than native blacks. so much better that their performance cannot be explained entirely by self-selection bias, that immigrants are the smartest of their home countries. the same is not true for african immigrants, because africa has so many people, whereas the english speaking caribbean has fewer than 6m people.
it is even better evidence for the defense because all of these islands are 90+% black. that is, they don’t have the advantage of a larger white culture.
LikeLike
No, you’re trolling and your reasonings are borderline absurd. GDP/capita alone is not an appropriate control variable for IQ comparison.
Plus Caribbean countries have severe brain drain.
https://blogs.iadb.org/caribbean-dev-trends/education-policy/2016/09/28/brain-drain-a-curse-of-small-states/
LikeLike
just the usual ad hoc jive from you afro.
you must not have understood anything i wrote. as you suggested to brian, i suggest to you. learn english.
i ain’t ever wore those ugly ass shoes.
i’m still waiting for exculpatory evidence from you afro. thus far i’m the only one who has provided such evidence. the minnesota transracial adoption study + T&T’s pisa results = beyond a reasonable doubt. the jury is going to return a guilty verdict short of a deus ex machina.
LikeLike
T&T’s Pisa results and Minnesota study both mean nothing at all.
LikeLike
Since no one click the link on that Minnesota Study, I have to copy and paste the analysis like a bot. Sad!
LikeLike
so you’re still looking for “the real killers”? sad!
as usual the IQ data from the bahamas is for chillens. the minnesota study showed that black chillens’ IQs dropped like a rock after puberty. so this may happen in the bahamas too.
A second, and considerably smaller study finds a lower IQ for The Bahamas. Judith Tynes-Jones (2005 ) collected Wechsler Intelligence Scale for Children data for 29 Bahamian children, ages 6-16, in 1999. The average IQ from the three WISC sub-tests administered by Tynes-Jones is 83. Since the reported standard scores were calculated on norms from 1991, this requires a -2 point adjustment, giving us an IQ of 81.
all you have to do afro is find a single example where blacks score as high as whites in the same situation. according to you there is no such situation. being adopted by affluent whites doesn’t count. being in a rich black country doesn’t count. you also claim that black crime in canada, the US, and britain are all due to blacks being uniquely underprivileged compared to other minorities in these countries. that’s why the incarceration rate for native americans is so much higher than it is for blacks. that’s why the native american birth rate is so much higher than it is for blacks. what? they’re both lower? but injuns are the least privileged group in the US. cue afro ad hoc jive talk. all these chances blacks have to prove their equality and in every one it’s the same story. must be racism.
Native Americans are incarcerated at a rate 38% higher than the national average.
blacks on the other hand are incarcerated at 3x the national average, and in 1920 they were incarcerated at 2x the national average. must be injun privilege.
also injuns have the lowest birth rate of any ethnic group in the US.
every country outside derka derkastans and bantustans has reduced its tfr enormously. the derka derkastanis have religion as an excuse. what’s the excuse of the bantus? and naturally afro thinks 5 children per nigerian woman is great and the economic migration of these children to europe is great too.
the one thing macron has done right is tell bantus to stop fucking.
LikeLike
29 is not a small number if a representative sample. suppose the population SD for 6-16 year old bahamians is 15 points, then with 98% probability the actual mean for this population is between 86.6 and 75.4. not so clever as the croatians after all. sad!
LikeLike
Mug of pee, this is retarded, the SD and the average tell nothing about the representativeness of a sample especially when sample size is so tiny.
LikeLike
Ron Burgundy
“:as usual the IQ data from the bahamas is for chillens. the minnesota study showed that black chillens’ IQs dropped like a rock after puberty. so this may happen in the bahamas too.
A second, and considerably smaller study finds a lower IQ for The Bahamas. Judith Tynes-Jones (2005 ) collected Wechsler Intelligence Scale for Children data for 29 Bahamian children, ages 6-16, in 1999. The average IQ from the three WISC sub-tests administered by Tynes-Jones is 83. Since the reported standard scores were calculated on norms from 1991, this requires a -2 point adjustment, giving us an IQ of 81.”
And the sample with an older mean age (late adolescence, ages 16-18) and much larger sample size (694) had a higher IQ score, the opposite of what you said above. IQs do not seem to decrease with age.
“Pandora Johnson organized a large and representative sample of Bahamian secondary school children in 1987”
“The average IQ of the 20 different high schools was 95 (p 72). The scores were converted on test norms from 1979, requiring a -2 point adjustment for 8 years of norm inflation. This gives us an IQ of 93 for The Bahamas.”
“A weighted average of Johnson (1988) and Tynes-Jones (2005) gives us an IQ of 93 for The Bahamas.”
Nor do they decrease in British black (or British South Asian samples), but the reverse—maths/reading GCSE scores correlate highly with IQ, about.77 (and g—assuming g is real):
Click to access DCSF-RR029.pdf
“Some gaps change very little. For example the relative gap associated with social class, mother’s educational qualifications and entitlement to a FSM did not change substantially over the three time points. Other gaps did show substantial change. For example the gender gap increases significantly, from less than 0.07 SD at KS2 to 0.23 SD by the end of KS4, with the largest shift occurring between KS3 and KS4. The gaps for some ethnic groups decrease substantially, for example Pakistani, Bangladeshi and Black African mean scores were significantly below the White British mean at KS2 and KS3 but these gaps narrowed to less than 0.1 SD by the end of KS4, again with the big change happening during KS4.”(Steve Strand)
LikeLike
There’s also the Bermudan score, which, on the (by far) largest study (sample size 2,696) of adults, in which races are distinguished, there is no racial gap.
“Should the functional literacy test count as an achievement test or an intelligence test? At the very least the ALL and PISA include problem solving sub-tests that are not obviously related to learned material. These sub-tests seemingly have a greater conceptual claim on intelligence than, say, the Peabody Picture Vocabulary Test, the 10 item WORDSUM test from the GSS, or even a number of the sub-tests from the Wechsler tests. From a psychometric standpoint, these tests are also better constructed for international comparisons (e.g. more thoroughly checked and corrected for test bias). I will nevertheless classify them as achievement tests for now since they are not validated or popularly recognized as intelligence tests among specialists. But the ALL certainly still qualifies as evidence that Bermuda has an intelligence level comparable to Western Europe and its global diaspora.
Furthermore, the ALL classified Bermudians and Americans according to race, which allows us to see the functional literacy scores of blacks and whites in both nations on the same test. (Riley, 2006, p. 11 ; Rivera-Batiz, 2008, p. 16 ). Black-white gap? Nope. Table II shows the Achievement Quotients for all four groups, normalized against the UK TIMSS results. The U.S. gap is .74 SD, while the Bermuda gap is an invisible .03 SD.”
LikeLike
Edit: “…with IQ, (and about .77 with g—assuming…”
LikeLike
a big sample is no more likely to be representative than a small sample afrotard. unless the small sample is much less than 29 or the large sample is the entire population.
you bitched that argentina’s pisa results didn’t count because they were only for the buenos aires area. so it could have been 100k chillens and it would not have been representative of argentina if for some reason portenos are smarter than the rest. the same if it were 5k children who all lived in nassau.
if the glove don’t fit you must acquit.
sad!
LikeLike
yes jm8, there’s no need to give the bona fides of an achievement test. if the achievement test is very general rather than specific the difference between an achievement test and an IQ test is 100% nominal. that is, the achievement test vs IQ test distinction is a “distinction without a difference”.
so if this data is true then the jensenists are wrong. sad!
it’s also sad that the white man had to make afro’s arguments for him. very sad!
while afro can excuse black failure with a host of “factors”, the hereditists would never explain the failure of bermudan whites or the success of bermudan blacks with “factors”. that is, it’s not as if bermudan blacks are keeping the white man down. this is because hereditists are honest, unlike afro. except for jensen…jensen was either a liar or retarded. i’m thinking retarded.
LikeLike
you still don’t get it afro.
you’re living in flatland.
abstract!
if you can.
if i crush you with a tank like the chicoms crushed people in tiananmen
OR
i crush you with a mountain of pebbles.
you’re still crushed…
even though each pebble is “weightless”.
marion van peebles.
LikeLike
sorry.
mario van peebles.
not…
marion van peebles.
the first is a man.
the second is a woman.
a woman who moisturizes and shaves his body hair and wears yuge polo pony shirts and claims to ride on the beach with his jewish faincee.
LikeLike
The numbers of Eastern Europe aren’t made by doing tests in the region, but by postulations based on neighbouring countries, such as how it was done in North Korea. Eastern European IQ data might be lower such as what Afro estimated Bosnia to be in this article. Or the IQ of Eastern Europeans might be higher, but as noted by afro the traits of an society correlated to IQ would indicate that Lynn is overestimating the scores.
Avagering Bosnians and other populations to get an equal environment to Africans in the hypothetical sample seems to be an good way of gauging the plasticity of IQ in human groups. Unless one can controll for IQ in an more professional manner of course.
LikeLike
yes this bermuda data is the kind afro should be boosting. he should stop with the mark fuhrman angle.
The U.S. gap is .74 SD, while the Bermuda gap is an invisible .03 SD.
there are fully credentialed black actuaries believe it or not. i recall a black actuary from bermuda. she was a she too. bermuda is the world capital of insurance, not hartford. in terms of math talent it’s impossible to pass the actuarial exams unless your mathQ is > 130. there was a black ASA manager at the first company i worked for. the second company had a recently departed nigerian ASA.
what afro needs to do is find what he calls “evidences” which require the jensenists to say…
i wish to assert my 5th amendment privilege.
LikeLike
of course “arab” is not a genetic classification but a linguistic one, but there have been 4 arabs to win a nobel prize in one of the three natural science categories.
3 of them have won in chemistry. the 4th was half lebanese and won in physiology or medicine.
still waiting for that senegalese nobel in physics.
LikeLike
what might be the racist explanation of the bermuda data assuming it’s true?
the racists/hereditists would have to claim either…
i. bermudan blacks are a select population, a population that has been selected from the smartest blacks.
OR
ii. bermudan whites have been selected from the dumbest whites.
i don’t know anything about the history of bermuda except that bishop berkeley wanted to establish a college on the island.
esse est percipi.
LikeLike
“i. bermudan blacks are a select population, a population that has been selected from the smartest blacks.”
No, very unlikely. They descend from slaves, like on the other islands/former New World colonies.
“ii. bermudan whites have been selected from the dumbest whites.”
Also no. Both are measured against the British (UK white) norm.
From the source/link:
“Table II shows the Achievement Quotients for all four groups, normalized against the UK TIMSS results. The U.S. gap is .74 SD, while the Bermuda gap is an invisible .03 SD.”
LikeLike
i was making fun of any racist explanations.
i wasn’t making them.
LikeLike
Both are measured against the British (UK white) norm.
what does that have to do with anything? i don’t understand.
my point was that if bermudan whites are like the bajan red legs then the hereditists would claim that it’s not an apples and apples comparison.
but as far as i know white bermudans should score a lot higher than 100 as they are a select population, selected from the smartest whites.
so this bermuda example is like oj playing golf in south africa at the same time the murders happened.
afro needs the white man to help him in his defense. johnnie cochran isn’t enough.
LikeLike
“i was making fun of any racist explanations.
i wasn’t making them.”
I figured as much, but wasn’t quite sure—my mistake.
“”Both are measured against the British (UK white) norm.
what does that have to do with anything? i don’t understand.”
(I think) If the whites were dumber (i.e especially dumb whites) than the generally used white average/norm (the British/American white), they would have scored lower when compared/”normed” to it.
But of course I understand that you weren’t making that argument/explanation.
LikeLike
Edit:
“I figured as much, but wasn’t quite sure—my mistake. I must have missed/misread something in the post.”
LikeLike
but afro still doesn’t appreciate how the bermuda evidence (if true) is sufficient to prove his case.
it’s as if oj were in tasmania when when the murders happened.
LikeLike
the only thing in all of hbd that is certain is that southern italians are dumber than northern italians.
he laughed hysterically.
LikeLike
i mean imagine the experience of a racist/hereditist…
his whole life confirms his racism, but then he makes a holiday on an isolated island 1,000 miles off the coast of s carolina and is flummoxed.
he can’t tell the blacks from the whites in behavioral terms.
LikeLike
Mug of pee, would you like to troll elsewhere for the next few days? Peepee must be missing you, don’t you think?
LikeLike
it’s very sad that that’s your best response afro. and you claim to not be a woman?
i think even less of the french school system. especially its elite school system.
once a chekist always a chekist.
LikeLike
I just have no time to waste on you
LikeLike
what are your sources for that afro?
…
the sad truth is that afro has been defeated by a BGI volunteer.
if only afro were from bermuda…
he might’ve achieved his cognitive potential.
LikeLike
Mug of pee believes Black African = Bantu. LOL! Bantus only live in the southern half of Africa, ironically it’s the non-Bantu Muslims of the Sahel and the Horn of Africa that have the highest TFR. Middle eastern and North African Muslims have significantly reduced their TFR though. That’s called demographic transition, which is a result of transition to a more industrial society.
On Senegal having Nobel Prize recipients, lol again. Why not Guide Michelin restaurants or Sprinting champions? In case you haven’t noticed, Nobel Prize recipients tend to be old men with a lot of education. Senegal has like 14 million inhabitants, more than half are under 20, the +50 population likely has completed no more than a couple years of schooling on average, so it’s unlikely to see a Senegalese Nobel Prize recipient in a foreseeable future. Maybe Nigerian, someday or an African researcher living in Europe. Or in Japan, like this guy:
http://www.independent.co.uk/news/world/africa/nigerian-student-ufot-ekong-solves-30-year-old-maths-equation-and-breaks-academic-record-at-japanese-10303064.html
These awards are stupid, anyway.
On the Bermudan data: just because it shows blacks and whites scoring the same doesn’t change the issue of sampling and representativeness. So I don’t care, I certainly don’t need that type of evidence to refute the hereditarian fantasy.
On what it means to be Norman, just hilarious, a 1066 Norman would probably be the most undesirable type of foreigner in 21st century Normandy.
LikeLike
now afro is lying again.
i don’t equate bantus with black africans.
i was using “bantu” synecdochally.
the point was to use “bantustan” and “derka derkstan”.
for a guy who claims to have done 100 gals afro is a super NERD. sad!
some pan-africanists wanted swahili to be africa’s lingua franca.
swahili is a bantu language.
it’s afro contradicting himself as usual. he’s very sensitive about differences between various black africans, yet totally insensitive about the differences between french people and haitians. sad!
i’m living in nantes now. i’m having an affair with afro’s mother. my God you should hear what she says about afro. for one thing, she told me that the bbc is a myth.
LikeLike
i was using senegal synecdochally again afro.
i’m more and more amazed at how bad the french educations system is. sad!
afro is a korinthenkacker.
he’s one of those very rare blacks with autism.
LikeLike
a 1066 Norman would probably be the most undesirable type of foreigner in 21st century Normandy.
but UNLIKE you, he would NOT be a foreigner.
anyway…your mom tells me you’re small…down there. sad!
LikeLike
the best expert witness for the defense afro doesn’t have time for.
this proves that the point of afro’s lawyering is NOT what he claims it is.
the point of afro’s lawyering is…
black supremacism.
to show that the white man is wrong is not enough.
the white man must also be shown to be evil.
the white man must also be shown to be inferior.
it’s sad that a haitian orphan should become a black supremacist.
but it’s not surprising.
LikeLike
How do you reconcile heidegger with hegel?
LikeLike
thank you for following me here.
peepee has banned me too. or rather she won’t let me post pictures of black penises, so i quit the bitch.
i read half of the link from zizek last night just before i went to sleep.
i’ll respond in 48 hours.
btw, “habeascorpus” is “dealwithit”, the injun girl from peepee’s.
LikeLike
sorry, by “injun girl” i meant “squaw”.
the disappointing lineamants of my response are…
i. lacan was a charlatan. that zizek takes him seriously suggests he’s not that bright.
ii. i have read many commentaries on hegel because i couldn’t understand him. i am mono-lingual…at best.
iii. i don’t think hegel was a charlatan…unlike the reigning anglo-american philosophy profs. or rather, i think he may have been a charlatan or may not have been. i don’t know.
well at least he was not entirely a charlatan. his technical vocab was sparse. and he was german, not the usual french fraud like afro. ribbit.
i’ll say more within 48 hours.
LikeLike
hegel and heidegger are not in conflict as far as i can tell. no reconciliation is necessary.
LikeLike
how many know this?
afro is not black or french.
he’s a norman aristocrat.
in 1066 the normans conquered england.
afro’s ancestors were there.
at the battle of hastings.
they weren’t in togo.
to suggest otherwise is racism.
LikeLike
afro should give more news of this nigerian genius. The Independent is owned by russians. are those russians russians or are they (((russians)))?
he should also admit that he’s a virgin, and…
that he doesn’t know what “synecdochally” means.
LikeLike
The independent is owned by one Russian: Alexander Lebedev.
You totally implied that Bantu and Black African were interchangeable and that Bantu and Muslim were mutually exclusive. On Senegal, what applies there applies to all of Subsaharan Africa, there aren’t enough old educated people with a long scientific career to yield Subsaharan Nobel Prizes in science anytime soon. But this reasoning is stupid, it’s like saying Africans can’t cook because there aren’t Guide Michelin restaurants in Africa. Dumb.
I’m not a foreigner, a 1066 Norman is a foreigner in current day Normandy.
Tone down with my mom.
LikeLike
pathetic.
5 indians and 1 pakistani have won nobel prizes in one of the three natural science categories.
so have 3 full blooded arabs.
no bantus.
sad!
and the independent is owned by two russians according to wikipedia.
On Senegal, what applies there applies to all of Subsaharan Africa.
hence my use of synecdoche urkel.
don’t blame me for the myth of the bbc.
LikeLike
5 indians and 1 pakistani have won nobel prizes in one of the three natural science categories.
so have 3 full blooded arabs.
All from regions with historically much larger and older populations.
India alone is 50% more populated than Subsaharan Africa (where the population has been multiplied by about 10 since the first Nobel Prize), and has a median age of 27.6. The oldest universities in the country (Madras, Calcutta, Mumbai) were founded in 1857.
The most populated Sub-Saharan country is Nigeria, it has only one sixth India’s population, median age: 18.3. The oldest university in the country (Ibadan) was founded in 1948.
https://en.wikipedia.org/wiki/List_of_countries_by_median_age
LikeLike
ironically the above map shows the same thing that the map you deleted showed.
black people can’t practice family planning.
now afro is using the bad behavior of blacks as an excuse for why they haven’t won any nobel prizes in natural science. truly pathetic.
there’s absolutely no hope for black africa until they stop pullulating.
i’ll post it again and afro will delete it. the truth is suppressed in france.

LikeLike
How sad your life must be to spend your time here posting retarded comments Ron
LikeLiked by 1 person
ron burgundy
Until recently (ca. 1950s-80s) much of Asia (incl. India, China, and Central Asia and the Middle East) had high birthrates in the subsaharan range (they are still very high, as in high by subsaharan standards—as your map shows— in Afghanistan today) as well as the populations of Central America and the Andes. (Also, Africa’s are starting decline and are projected to continue to do so)
https://www.google.com/search?q=birth+rates+by+country&biw=1265&bih=800&source=lnms&tbm=isch&sa=X&sqi=2&ved=0ahUKEwjG9YPKv6_NAhWDFR4KHRkiD7AQ_AUIBygC#imgrc=kYCQtRilBUkd2M%3A
(second image down at right, captioned: “A world map showing countries by total fertility rate (TFR), according to World Population Prospects 2015 by UN”
https://en.wikipedia.org/wiki/Total_fertility_rate
LikeLike
yes i know that. but why has everyone else reduced his tfr?
i also know that barbados has the lowest tfr in the new world. or is it cuba? so there are blacks who can control themselves.
i also know that africa will be just as poor in 2100 if it doesn’t get its tfr under control. afro doesn’t understand this. he thinks more people is always better. a high tfr means the parents can’t save and have no time to spend building the economy. a high tfr means a high “dependency ratio”. in japan and italy it’s also old people that make a high dependency ratio. and this means all of these africans will want to move to europe. and afro thinks this is a good thing. it’s part of his delusion just like his belief that he is french and a norman aristocrat.
LikeLike
The reason “why” African TFR is high isn;t due simply due to control so the onset of industrialization can take place, it’s because due to industrialization being slow the advantages of having many kids in traditional economies (like those in the histories of Asia and Europe).
https://www.ncbi.nlm.nih.gov/pubmed/2333491
https://www.ncbi.nlm.nih.gov/pmc/articles/PMC4011385/
LikeLike
china’s once child policy coincided with its economic take off. is it just a coincidence? like most apologists for open borders afro confuses growth in GDP with growth in GDP per capita. the latter is what matters not the former.
barbados tfr estimate by the cia 2017 = 1.68.
ghana murder rate = same as canada’s, one third that of the US.
the genes are the same. if the figures are true then HBD is disproven. or at least norms of reaction is proven. if genes cause higher murder rates or higher TFRs then there should be no exceptions. this is what “cause” means.
so perhaps the difference is that white achievement is more canalized or whites are more tolerant of variation in their environment. or maybe the above figures and the bermuda figures are wrong. here’s data on bermuda’s murder rate. http://www.royalgazette.com/article/20111121/NEWS03/711219957
afro believes all races are equal but all individuals are not. he believes he is genetically superior to france’s “white trashes”, not because he is black, but because he is a norman aristocrat genetically. group and individual differences are the two parts of HBD. afro believes in the latter but not the former. this is very convenient for him as it makes him genetically superior.
LikeLike
Thank you mug of pee but I need no help to express my beliefs, and I do it accurately
LikeLike
“china’s one child policy coincided with its economic take off. is it just a coincidence?”
Not really, given how it’s rate of industrialization isn’t representative of the rest of the developing world, likely figured children were an economic cost and used the policy to initiate fast infrastructural development which is the typical nature of communist states.
“like most apologists for open borders afro confuses growth in GDP with growth in GDP per capita. the latter is what matters not the former.”
This is between you and me on TFR, whatever interpretation on Afro’s beliefs you have is irrelevant to me.
“barbados tfr estimate by the cia 2017 = 1.68.
ghana murder rate = same as canada’s, one third that of the US.
the genes are the same. if the figures are true then HBD is disproven. or at least norms of reaction is proven. if genes cause higher murder rates or higher TFRs then there should be no exceptions. this is what “cause” means.”
Sure, genes can influence those things but technically speaking the cause of crime and it’s respective level would vary under certain restraints like police enforcement, economic development, etc.
“so perhaps the difference is that white achievement is more canalized or whites are more tolerant of variation in their environment. or maybe the above figures and the bermuda figures are wrong. here’s data on bermuda’s murder rate. http://www.royalgazette.com/article/20111121/NEWS03/711219957
afro believes all races are equal but all individuals are not. he believes he is genetically superior to france’s “white trashes”, not because he is black, but because he is a norman aristocrat genetically. group and individual differences are the two parts of HBD. afro believes in the latter but not the former. this is very convenient for him as it makes him genetically superior.”
See my comment regarding Afro.
LikeLike
Mugabe,
Reduced TFR is due to, in my opinion, industrialization. Clearly as nations develop, there are too many things to do and thusly TFR will decrease.
LikeLike
Jm8,
If I recall correctly, China and Africa had the same GDP 50 years ago. I need to check my copy of A Troublesome Inheritance later.
LikeLike
Black lightning responded to the alternative hypothesis!!
Thought on it Afrosapiens and RR?
LikeLike
I’ll tell you my thoughts later. I just hate how long these videos are. If they had transcripts they’d be better and faster for me to read than to waste my an hour+ of my time listening.
LikeLike
Same issue as RR, I hardly watch any video this long except soccer, I’d appreciate a transcript.
I appreciate the artistry though.
LikeLike
I understand RR, Afro, in my case I’m used to long videos. This video is long because he responded to every argument from Faulk. Feel free to let your thoughts on it when you want.
Also afro, I don’t even watch TV anymore since 6 years. YouTube, streaming of series and anime is my new kind of TV.
Only videos games are something I keep using since my childhood
LikeLike
By the way Afrosapiens, next article when man?
LikeLike
Hi drake, I’m trying to make time to get something done before Sunday.
LikeLike
can you imagine a time when there were factories in milwaukee?
open borders and “free trade” have made such a life impossible.
also…
the french elite needs to be guillotined.
a frenchman who disagrees is a counter-revolutionary.
afro thinks louis XVI is a swell guy.
sad!
chop!
LikeLike
can you imagine a time when there were factories in milwaukee?
Better yet, can you imagine when the smallest village had farm jobs for every inhabitant and unemployment was unheard of?
Or a time when cars were luxury goods and workers lost 10% of their yearly income to inflation…
If it’s so wise to sacrifice everything to employment, then why don’t we forbid robots, computers, tractors and all those technological innovations that destroyed much more jobs than globalization?
It’s possible to have an open economy, high incomes and plenty of industrial jobs. Switzerland and Germany do it, with a different business culture with familial small scale entrepreneurship vs. shareholder dictatorship, long term orientation vs. immediate profit, vocational training vs. college obsession.
LikeLike
as usual afro you demonstrate your inability to understand english. you think you’re disagreeing but you’re agreeing with me. sad!
manufacturing as % of gdp by country. notice only one country is shittier than the US. france. sad!
thank you for giving me permission to post this afro.
[RR: Fuck off with the porn.]
LikeLike
Notice that mining is included in “industry”. France virtually has no mining sector whatsoever. Anyway, our trade balance is always positive or only slightly negative (depending on oil and gas prices), so we resist globalization better than the USA.
Now it’s funny that everybody talks about manufacturing jobs as if they were god’s gift to the poor. Because, during industry’s heydays, the factory was deemed as the closest thing to hell that one could imagine.
LikeLike
in the context of a global labor oversupply what is a gift to the poor of the developed world is not having to compete with labor in developing countries or with immigrants. automation, outsourcing, and immigration all make the average person in the developed world poorer. automation can’t be stopped, but outsourcing and immigration can be.
LikeLike
Automation can be stopped just as much. And poor in the developed world is very often preferable to average in the developing world. Poverty is always relative, as long as there are income differences, some will feel relatively poor.
LikeLike
the point of factory jobs is they paid a lot more than the jobs that factory workers have now, if any. the reason they paid more is that they were much more value added than the bullshit jobs that have replaced them.
during the debate over NAFTA many economists made the disingenuous claim that every american who lost his factory job would qualify as a computer programmer or scientist or whatever yet with no subsidy. what actually happened to these people is their lived were ruined. hillary didn’t care. obama wanted to make even more such people. thus trump was elected. ross perot was proven right.
bringing up the poor of the developing world is not the responsibility of the poor of the US. but they’re the ones who suffer. and when china is taken out of the calculation the developing world is poorer today than it was 30 years ago.
globalization and open borders is a tiny smug simpering elite kicking their countrymen in the face and telling them if they don’t like it they’re racists.
i hope macron is assassinated.
LikeLike
No these jobs made a lot more money thanks to union agreements, your made in China smartphone has more value added per worker than any Chevrolet car built in Detroit.
The low end service sector, with smaller staffs, more female workforce and fewer indispensable skills prevents unionization, that’s why the jobs are shitty.
Americans are foolish to believe that jobs have to be the sole means of redistribution. If the job market changes, it’s the responsibility of the state to increase tax income in order to increase welfare payments and subsidise the acquisition of skills that are relevant to the new economy. But state intervention is socialist blasphemy in America, and welfare means subsidizing idle niggers. So Americans vote Trump, showing their profound stupidity.
The developing world excluding or including China is richer than it was 30 years ago. But the developed world is even richer, yet the average joe isn’t. Look at the top 0.00001% instead of blaming the bottom 99.99999% of this world for what has become of the former industrial working class.
LikeLike
when hillary was the alternative voting for trump was the smart thing to do afrotard. hillary is like macron. she’s a sociopath. all she wants is power. furthermore, even bernie sanders was not proposing subsidies for the displaced. this is true of most leftists. it is true of all Democrats. if it wasn’t true of melenchon then you should have either not voted or voted for le pen. one cannot vote for people who aren’t on the ballot. you will see. things will just get worse under macron. france will continue to be germany’s butt boy, just as it was in WW II. snail eating surrender monkeys. sad!
in heaven the police are english, the cooks are french, the mechanics are germans, the swiss are the managers, and the italians are the lovers.
in hell the police are german, the cooks are english, the mechanics are french, the swiss are the lovers, and the italians are the managers.
LikeLike
there are three economic justifications for the rich.
i. when the means of production is privately owned it is better maintained, better managed.
ii. capital income is invested in more capital. thus production increases.
iii. capital income in perpetuity is reward for risking one’s capital.
i. this does not apply to most public joint stock companies as the shareholders usually have no power. many such companies are too big for kkr, icahn, et al to threaten.
ii. this is not the case much anymore. in the US 90% of accounting earnings are paid to shareholders in the form of dividends and stock buy backs. productivity is stagnant.
iii. this too is no longer much of a justification as there are so few things left which are worth investing in. the world’s most valuable and profitable company is a toy maker, aapl.
this makes wealth taxes on the very rich justifiable from the pov of economic efficiency. poverty in the developed world is no longer an economic problem. that is, it’s unnecessary. it’s now merely a political problem. but inequality is an economic problem in the developed world in the sense that it reduces aggregate demand. afro has been taught that it is better for france to be as unequal as namibia than for inflation to ever be above 3%. but afro is insane. inequality does cause inflation, inflation is asset prices.
LikeLike
and again only one developed country has a lower rate of union membership than the US. and that country is france. sad!

LikeLike
there are 410 million people living in french speaking africa. i propose they all move to france. this will be good for the french economy.
LikeLike
Businesses would indeed love it, so would the tax administration and the public retirement pension scheme.
Btw, French speaking Africa is a very theoretical concept.
LikeLike
you’re insane afro.
and obviously i meant those african countries which were once french colonies. i doubt that there any people in these countries who speak english, but do not speak french. french is the preferred european language.
LikeLike
Cameroon, Rwanda and Benin, Seychelles and Mauritius have some English speakers. Because of past British influence or proximity to Nigeria and Eastern Africa. Southern Senegal is substantially Lusophone.
LikeLike
Hello Afrosapiens! Your article is well written but Lynn’s data is actually confirmed by other authors:
https://www.researchgate.net/publication/316973000_National_IQs_revisited_The_first_steps_of_a_long-term_project
I don’t know how you can respond to this tbqh, it seems that we underestimated the validity of his data.
LikeLike
Not exactly. The author in the piece you link gets much lower IQs/scores the Lynn for South East Asia and India (lower than he does for parts of Subsaharan Africa) and also finds scores lower in North America and parts pf Europe somewhat lower than Lynn does.
LikeLike
Correction: “…gets lower IQs/scores for S.E. Asia and India *than Lynn claims for…”
LikeLike
But doesn’t this link goes against Afrosapiens’s article? Don’t get me wrong, I’m not an hereditarian, it’s just that Emil OW Kirkegaard send me this link after I showed him this article, I tried to prove that Lynn’s data seems to be biased but then he sent me this link to say that Lynn’s data is confirmed and not biased.
LikeLike
Some of the re-estimated (P&V) and 3PD) subsaharan countries’s scores appear to be in or around the 80s and (one or two) about 90 (Botswana in P&V and Uganda in 3PD), quite unlike what is found in Lynn (and several score lower—but there is not re-estimated data for a lot of the SS African countries it seems).
LikeLike
Thanks for your replies.
I’m still curious about Afrosapiens’s thought on this paper comparing to his article.
LikeLike
I would say it still suggests quite a different picture than the racial hierarchy claimed by Lynn. Since it puts some parts of subsaharan Africa closer to the 80s and 90s (or around 90)—other parts of course scoring lower, and India (70s or so), much of South East Asia (70s to 80s) and Syria and Palestine (about in 3PD but higher in the other re-analysis) as low as parts of SS Africa. I believe (though I’m not sure), that Botswana (one of the higher scoring SS African countries apparently—see my last comment) has significantly higher living standards and education rates than most of SS Africa (and a significantly lower disease burden—at least with malaria), not sure about Uganda though.
LikeLike
Correction: “…and Syria and Palestine (about 70 in 3PD but higher in the other re-estimate) ”
“I’m still curious about Afrosapiens’s thought on this paper comparing to his article.”
I am as well.
LikeLike
Edit: “Botswana…has significantly higher living standards and education rates than most of SS Africa—though of course substantially lower than the West/first world…”
LikeLike
Edit: “…some parts of subsaharan Africa closer to the 80s and 90s (or around 90/high 80s-90)…”
LikeLike
according to this all peoples have a right to a homeland except white people. they have no such right. right afro?https://en.wikipedia.org/wiki/Heimat#Support_in_international_law
afro will be forcibly repatriated within his lifetime. a voodoo priest has given me a doll of afro. it’s a tickle me elmo. she also gave me voodoo pins to stick in it.
LikeLike
Lol! The ignorant American says that as if the majority of countries with an ethnic majority weren’t overwhelmingly located in Europe.
https://en.m.wikipedia.org/wiki/List_of_countries_ranked_by_ethnic_and_cultural_diversity_llevel
This stupid idea that every tribe should have an ethnic nation is just ridiculous.
Repatriated where? I have only one citizenship in case you don’t know. Also, only losers like you want a consanguine tribal nation, and no one cares about these people, at best we’ll expel them to Greenland or Siberia.
LikeLike
Hello afro! Did you see my comment above? The one which was responded by Jm8?
LikeLike
Yes I saw it, I forgot to reply. I was aware of this reanalysis of Lynn’s estimates. It still has the same methodological flaws. No disclosed inclusion methodology of samples, no transparent literature research methodology, and unweighted averaging of samples. The only difference is that they refined Flynn effect adjustment norms by test.
Overall, this reanalysis remains as weak as Lynn’s original work.
LikeLike
repatriated to your home country afro.
afro can’t tell the difference between semantics and real life. sad! but it’s common among lawyers, especially innumerate lawyers like afro.
your home country is haiti. you’re an invader.
LikeLike
Lol, no I’ve been invited. There is no place in Haiti that I call home, nobody that I call family.
Your logic fully applies to you though Native Americans did not invite you, you’re an invader. Go back to where your ancestors came from.
LikeLike
whether haiti feels like home or not is 100% irrelevant.
the frenchmen whose ancestors fought for the emperor deserve more than you.
hugh capet was not black.
sad!
LikeLike
We’re in 2017 Mug of Pee, no one cares about Hugues Capet. In fact, we kind of despise Monarchy.
Anyhow, the definition of being French is not looking like historical figures nor even looking like them.
Could you elaborate on who deserves what more than I do? I pay more in taxes each year than many of your Le Pen voters ever will in their life and I cost much less. The IRS wants me, not the pale illiterate bigot.
LikeLike
now rr is deleting comments like a gay stalinist. sad!
i would repatriate afro. in a trice.
but i can’t.
europe only admits people like you.
(((europe))).
sad!
LikeLike
rr can’t go back to italy.
i can’t go back to siwtzerland or england or ireland or france.
LikeLike
Get adopted, marry some desperate lady, apply to a job offer, buy property, start a business, become a famous artist, athlete or scientist… These are a few things you can do to settle down here.
But by your definition of nationality, you’ll never become French.
LikeLike
yes. and that’s another problem for americans like me.
i am a mixture of english, irish, swiss, french, and haitian. i belong nowhere except america.
on both sides of my family my ancestors have been in the US since the 17th c. i’m a direct descendant of william bradford.
i and people like me deserve more but receive less than immigrants and the children of immigrants.
there’s only one (((explanation))).
LikeLike
No you don’t belong in America, you’re an invader. You don’t belong anywhere in Europe because your blood in not ethnically pure. Maybe you belong at the bottom of the oceans, in the international waters.
#mugofpeelogic.
LikeLike
yes. that’s my logic. the solution is a border wall and a moratorium on immigration. and self-deportation of recent immigrants as a result of affirmative action for americans. the same thing should happen in france.
i’m a lot more american than you will ever be french afro.
sad!
miscegenation is a sin, yet you plan on it with your jewish fiancee (who doesn’t exist. you’ve been affianced for 10 years.)
LikeLike
Trump ain’t building a wall.
LikeLike
Have you been adopted in a Native American family mug of pee? If not, you’re more foreign to this land that I’ll ever be in France.
Miscegenation is great, we make the cutest babies and create the richest cultures. Marriage is 7 months away, then we’ll start Brazilifying France as soon as possible.
LikeLike
My, this thread became cancerous…
LikeLike
Thanks for your response!
Look forward for your next articles, maybe going against other dogmatic hereditarians (again, i’m not saying that their theory is wrong but there is no credible reason to being dogmatic about it) such as the alternative hypothesis, who brag recently on twitter and his blog about how he BTFO a geneticist in a debate blablabla.
I quote him because he’s considered as untouchable, invicible, the guy to go for HBD….
LikeLike
Link?
Yep. He has incorrect views in a lot of places. I’ll probably take some time to go through some of his writing soon.
rw95,
Yea I’m going to cull the bullshit off-topic posts.
Stay on topic Mugabe.
LikeLike
“link”
Tried to find it but failed. I dunno if the debate he brag about was about IQ or just race alone. I do agree with his position about the existence of race but disagree with the rest such as IQ, testosterones, politics…etc
He has reason to believe in his theory but no credible reason to be dogmatic about it, bragging about being a champion then claim that he do not have to respond to every criticism (I can understand for retarded criticism but ignoring valid ones?)
LikeLike
Hey Afrosapien and RR, debated with a guy about adoption adoption studies, posted him this reanalyse: http://www.mdpi.com/2079-3200/5/1/1/htm
I will copy paste his response now:
(The only concrete point this paper has is that low IQ whites dropped out on the second run of the test. When adjusting for this, they concluded
“w/w kids with white adoptive parents had 101.8 iq”
“b/b kids with white adoptive parents had 90.1 iq”
Everything else is pure speculation on how the test might be wrong. Speculation holds about as much weight as the people crying systematic racism without evidence.
“adoptees cannot represent their non-adoptive ethnic group”
We don’t care about this. The purpose of this experiment is to take white genes and black genes and run them through the same environment to see if they turn out the same. We don’t actually care if blacks adopted by whites are different than blacks raised by blacks, just that adopted blacks are different than adopted whites.
“The second methodological issue is the Flynn effect”
The flynn effect doesn’t mean anything when the test is comparing two groups that take the test at the same time. We don’t care if the average IQ went up over time; we only care about the difference in IQ between two groups that were tested simultaneously.
“attrition”
This was valid. When adjusted by the paper for attrition, whites had 101.8 IQ and blacks had 90.1 IQ.)
Thoughts on it?
LikeLike
Yeah, the guy missed the points, I bet he doesn’t understand what he says.
This paper highlights that.
Once corrected for attrition in the low IQ white adoptees, mixed and white adoptees score the same, black adoptees score lower, which can be explained by their pre-adoption characteristics.
So the Minnesota study doesn’t support the Hereditarian hypothesis.
On the Flynn effect. WTF! Correcting for it is essemtial, none of the Asian adoptee studies had a white control sample.
LikeLike
Yo Afrosapiens. I saw recent studies showing that environment can be highly heritable:
http://onlinelibrary.wiley.com/doi/10.1111/brv.12322/pdf
Proof of direct mutation:
http://www.genetics.org/content/early/2017/05/31/genetics.117.201079
Thought on it? If these studies are proved in a large human scale, it will prove you right.
LikeLike
Hi, I was aware of environmental agents being able to cause mutations, the links you provide here are interesting. This, added to epigenetics makes the HBD position that DNA and heritable traits are immutable and act independently of environment untenable.
LikeLike
RR’s IQ = 85. and he has autism. sad!
LikeLike
fugetaboutit!
gabagool!
LikeLike
So he’s smarter and more socially adept than 5 of you, then?
LikeLike
this is what “cos” means.
the bermuda data are the “get out of jail free card” for the anti-HBDers.
it’s sad that the anti-HBDers are so stupid they don’t understand this.
but it’s a pretty specific environment. bermuda is the richest or one of the richest territories in the world. it’s up there with monaco and qatar.
so the bermuda data shows that under the best conceivable circumstances blacks achieve their potential, and their potential is the same as that of europeans.
under less than ideal circumstances blacks achieve less than whites. they use roofies and do 100 chicks by age 24.
i think afro is also an example of how black men are much dumber than black women, the opposite of the pattern in other races. this was noted by thomas sowell. except that gay black men are smarter than black women.
LikeLike
this is a subtle point of biology/ecology.
terms are:
eurytopic vs stenotopic (said of an organism)
canalized vs not canalized (said of a specific trait)
blacks are stenotopic. whites are eurytopic.
blacks are so stenotpic that they can only achieve their cognitive potential when…
i. they are born and raised in one of the richest territories on earth, bermuda.
ii. they are adopted by the 0.1% in france (and are homosexual).
this is all consistent with my theory that puberty is what turns blacks stupid. so if blacks were given an orchiectomy prior to puberty they would be just as smart as whites or koreans at age 18 and later despite their smaller brain volume. the brain volume IQ correlation is real and positive within races. between races idk. and i say that as a white man with a turgenev head.
LikeLike
“i think afro is also an example of how black men are much dumber than black women, the opposite of the pattern in other races. this was noted by thomas sowell. except that gay black men are smarter than black women.”
Thomas Sowell also noted the same thing of Mexicans and also of certain poor immigrant groups from Europe (including Jews and Poles) in the US in the 19th/early 20th century. It is possible that (as Sowell proposed) women may be more resistant to certain environmental IQ depressors than men are.
(the pattern would likely decrease as environmental depressors do).
A Sowell excerpt on female iq in Hispanics (Mexicans from the visible context).
“Table 12 SEX DIFFERENCES IN LATIN I.Q … However, direct comparisons between blacks and Mexican Americans are not possible from these data, which dictate a high-I.Q. cut -off score of 110 … It is striking that the female superiority pattern in I.Q.Os is found in male-dominant Latin groups, suggesting that a similar pattern among blacks …”
from:
“Essays and data on American ethnic groups” – Page 223
https://www.google.com/#q=thomas+sowell+mexican+iq+women&tbm=bks
The same was seen (not only in American blacks) but also in early working class Jewish Americans (and Hispanics—and even somewhat Chinese Americans in their early years in America) and lower clss but nor (but not upper or class) white English people.
See:
“Education: Assumptions versus History: Collected Papers” page
https://books.google.com/books?id=iUHVDgAAQBAJ&pg=PT13&dq=thomas+sowell+mexican+iq+women&hl=en&sa=X&ved=0ahUKEwidvIGSm_HWAhWKRiYKHZMMAYUQ6AEILjAB#v=onepage&q=thomas%20sowell%20mexican%20iq%20women&f=false
LikeLike
Edit: “(the pattern would likely decrease/fade as environmental depressors do—as has seemingly occurred in some of the groups mentioned).”
LikeLike
“…to environmental depressors than men are—the pattern seems to be mostly associated with poverty and low social status and the various conditions that associate/correlate with those things.”
LikeLike
Edit: “…and lower class—and many rural—(but not upper or middle class) white English people.”
LikeLike
To Jm8, sorry to distarct you but could you comment under my article of Bruce Fenton and human origins? There’s a link I want to share and discuss with you.
LikeLike
Phil
What would you like me to comment on re: that article—and/or the other one?
From what I have read of yourBruce Fenton article, I would say you make good points there, which I would agree with—I probably should reread it though to see if I have further comments, as I may have missed some details. Fenton clearly a crackpot and very disingenuous and dishonest—hardly worth taking seriously, except that sadly many uninformed and/or biased people could be convinced, as with Klyosov, whom RR discussed—the guy who thinks humans came from Russia).
I will re-read both articles and likely have one or more comments (under them) fairly soon.
LikeLike
Well, thinking back to that article, I’ve decided to see any other evidence towards OOA being debunked with genetic and fossil evidence.
Genetics wise, i’ve found this.
https://www.biorxiv.org/content/early/2017/01/18/101410
http://anthropogenesis.kinshipstudies.org/blog/2017/01/25/world-science-en-route-from-out-of-africa-to-out-of-america-first-stop-is-out-of-asia/
I want you to comment back to me when you have the time.
LikeLike
By comment I mean under the article I linked below, I want to keep this one on topic.
LikeLike
and peepee is not entirely wrong…just 99% wrong…
that subspecies which has evolved in the most demanding environment should be the most eurytopic of all subspecies. should be.
it would be interesting to look at various “invasive species” and see if this theory holds up. that is…
do “invasive species” in environment A generally come from…
a much more severe environment B?
i’m still waiting for the eskimo takeover of wall street and mass media. eskimos do have the biggest brains. supposedly.
as of today these two have been taken over by a certain mediterranean tribe, a 50/50 mixture of italian and palestinian, the ashkenazim.
maybe the theory is true for all species except humans.
LikeLike
Fuck off
LikeLike
Interesting hypothesis.
Robert Lindsay believes in something akin to this. He terms it “Super environment”. Personally i think we dont have data on the plasticity of different races in the nescesary gradients of environment to determine whether your hypothesis is true or not.
LikeLike
my theory also explains why whites are dumber than jews on average and slightly dumber than ne asians on average.
it’s not that their potential is less. it’s that they are more stenotopic in the range of environments available in the last 125 years. prior to that jews were un-accomplished.
flushton claimed that blacks had bigger balls than whites who had bigger balls than chinks…
he was trying to be “objective”.
what is true is that the sexual appetite and the changes wrought by puberty do affect adult “cognitive ability”.
part of this is social. until puberty, race differences are invisible. people wanna do it with people who look like them. all love is narcissism. all sex is masturbation.
LikeLike
Fuck off
LikeLike
one thing which the HBDers never admit because they don’t get it…
is that the environment has changed immensely over the last 150 years. immensely.
ashkenazi jews were not noted for their intelligence until recently.
newton and galileo were not jews.
the same with ne asians.
150 years ago the japs and chinks were reckoned subhuman by the british. hence the term “mongoloidism” for down’s syndrome.
LikeLike
Fuck off.
LikeLike
all my comments on topic.
the topic of racial differences in innate cognitive ability.
LikeLike
but the US is not the world…pace the GOP.
THE WORST PERFORMING RACE-GENDER GROUP IN BRITISH SCHOOLS IS…
DRUM ROLL…
WHITE MALES.
SO IF THERE IS ANY “RACISM” IN THE UK…
EHH…
THE PROBLEM FOR WHITE BOYS IS…
CLASSISM.
CLASSISM.
…
CLASSISM. (afro is a classist. he hates white-trashes.)
MAY HAS NO CHILDREN.
THE UK AND SOUTHERN ITALY SHOULD FORM A UNION.
THEN THIS UNION SHOULD BE NUKED.
SO MANY PROBLEMS SOLVED.
i. the mafia
ii. the libertarians
vaporized.
LikeLike
Haha! Classism is a problem for white boys in Britain but racism is a myth for black boys in the US.
LikeLike
my own theory of the indo-europeans is that their urheimat was two territories: haiti and benin.
i think the haitians and benin-ers had mastered open ocean sailing 1,000 years before the spanish.
but that’s just my theory.
LikeLike
This is the singular most profoundly retarded article I have ever had the displeasure to read.You don’t even take in any other factors, but use your casual correlation to assert that Lynn must be faking data and that Whites are above all else.This is not “politically incorrect”, this is pure stupidity, in all honesty.Above all else, if you really want to find an error in Lynn’s study, you should painstakingly search for fallacies or mistakes, rather than come up with this godforsaken graph.
LikeLike
You dont get it. Focus on the update he leaves out. Its an way to show that the “national IQ-national performance” correlations are different between different nations. And that these correlation differences are caused by race. This is 100% compatible with an hereditarian thesis, but if assuming some or total enviromentalism, would show error. The only exception is homocide.
LikeLike