Home » Articles posted by sillyolyou
Author Archives: sillyolyou
Goddard Undefended
A recent YouTube video from the user “Modern Heresy” purports to critique Ken Richardson’s works in his 2017 book “Genes, Brains and Human Potential: The Science and Ideology of Intelligence” as well as some of his older works. I have addressed the claims most specifically about social class here, and RaceRealist has addressed the video as a whole here, but today I want to go more in detail on the issue of Goddard, since it took up basically a third of the video. I thought the section was fairly pedantic, as it’s barely two paragraphs of his book, but since the video creator thinks it to be so important [1], it must be addressed.
The issue of Goddard’s testing of immigrants on Ellis Island has long been the subject of academic controversy, being debated in the journal American Psychologist by Herrnstein, Kamin, Albee and others (Albee 1980; Dorfman 1982; Kamin 1982; Samelson 1985; Synderman & Herrnstein 1983). The most comprehensive rebuttal to Syndermann and Herrnstein’s erroneous paper can be found in Gelb et. al (1986), as noted by RaceRealist.
Basically, the issue that the video maker alleges is based around several small issues. The first relates to the proportion of the individuals tested that were found to be feeble-minded and the meaning of this result, and the other has to do with how Goddard tested immigrants on Ellis Island.
Richardson claims in his 2017 book that:
That was after long and trying journeys, using the tests in English through interpreters. By these means, the country came to be told that 83 percent of Jews, 80 percent of Hungarians, 79 percent of Italians, and 87 percent of Russians were feebleminded. Almost as bad were the Irish, Italians, and Poles and, bottom of the list, the blacks. Only the Scandinavians and Anglo- Saxons escaped such extremes of labeling.
Richardson (2017)
The video creator correctly notes that Goddard’s study was:
makes no determination of the actual percentage, even of these groups, who are feeble-minded.
Goddard (1917)
“Modern Heresy” then claims that this statement from the beginning of the Goddard paper demonstrates that Richardson was misrepresenting the paper. I agree that it is misrepresentation insofar as Richardson did not clarify that the primary purpose of the paper was not to determine the percentage of ‘feeble-minded’ individuals, but this is different than the primary claims that Richardson was making. Richardson’s broader point here is about the use of IQ tests to cause social harm, e.g. by the passage of the Immigration Act of 1924. Clearly, as Gelb et. al (1986) has shown, he is correct on this point. But the minutiae are what are interesting here, so let’s get into them
When Richardson states that:
83 percent of Jews, 80 percent of Hungarians, 79 percent of Italians, and 87 percent of Russians were feebleminded
Richardson (2017)
he is indeed accurately quoting a real statistic from one of Goddard’s paper (contra Herrnstein 1981), which occurs in Goddard’s Table II (Dorfman 1982). And again contra Herrnstein (and Cochran et. al 2006), this sample is not (entirely) a group of immigrants specifically chosen because of their feeblemindness, but includes a fairly representative sample. As noted by Goddard:
For the purpose of the first question an investigator selected 39 cases—20 were Italians and 19 were Russians—who appeared to her to be feeble-minded. These were then tested by the other investigator, the results being recorded for later study.
Goddard (1917)
Note that contra Cochran et. al (2006), there are no Jews in the sample that Goddard specifically selected of feebleminded individuals. But Goddard’s second selection is what is most relevant here, about which he states:
For the second question cases were picked who appeared to be representative of their respective groups. In this list we had 35 Jews, 22 Hungarians, 50 Italians and 45 Russians. (5 Jews, 2 Italians and 1 Russian were children under 12 years of age.
Goddard (1917)
Despite Goddard’s caution at the beginning of the article that “the study makes no determination of the actual percentage, even of these groups, who are feebleminded” (Goddard 1917, p. 243), he later notes that the sample is “representative”(Goddard 1917, p. 244) and that despite the selection involved in the sample due to the exclusion of “superior individuals”, the small number of them ” did not noticeably affect the character of the group” (Goddard 1917, p. 244). As such, he stated that to estimate the character of these national groups, one would only have to be “revised … by a relatively small amount” (Goddard 1917, p. 244). He finally concluded that “one can hardly escape the conviction that the intelligence of the average ‘third class’ immigrant is low, perhaps of moron grade”.
But the broader point that “the country came to be told that ….” that Richardson makes is equally both slightly misrepresentative but also broadly correct. A news article published in 1917 about Goddard’s paper noted that “the most favorable interpretation of their results is that two out of every five of the immigrants studied were feebleminded” (The Survey 1917). It also describes that 83 percent of Russians were found to be feebleminded using the typical criterion, meaning that Richardson’s note that the Amerikan was exposed to the claims of immigrant feeblemindedness is accurate, even if Goddard’s article itself can’t be used to make those conclusions. Indeed, it was Pioneer Fund president Harry Laughlin who cited Goddard’s figures in his testimony to Congress during the debate over the Immigration Act of 1924 (Swanson 1995). It is well known that science is commonly misrepresented by the public, and this example may be one of many (Dumas-Mallet et. al 2017). The video creator alleges that because Goddard attributed this low intelligence level to environment rather than heredity, Richardon’s discussion of Goddard is yet again incorrect. But Richardson does not name Goddard as an anti-immigrant xenophobe, he merely points out that these figures later became the basis for anti-immigration xenophobia, which is a historical fact as noted above. Again, the video creator confuses Richardon’s discussion of Goddard and the discussion of xenophobia and then conflate Richardson’s claims with the ones made by Kamin and Gould in the past.
There is one more issue brought up in the video as to Richardon’s portrayal of Goddard’s testing of immigrants, and it is Richardson’s claim that:
Amid distressing scenes at the infamous reception center on Ellis Island, he managed to ensure that all immigrants— men, women, and children of all ages— were given the IQ test as soon as they landed
Richardson (2017)
While it is unclear as to Goddard’s specific role in the development of the use of testing during immigration proceedings on Ellis Island, it is uncontested that there was widespread use of mental tests upon entry to the island (Mullan 1917; Zenderland 1998, p. 419 note 17), and that Goddard was the person who was sent out to inspect the mental testing procedures the immigration enforcement officers were engaging in in the first place (Goddard 1917; Sussman 2014, p. 84) following the US ban on “moronic immigrants” and subsequent fear that moronic immigrants were still getting through (Davis 1925, p. 218-219; Wilkes-Barre Record 1907). Again, while Richardson’s treatment of the issue is curt and may seem a bit reductive, it is not wholly inaccurate. He’s not writing a history textbook or publishing a paper in The American Historical Review, he’s writing a book that covers numerous topics about IQ.
[1] The author again brings up the Goddard issue in the comment reply to RR’s recent article.
Social Class, Ken Richardson and “Modern Heresy”
Note: I am new to this blog. I blog at https://developmentalsystem.wordpress.com and https://www.sillyolyou.com
As RaceRealist has already noted, a recent YouTube video purports to critique Ken Richardson’s work on IQ tests and their relationship with social class. Since he already covered a number of the relevant parts about Goddard, construct validity and a number of other topics, I wanted to focus more on the question of social class. This is one of the claims that RaceRealist brings up from Richardson’s work quite frequently, so it’s probably the most pertinent at this point in time.
Note: I watched the video about a week ago, so if I get any of the details mixed up, please let me know.
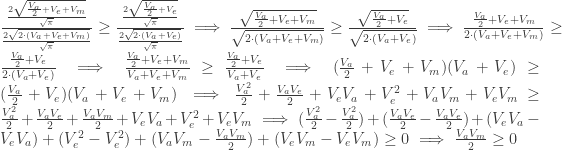
One of the claims that the author of the YouTube video makes is that because a large proportion of the variation in IQ is within-family, rather than between-families, it cannot be that IQ is a metric of social class. The logic here is quite simple: behavioral genetic studies tell us that the average difference between two siblings in the same family is about 12 IQ points, while the average difference between two randomly selected individuals in the population is 15 points. That means that, according to the creator of the video, “about 70% of the IQ variation in society is due to within-family differences”. We should note two things. The first is that the figure cited here is incorrect, even if we accept the values for the standard deviations within the family. The video creator seems to have calculated the percent of variation as a proportion of the standard deviations (


The other issue with the creators claims is the “assumption that social class varies between families but not within families”. While it may seem obvious at first, there are a number of issues. The first is that an individual’s attained social class during adulthood (and thus the social class in which they inhabit) is not identical within families. Two kids may have started off with very similar IQs due to their family environments, but due to various reasons (random chance, developed interests, etc), they moved into different social classes in adulthood, following which their IQs diverged due to the different social classes they now inhabit. The reason why this is relevant is because the statistic that the creator is using to (erroneously) claim that 70% of the variation is within families does not specify the age at which these measurements were taken – it is likely that they were taken in later life, meaning that the social class of the individuals has already diverged.
Moreover, even when children are within the same family at earlier ages, there is reason to argue that their social class is also not identical. Sociologists now understand that social class is a dynamic structure that is not only reproduced by aspects of economic access, resources and opportunity that individuals have access to, but that sociocultural signifiers, subjective experiences, interests and other aspects also contribute to ones social class. As noted by Richardson himself, one’s subjective SES may better reflect the sociocognitive environment that one develops in (Richardson & Jones 2019):
It is self-conscious social status in relation to others in a class structure – i.e. what has been called subjective as opposed to objective social class – that seems to influence a wide range of educational and cognitive outcomes. There is only moderate correlation between that and current SES
And this subjective SES can quite evidently differ between siblings and differentially impact their IQs. Moreover, there are numerous other aspects of social class that can vary within-family such as: school quality (e.g. school resources; Leon & Valdiva 2015), peer effects (Hoxby 2000), teacher and classroom effects (Boyd-Zaharias 1999; Chetty et. al 2015), and societal expectations (Jensen & McHale 2016). Small initial differences in these environmental variables can be magnified through phenotype-environment processes (Beam & Turkheimer 2013) that can create a seemingly large within-family variation that cannot be attributed to social class, but could in fact be the result of it.
Another vitally important thing to note is that even if we accept the concept of social class as measured by socioeconomic status as a simple standardized combination of income, parental education and occupational status, that doesn’t mean that this variable can’t differ in important ways within the family. First note that siblings are not always the same age (the exception is with twins). As a result, the developmental environment in which each child grows up with is not identical. As Richardson noted over a decade ago, children within the family do not experience the same environment (Richardson & Norgate 2005). This is not only because of perceptual experiences, phenotype→environment feedback loops, but because the importance of the timing of developmental experiences means that changes in parental socioeconomic status over the time means that children are exposed to different socioeconomic environments during these critical periods (Sylva 1997). For instance, parental socioeconomic status and as a result maternal stress can differ during the mother’s pregnancies (Richardson 2019), causing differences between the two children’s development.
Social Class or Sociocognitive Preparedness?
We should note that this critique is premised entirely on the idea that Richardson is positing that social class is a gigantic determinant of IQ, to the neglect of other environmental factors. This is an erroneous assumption, as the paper in which Richardson lays out his theory of what IQ tests are a proxy for (Richardson 2002; “What IQ Tests Test”), he argues that ” population variance in IQ scores can be described in terms of a nexus of sociocognitive-affective factors that differentially prepares individuals for the cognitive, affective and performance demands of the test”, that in effect, makes the test a measure of social class. Note that he does not quantify the specific amount of variation that is explained by social class, and that over 50% of the variation (as a minimum using the assumptions questioned above) explainable by social class (meaning a correlation of 0.7) could definitely qualify under his meaning. Regardless, Richardson’s primary explication is in terms of the “nexus of sociocognitive-affective factors” is perfectly compatible with the within vs between population variance described in the video.
There are numerous factors that influence intelligence that Richardson describes that can differ within families, such as “individuals’ psychological proximity to that set” of cultural tools, parental interactions with children (Hart & Risley 1995; Jensen & McHale 2016), affective preparedness, etc. All of these factors can additionally explain the IQ variance, meaning that the critique of Richardson’s explanation of IQ variance does not go through.
Predictive (In)Validity?
The creator of the video also claims that the Bell Curve demonstrated that IQ remains predictive once SES is controlled for and that IQ is a much better predictor that SES. Despite this common claim by Bell Curve fanatics, it has been demonstrated to be incorrect more times than one can count (Fischer et. al 1996; Ragin & Fiss 2016). In fact, a closer analysis of the model Murray and Herrnstein fit shows that they predicted NOT ONE of their poverty cases correctly (Krenz n.d.; see also Dickens et. al 1995, Goldberger & Manski 1995). A more thorough examination of the claims related to the alleged predictive validity of IQ can be found here.