
Home » Italians
Category Archives: Italians
Davide Piffer on Italians
1100 words
The other day on Twitter, Davide Piffer made the claim that North and South Italians are “two different races” and that the North is “governed by morons from the South.” What would make him say that North and South Italians “are two different races”? Well, a new study was just published which looked into the genetic divergence of North and South Italians. It seems that Piffer is saying that the fact that North and South Italians are genetically distinct means that they are races. But this is an error in reasoning—it is fallacious to believe that just because two groups are genetically distinct that they are therefore races.
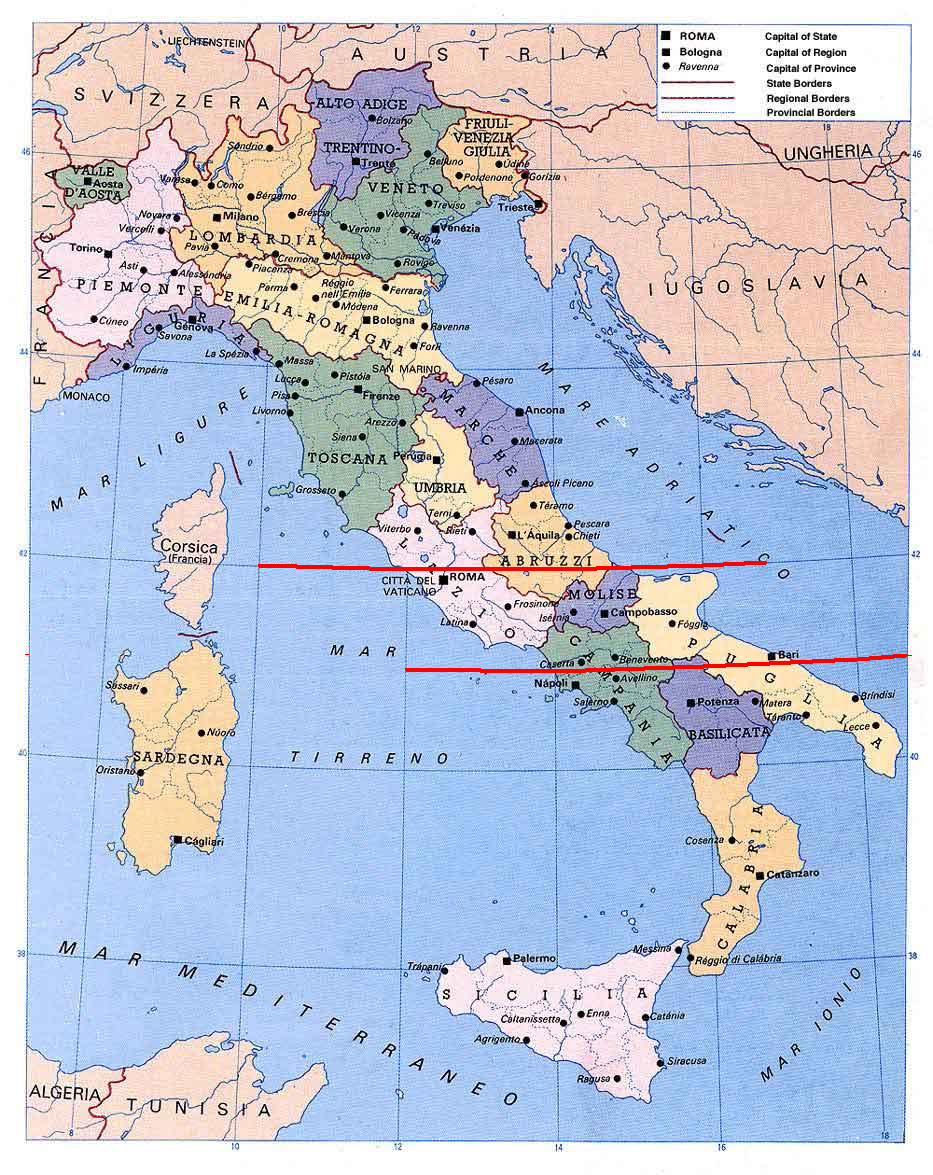
Sazzini et al (2020) show evidence that North and South Italians genetically diverged after the last glacial maximum (LGM). They state that there was “adaptive evolution” at “insulin-related loci” from Italian regions with temperate climates. The state that climatic factors differentiated those from the North and those from the South. The “adaptations” that those in the North have protect them from:
… we proposed climate-related selective pressures as potential factors having influenced adaptive evolution at insulin-related genes especially in the ancestors of Northern Italians. By regulating glucose homeostasis, adiposity, and thermogenesis in response to high-calorie diets adopted to cope with energetically demanding environmental conditions, these adaptive events might have also contributed to make people from Northern Italy less prone to develop T2D and obesity despite the challenging nutritional context imposed by modern lifestyles. Conversely, possible adaptations against pathogens and modulation of melanogenesis in response to high UV radiation are supposed to have played a role in reduced susceptibility of people from Southern Italy respectively to immunoglobulin-A nephropathy and skin cancers. Finally, multiple adaptive processes evolved by the overall Italian population, but having resulted more pronounced in people from the southern regions of the peninsula, were found to have the potential to secondarily modulate the longevity phenotype. Therefore, by pinpointing genetic determinants underlying biological adaptation of Italian population clusters in response to locally diverging environmental contexts, the present study succeeded in disclosing also valuable biomedical implications of such evolutionary events.
What they did was select 39 unrelated genomes, representative of the known genetic differences in Italian the Italian population, and then compare the differences 35 populations from all over Europe. They found divergence between the two occurred between 12 and 19 kya—they presume that the so-called “adaptations” for North Italians, being “adapted” to lower temperatures and higher-kcal food, and the so-called “adaptations” for South Italians being adapted to warmer climes, so they have “genes to protect against” skin cancer and pathogens—while gene variants ‘related’ to longer life were also showed changes in those genes.
The press release, though, cautions against adaptive conclusions:
The authors caution that although correlations may be drawn between evolutionary adaptations and current disease prevalence among populations, they are unable to prove causation, or rule out the possibility that more recent gene flow from populations exposed to diverse environmental conditions outside of Italy may have also contributed to the different genetic signatures seen between northern and southern Italians today.
While this is an interesting study (and it does need to reign back its ‘adaptive conclusions’), it does not show that North and South Italians are different races. If they are different races, how does it go? Is there a single North Italian race and a single South Italian race? Or are North Italians Caucasian, while South Italians would be African? Are there 5, 6, or 7 races in Piffer’s racial schema?
Like all hereditarians, he just assumes the existence of race—if this and that population are genetically distinct, then they must be races. Wow, how compelling an argument to show that races exist. But if North and South Italians are a different race on the basis of genetic differentiation, then so are East and West Germans (Nelis et al, 2009), North and South Germans (Heath et al, 2008), Southeast and Northwest Dutch (Lao et al, 2013), North and South Dutch (Byrne et al, 2020), Northern and Southern Swedes (Humphreys et al, 2011), East and West Fins (Kerminen et al, 2017), etc. Using genetic differentiation as a basis to show which population is or is not a race logically leads one down this path. Why not 7 billion races? Each individual is unique? Oh, wait: He would say something about “breeding populations” probably—and that’d be good because he would then be stating conditions for racehood, not just assuming their existence on the basis of genetic differentiation. Though, the claim would still fail.
Piffer has let his mask slip before—back in March he called immigrants to Italy “gorillas”, then saying that “Gorillas are nobler” because they would not take beds from the sick, since this was when Corona was really heating up in Italy. This is similar to what the “World’s Smartest Man” Christopher Langan said about gorillas and immigration. There seems to be a relationship between idiotic sayings about gorillas and immigration and racism… hmm…
In any case, the fact that North and South Italians are genetically distinct populations in no way, shape, or form, is evidence that they are different races. For if it is, then there are many, many races—even in countries with the same group of people, if we are to understand race how Piffer seems to understand it (any type of genomic differentiation between populations makes them races). So is each family on earth a different race? This is the kind of conclusion that Piffer’s lazy thinking leads to. Piffer is just like Murray—if populations cluster in genomic analyses then those population clusters are races. Two hereditarians—two assumptions that fail, since if we take them to their logical conclusion, there are more races than is traditionally stated. Piffer, it seems, just sees a group he is clearly biased agains (South Italians), sees they are distinct genomically from the North, and then says “Aha! these morons from the South who are governing us are just a different race than we are!” Clinal differences in skin color, too, don’t ‘prove’ that North and South Italians are a different race.
Too bad for Piffer, reality is different than in his own biased world. Italy is over two thousand years old—and the people in the North and the South belong to the same race. Piffer’s ‘research’ into the “IQs” of North and South Italians (Lynn, 2010; Piffer and Lynn, 2014; see Cornoldi et al, 2010; D’Amico et al, 2011; Robinson, Saggino, and Tommasi, 2011; Danielle and Malanima, 2011; Cornoldi, Giofre, and Martini, 2013; in any case, is (and has been) suspect—but now we know that he has other motivations than just iScience!
(Note: The Italianthro blog has a ton of information on Italy, its peopling, “IQ”, and other things. Check the blog out.)
The Burakumin and the Koreans: The Japanese Underclass and Their Achievement
2350 words
Japan has a caste system just like India. Their lowest caste is called “the Burakumin”, a hereditary caste created in the 17th century—the descendants of tanners and butchers. (Buraku means ‘hamlet people’ in Japanese which took on a new meaning in the Meiji era.) Even though they gained “full rights” in 1871, they were still discriminated against in housing and work (only getting menial jobs). A Burakumin Liberation League has formed, to end discrimination against Buraku in 1922, protesting to end job discrimination by the dominant Ippan Japanese. Official numbers of the number of Buraku in Japan are about 1.2 million, but unofficial numbers bring it up to 6000 communities and 3 million Buraku.
Note the similarities here with black Americans. Black Americans got their freedom from American slavery in 1865. The Burakumin got theirs in 1865. Both groups get discriminated against—the things that the Burakumin face, the blacks in America have faced. De Vos (1973: 374) describes some employment statistics for Buraku and non-Buraku:
For instance, Mahara reports the employment statistics for 166 non-Buraku children and 83 Buraku children who were graduated in March 1859 from a junior high school in Kyoto. Those who were hired by small-scale enterprises employing fewer than ten workers numbered 29.8 percent of the Buraku and 13.1 percent of the non-Buraku children; 15.1 percent of non-Buraku children obtained work in large-scale industries employing more than one thousand workers, whereas only 1.5 percent of Buraku children did so.
Certain Japanese communities—in southwestern Japan—have a belief and tradition in having foxes as pets. Those who have the potential to have such foxes descends down the family line—there are “black” foxes and “white” foxes. So in this area in southwestern Japan, people are classified as either “white” or “black”, and marriage between these artificial color lines is forbidden. They believe that if someone from the “white” family marries someone from the “black” family that every other member of the “white” family becomes “black.”
Discrimination against the Buraku in Japan is so bad, that a 330 page list of Buraku names and community placements were sold to employers. Burakumin are also more likely to join the Yakuza criminal gang—most likely due to such opportunities they miss out on in their native land. (Note similarities between Buraku joining Yakuza and blacks joining their own ethnic gangs.) It was even declared that an “Eta” (the lowest of the Burakumin) was 1/7th of an ordinary person. This is eerily familiar to how blacks were treated in America with the three-fifths compromise—signifying that the population of slaves would be counted as three-fifths in total when being apportioned to votes for the Presidential electors, taxes and other representatives.
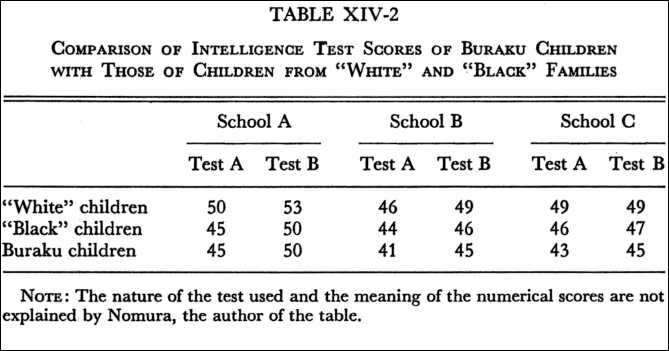
Now let’s get to the good stuff: “intelligence.” There is a gap in scores between “blacks”, “whites”, and Buraku. De Vos (1973: 377) describes score differences between “blacks”, “whites” and Buraku:
[Nomura] used two different kinds of “intelligence” tests, the nature of which are unfortunately unclear from his report. On both tests and in all three schools the results were uniform: “White” children averaged significantly higher than children from “black” families, and Buraku children, although not markedly lower than the “blacks,” averaged lowest.
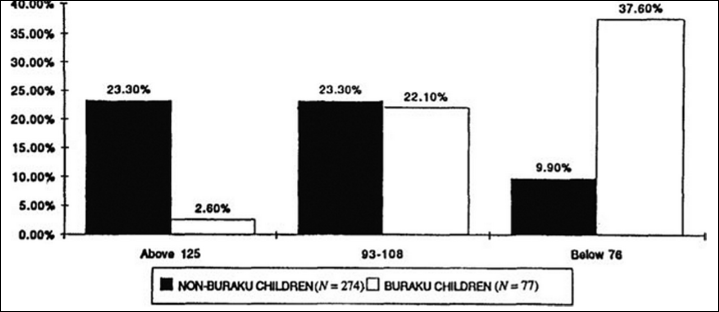
According to Tojo, the results of a Tanaka-Binet Group I.Q. Test administered to 351 fifth- and sixth-grade children, including 77 Buraku children, at a school in Takatsuki City near Osaka shows that the I.Q. scores of the Buraku children are markedly lower than those of the non-Buraku children. [Here is the table from Sternberg and Grigorenko, 2001]
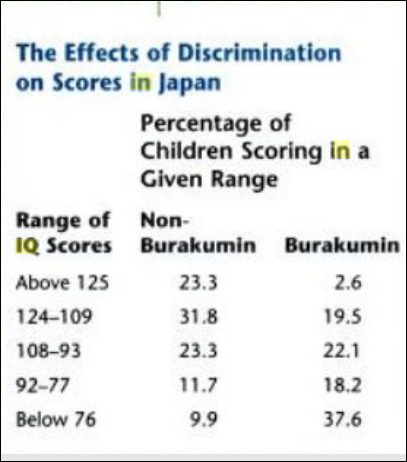
Also see the table from Hockenbury and Hockenbury’s textbook Psychology where they show IQ score differences between non-Buraku and Buraku people:
De Vos (1973: 376) also notes the similarities between Buraku and black and Mexican Americans:
Buraku school children are less successful compared with the majority group children. Their truancy rate is often high, as it is in California among black and Mexican-American minority groups. The situation in Japan also probably parallels the response to education by certain but not all minority groups in the United States.
How similar. There is another group in Japan that is an ethnic minority that is the same race as the Japanese—the Koreans. They came to Japan as forced labor during WWII—about 7.8 million Koreans were conscripted to the Japanese, men participating in the military while women were used as sex slaves. Most are born in Japan and speak no Korean, but they still face discrimination—just like the Buraku. There are no IQ test scores for Koreans in Japan, but there are standardized test scores. Koreans in America are more likely to have higher educational attainment than are native-born Americans (see the Pew data on Korean American educational attainment). But this is not the case in Japan. The following table is from Sternberg and Grigorenko (2001).
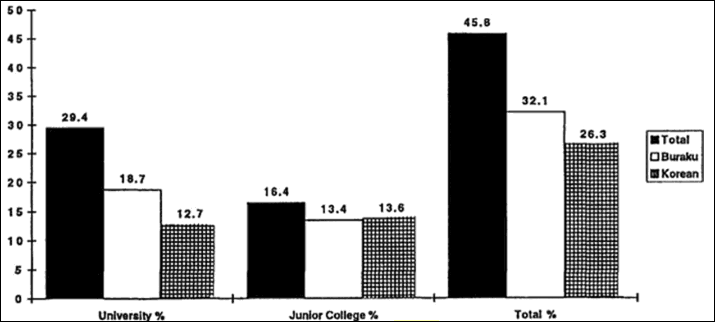
Just as Koreans do better than white Americans on standardized tests (and IQ tests), how weird is it for Koreans in Japan to score lower than ethnic Japanese and even the Burakumin? Sternberg and Grigorenko (2001) write:
Based on these cross-cultural comparison, we suggest that it is the manner in which caste and minority status combine rather than either minority position or low-caste status alone that lead to low cognitive or IQ test scores for low-status groups in complex, technological societies such as Japan and the United States. Often jobs and education require the adaptive intellectual skills of the dominant caste. In such societies, IQ tests discriminate against all minorities, but how the minority groups perform on the tests depends on whether they became minorities by immigration or choice (voluntary minorities) or were forced by the dominant group into minorities status (involuntary minorities). The evidence indicates that immigrant minority status and nonimmigrant status have different implications for IQ test performance.
The distinction between “voluntary” and “involuntary” minority is simple: voluntary minorities emigrate by choice, whereas involuntary minorities were forced against their will to be there. Black Americans, Native Hawaiians and Native Americans are involuntary minorities in America and, in the case of blacks, they face similar discrimination to the Buraku and there is a similar difference in test scores between the high and low castes (classes in America). (See the discussion in Ogbu and Simons (1998) on voluntary and involuntary minorities and also see Shimihara, (1984) for information on how the Burakumin are discriminated against.)
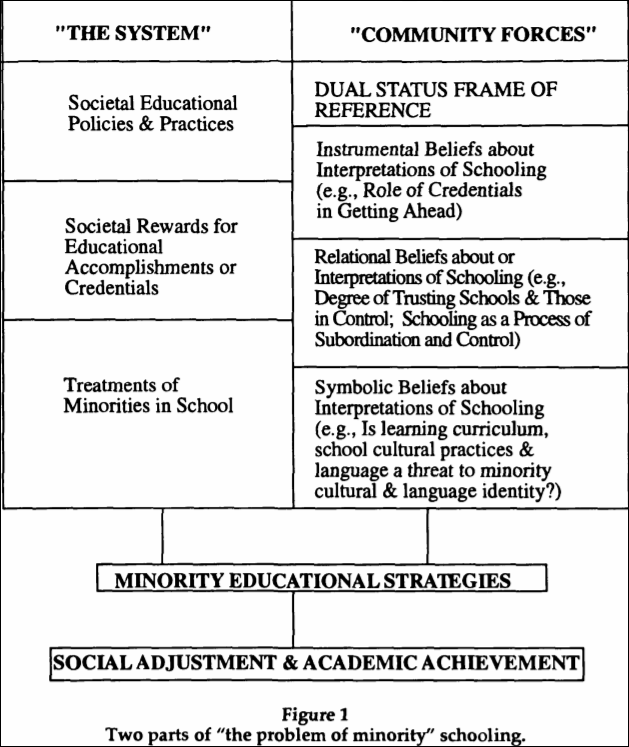
Ogbu and Simons (1988) explain the school performance of minorities using what Ogbu calls a “cultural-ecological theory” which considers societal and school factors along with community dynamics in minority communities. The first part of the theory is that minorities are discriminated against in terms of education, which Ogbu calls “the system.” The second part of the theory is how minorities respond to their treatment in the school system, which Ogbu calls “community forces.” See Figure 1 from Ogbu and Simons (1998: 156):
Ogbu and Simon (1998: 158) write about the Buraku and Koreans:
Consider that some minority groups, like the Buraku outcast in Japan, do poorly in school in their country of origin but do quite well in the United States, or that Koreans do well in school in China and in the United States but do poorly in Japan.
Ogbu (1981: 13) even notes that when Buraku are in America—since they do not look different from the Ippan—they are treated like regular Japanese-Americans who are not discriminated against in America as the Buraku are in Japan and, what do you know, they have similar outcomes to other Japanese:
The contrasting school experiences of the Buraku outcastes in Japan and in the United States are even more instructive. In Japan Buraku children continue massively to perform academically lower than the dominant Ippan children. But in the United States where the Buraku and the Ippan are treated alike by the American people, government and schools, the Buraku do just as well in school as the Ippan (DeVos 1973; Ito,1967; Ogbu, 1978a).
So, clearly, this gap between the Buraku and the Nippon disappears when they are not stratified in a dominant-subordinate relation. It’s because IQ testing and other tests of ability are culture-bound (Cole, 2004) and so, when Burakumin emigrate to America (as voluntary minorities), they are seen as and treated like any other Japanese since there are no physical differences between them and their educational attainment and IQs match the other non-Burakumin Japanese. The very items on these tests are biased towards the dominant (middle-)class—so when the Buraku and Koreans emigrate to America they then have the types of cultural and psychological tools (Richardson, 2002) to do well on the tests and so, their scores change from when they were in their other country.
Note the striking similarities between black Americans and Buraku and Korean-Japanese—all three groups are discriminated against in their countries, all three groups have lower levels of achievement than the majority population, two groups (the Buraku and black Americans, there is no IQ data for Koreans in Japan that I am aware of) show the same gap between them and the dominant group, the Buraku and black Americans got their freedom at around the same times but still face similar types of discrimination. However, when Buraku and Korean-Japanese people emigrate here to America, their IQ scores and educational attainment match that of other East Asian groups. To Americans, there is no difference between Buraku and non-Buraku Japanese people.
Koreans in Japan “endure a climate of hate“, according to The Japan Times. Koreans are heavily discriminated against in Japan. Korean-Japanese people, in any case, score worse than the Buraku. Though, as we all know, when Koreans emigrate to America they have higher test scores than whites do.
Note, though, IQ scores for “voluntary minorities” that came to the US in the 1920s. The Irish, Italians, and even Jews were screened as “low IQ” and were thusly barred entry into the country due to it. For example, Young (1922: 422) writes that:
Over 85 per cent. of the Italian group, more than 80 per cent. of the Polish group and 75 per cent. of the Greeks received their final letter grades from the beta or other performance examination.
While Young (1922) shows the results of an IQ test administered to Southern Europeans in certain areas (one of the studies was carried out in New York City):
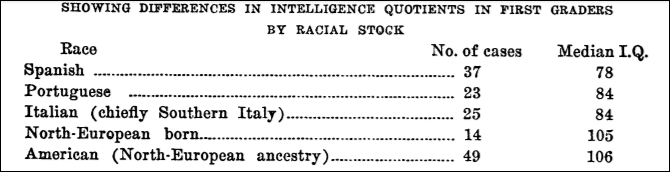
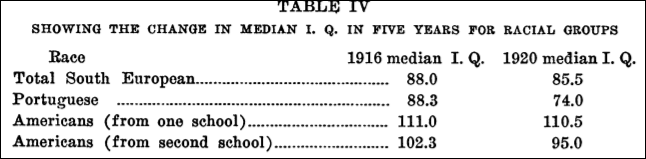
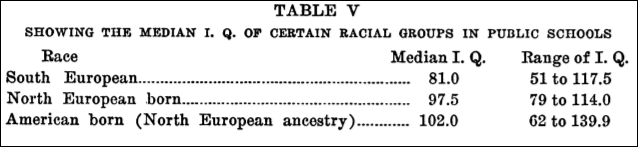
These types of score differentials are just like what these lower castes in Japan and America show today. Though, as Thomas Sowell noted in regard to the IQs of Jews, Polish, Italians, and Greeks:
Like fertility rates, IQ scores differ substantially among ethnic groups at a given time, and have changed substantially over time— reshuffling the relative standings of the groups. As of about World War I, Jews scored sufficiently low on mental tests to cause a leading “expert” of that era to claim that the test score results “disprove the popular belief that the Jew is highly intelligent.” At that time, IQ scores for many of the other more recently arrived groups—Italians, Greeks, Poles, Portuguese, and Slovaks—were virtually identical to those found today among blacks, Hispanics, and other disadvantaged groups. However, over the succeeding decades, as most of these immigrant groups became more acculturated and advanced socioeconomically, their IQ scores have risen by substantial amounts. Jewish IQs were already above the national average by the 1920s, and recent studies of Italian and Polish IQs show them to have reached or passed the national average in the post-World War II era. Polish IQs, which averaged eighty-five in the earlier studies—the same as that of blacks today—had risen to 109 by the 1970s. This twenty-four-point increase in two generations is greater than the current black-white difference (fifteen points). [See also here.]
Ron Unz notes that Sowell says about the Eastern and Southern European immigrants IQs: “Slovaks at 85.6, Greeks at 83, Poles at 85, Spaniards at 78, and Italians ranging between 78 and 85 in different studies.” And, of course, their IQs rose throughout the 20th century. Gould (1996: 227) showed that the average mental age for whites was 13.08, with anything between 8 and 12 being denoted a “moron.” Gould noted that the average Russian had a mental age of 11.34, while the Italian was at 11.01 and the Pole was at 10.74. This, of course, changed as these immigrants acclimated to American life.
For an interesting story for the creation of the term “moron”, see Dolmage’s (2018: 43) book Disabled Upon Arrival:
… Goddard’s invention of [the term moron] as a “signifier of tainted whiteness” was the “most important contribution to the concept of feeble-mindedness as a signifier of racial taint,” through the diagnosis of the menace of alien races, but also as a way to divide out the impure elements of the white race.
The Buraku are a cultural class—not a racial or ethnic group. Looking at America, the terms “black” and “white” are socialraces (Hardimon, 2017)—so could the same reasons for low Buraku educational attainment and IQ be the cause for black Americans’ low IQ and educational attainment? Time will tell, though there are no countries—to the best of my knowledge—that blacks have emigrated to and not been seen as an underclass or ‘inferior.’
The thesis by Ogbu is certainly interesting and has some explanatory power. The fact of the matter is that IQ and other tests of ability are bound by culture, and so, when the Buraku leave Japan and come to America, they are seen as regular Japanese (I’m not aware if Americans know about the Buraku/non-Buraku distinction) and they score just as well if not better than Americans and other non-Buraku Japanese. This points to discrimination and other environmental causes as the root of Buraku problems—noting that the Buraku became “full citizens” in 1871, 6 years after black slavery was ended in America. That Koreans in Japan also have similarly low educational attainment but high in America—higher than native-born Americans—is yet another point in favor of Ogbu’s thesis. The “system” and “community forces” seem to change when the two, previously low-scoring, high-crime group comes to America.
The increase in IQ of Southern and Eastern European immigrants, too, is another point in favor of Ogbu. Koreans and Buraku (indistinguishable from other native Japanese), when they leave Japan, are seen as any other Asians immigrants, and so, their outcomes are different.
In any case, the Buraku of Japan and Koreans who are Japanese citizens are an interesting look into how a group is treated can—and does—decrease test scores and social standing in Japan. Might the same hold true for blacks one day?
The Evolution of Jewish Nepotism and High IQ
1300 words
(I touched on the connection between Ashkenazi Jews and Italians. This will be about evolution of Jewish nepotism as well as another part of the puzzle to the high Jewish IQ.)
Ashkenazi Jews are over-represented in many facets in America, as well as around the world. What is the cause of Jewish nepotism? What makes them stick together so much while derogating other ethnicities?
The evolution of nepotism in Ashkenazi Jewish communities goes back a few thousand years. They constantly got kicked out of nations, 109 times to be exact, so therefore, they needed to be more clannish, which comes with increased genetic similarity. They needed to stick together and always have each other’s backs. This is due to inbreeding, which as noted above leads to increased genetic similarity and therefore, individuals who inbreed closely become more related to one another than non-co-ethnics. When two groups who are so genetically distant live in one society together, strife happens. Which is going on in Europe at the moment. But with Jews, it’s different. They are more in the background, so to speak. They hide in the shadows while giving more favoritism to their own kind, ethnic nepotism.
Ethnic nepotism in the Jewish community evolved due to persecution over the thousands of years by non-Jews on Jews for things such as usury, which is defined as the illegal action of borrowing money at extremely high interest rates. In the middle ages in Europe, the Catholic Church forbade money lending. This is where the Jews came in and became bankers, lending money to the populace of the countries. Abnormal amounts of interest were given to the people in the country. In turn, the Jews got driven out due to preying on the populace of the country and taking advantage of them.
So when they got driven out, they had to stick together. As I noted in the linked article on the connection between Ashkenazi Jews and Southern Italians, male Jews migrated from the Levant to Rome during Greco-Roman times, which mass conversions led to 6 million ( =^) Roman women who then began to practice Judaism. The genetic proximity of Ashkenazi Jews and Syrian Jews to Northern Italians, Sardinians and French populations suggest that there is non-Semitic ancestry in Ashkenazi Jews. The findings also say that any theories of Ashkenazi Jews having ancestry in Khazaria or from Slavs are incompatible with genetic studies. The close genetic similarity of Ashkenazi Jews and Southern Europeans has been noted in many studies. Any theories of Ashkenazi Jews being converts from the Khazar empire got put to rest by this paper. Anyway, that’s part of the reason for their higher average IQ, breeding with beautiful Roman women a few thousand years ago.
Combined with selection pressures selecting against those less smart Jews, as brought up by Cochran, Hardy and Harpending, this led to those less intelligent Jews to be culled from the population. Due to this, this led to them only being in occupations in which they had to have high intellect. Therefore, those less intelligent Jews couldn’t make the money needed to survive, and, therefore, their genes got taken out of the gene pool. The more intelligent Jews, in turn, then had more kids, increasing the chances for more genetic mutations to positively affect IQ. So because those rich Jews in the middle ages had more kids, this led to even more selection for higher IQs in the Ashkenazi population. So because those more intelligent Jews had more money, and obviously more intelligence, they could be more nepotistic to others in their in-group while derogating those in the out-group.
In Rushton’s paper, Ethnic nationalism, evolutionary psychology and Genetic Similarity Theory, he posits that since ethnic groups are repositories of shared genes, xenophobia, as well as out-group derogation, is the “dark side of human altruism”. Which makes sense. If you care more for your own group than for others, that will make for a better chance for individuals, as well as groups, to pass on shared genes. Due to very close inbreeding. All Ashkenazi Jews are 30th cousins. So with that increased genetic similarity, this leads to increased altruism as well as a higher chance to shun others not in the ethnic group. This is a sound evolutionary strategy to keep the close genetic similarities. Though, with whites, as I have alluded to a few times on this blog, that doesn’t happen due to media socialization (owned BY the Jews).
So because the individual is the carrier of the genes, the close relatedness (Rushton says in the paper linked above the co-ethnics from around the world are related to each other on the order of first cousins!), we can see that how we protect our close family and want nothing bad to happen to them as well as favor them over other peoples/groups, the same holds true for those ethnicities that are extremely genetically close due to inbreeding.
The close inbreeding, however, leads to an increased chance for recessive genes to be given to the child. Therefore, genetic diseases developed. In their paper, Cochran, Hardy and Harpending say that Gaucher, Tay-Sach’s and Niemann-Pick heterozygotes lead to increased IQ. To quote from the paper:
We do have strong but indirect evidence that one of these, Gaucher disease, does indeed increase IQ. Professor Ari Zimran, who heads the Gaucher Clinic at the Shaare Zedek Medical Centre in Jerusalem, furnished us a list of occupations of 302 Gaucher patients. Because of the Israeli medical care system, these are essentially all the Gaucher patients in the country. Of the 255 patients who are not retired and not students, 81 are in occupations that ordinarily average IQ’s greater than 120. There are 13 academics, 23 engineers, 14 scientists, and 31 in other high IQ occupations like accountants, physicians, or lawyers. The government of Israel states that 1.35% of Israeli’s working age population are engineers or scientists, while in the Gaucher patient sample 37/255 or 15% are engineers or scientists. Since Ashkenazim make up 60% of the workforce in Israel, a conservative base rate for engineers and scientists among Ashkenazim is 2.25% assuming that all engineers and scientists are Ashkenazim. With this rate, we expect 6 in our sample and we observe 37. The probability of 37 or more scientists and engineers in our sample, given a base rate of 2.25%, is approximately 4 x 10-19 . There are 5 physicists in the sample, while there is an equal number, 5, of unskilled workers. In the United States the fraction of people with undergraduate or higher degrees in physics is about one in one thousand. If this fraction applies even approximately to Israel the expected number of physicists in our sample is 0.25 while we observe 5. Gaucher patients are clearly a very high IQ subsample of the general population
So those certain genetic diseases, which came about due to such close inbreeding, have negative effects on Ashkenazi health, but clearly not their intellect.
The reasons for high Ashkenazi nepotism are persecutions for the past few thousand years (which led to them needing to stick together more), the need for them to go in to high IQ occupations such as banking, which led to the culling of those Jews who weren’t as intelligent, therefore leading to the culling of those genes out of the gene pool, and finally genetic diseases most likely, with some pretty solid evidence that there is a rise in a few IQ points due to certain diseases they have. The biggest reason for Jewish nepotism is, of course, increased genetic similarity due to such close inbreeding for thousands of years which basically make Ashkenazi Jews 30th cousins.
North/South Differences in Italian IQ: Is Richard Lynn Right?
2300 words
Richard Lynn has stated that there are differences in Northern and Southern Italian IQ scores. Is he correct?
Lynn claims Italian IQ is 100 in the North and 90 in the South, with the lowest being IQ 89 in the Southern most part of Sicily.
Richard Lynn is of course, extremely controversial in his research areas of interest, mainly with his views on IQ and how it relates to the wealth of nations.
In his paper which talks about the North/South differences in IQ which predict differences in education, infant mortality, stature, and literacy.
Lynn’s methods were to take samples of the Program for International Student Assesment (PISA) which administers tests gauging the abilities of students in math, reading comprehension and science understanding. IQs were calculated by averaging science understanding, reading comprehension and mathematical ability, which the averages are expressed in SD unit deviations from the British PISA mean (n=502, SD 99). Figures are then converted to conventional IQs by multiplying them by 15. So the regional Italian IQs are expressed in comparison to the British IQ and SD (100 and 15 respectively).
His 10 data points are as follows:
First, the IQ in the northern regions of Italy measured by the PISA data is approximately 100 and therefore about the same as in Britain and other countries of northern and central Europe given in Lynn and Vanhanen (2002, 2006). This confirms the results of the standardization of the Colored Progressive Matrices in northern Italy reported by Prunetti (1985) and shows that IQs measured by the PISA data and by the Colored Progressive Matrices data are consistent. Regional IQs in Italy decline steadily through the central regions and into the south and reach a low of 89 in the most southerly region of Sicily. The first hypothesis of this study that there may be a north–south gradient of IQs in Italy is supported and quantified by the correlation of 0.963 between regional IQs and latitude.
First, the PISA data from 2013 shows Southern Italians scoring higher, and Northern Italians scoring around the same. Is that an increase in intelligence that happened in only 3 years? Did the genetics of Southern Italy change in 3 years? No.
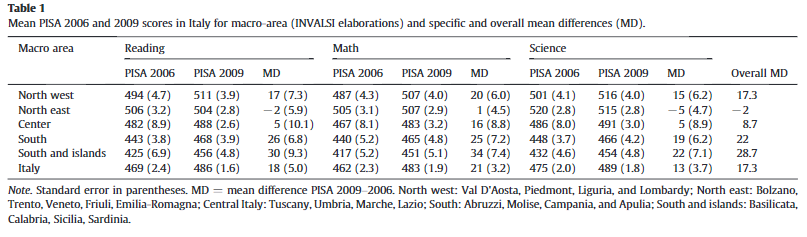
The table above shows the changes in PISA scores for Southern Italy in only 3 years for all 3 subjects tested in PISA. Southern Italy increased by 26 points in reading, and Southern Italy and islands increased by 30 points. For math, 25 for the South and 34 for South and the islands. For science, 18 for the South and 22 for the South and the islands. The presence of non-native students may also be a factor in these score differences. You can see the differences from 3 years, and how even in 3 years, there was a slight decrease in scores in Northern Italy. Migrants, after coming in from the South of the country, then continue to go into the Northern part of the country. This could also explain a huge part of the differences, seeing as they may be counted as Italian citizens, yet aren’t native to the country.
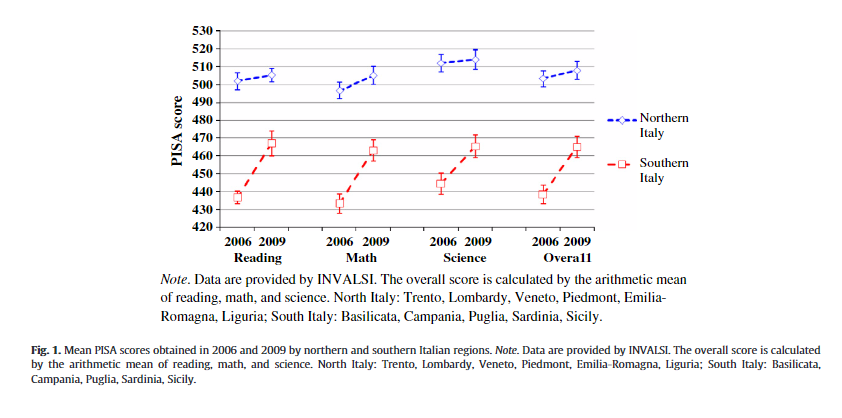
The above table shows mean PISA scores for 2006 and 2009, showing a huge increase in scores from Southern Italy, and hardly any increase in Northern Italy. Any genetic changes in 3 years to show that big of an increase?
Source: Problems in deriving Italian regional differences in intelligence from 2009 PISA data
Two, the second hypothesis of this study is that the north–south gradient of IQs in Italy may explain much of the difference in economic development between the north and south of Italy
Wrong again. Southern Italy has a huge underground economy, that isn’t noted on the books. The GDP in Southern Italy is far from accurate and employment figures do not match reality.
These raw figures require a closer look, because one economist’s analysis of Calabria found low pay, high unemployment, and a very high level of consumer spending. In 1994, the government insurance agency placed the number of business enterprises in Calabria at 23,758, while Istat, carrying out the 1996 census, found about 90,000 businesses in the same region.The economist Domenico Marino concluded, on the basis of 4,000 interviews in Calabria, that 75 percent of the Calabrian work force would refuse a fairly low-paying job, despite a very high official level of unemployment. In Calabria, with its dire employment figures, 84 percent of the families own their own home. What such anomalies must mean is that real income in Calabria is far higher than what is “on the books.” Many among the vast numbers of officially unemployed are, in fact, partly or fully employed. They are earning no social benefits, but they are earning the daily lire that keep their families afloat.
This massive sector skews all the statistics. It means that the GDP for the Italian South (and for Italy as a whole) is far from accurate. And the unemployment figures do not reflect reality.
LOOKING TO 2007: ITALY TIMES TWO
Three, the third hypothesis we set out to examine is that regional IQ differences in Italy are also manifest in variables that can be regarded as correlates or effects of IQs, including stature, infant mortality, literacy, and years of education
When historical data on those variables are used, a different picture emerges. Correlations are insignificant and in the case of infant mortality, do not the supposed link of regional differences in intelligence and socioeconomic development.
Four, per capita incomes are also highly negatively correlated with rates of infant mortality in 1954–57 (r= −0.652), and 1999–2002 (r=−0.823).
When the years 1911, 1891 and 1871 are averaged in, there is no difference.
Lynn didn’t consider the data from the 1860s to average it in with the rest of his data.
Five, the ability of populations with high IQs to give their children better nutrition makes them healthier, more resistant to disease and reduces the risk of mortality, and also improves their children’s stature
Right. But there is no mortality difference, as seen above.
Five, the ability of populations with high IQs to give their children better nutrition makes them healthier, more resistant to disease and reduces the risk of mortality, and also improves their children’s stature
There is a 1.7-inch difference between Northern and Southern Italian height. Which is explained by differences in nutrition between the regions, with the South having a more grain-based diet. Those effects are explained by a grain-based diet, and those Italians from America (which a huge majority are from the South of the country), actually show better educational attainment as well as more monetary success than their Northern counterparts.
Six, regional IQs in 2006 are highly correlated with the years of education of adults in 1951 (r=0.929), 1971 (r=0.871) and 2001 (r=0.886)
At the regional level, average IQs and current per capita GDP are highly related: for the year 2012, the correlation is 0.86. The link between IQ and regional development is, instead, much weaker when data for the years 1871, 1891 and 1911 are considered. Regional IQs and infant mortality rates in 1863–66 are positively correlated, contrarily to that which would be expected based on Lynn’s assumptions;
Two Italies? Genes, intelligence and the Italian North–South economic divide
This is explained simply. When Italy became unified in 1861, there were literacy differences in the country. 87 percent of the Southern population was illiterate in comparison to 67 percent of the Northern population.
The likely explanation for this high correlation is that the percentages of the population that were literate in 1880 was a function of IQs and therefore that the regional differences in IQs were present in 1880 and have been stable over the period 1880 to 2006.
Literacy and average years of schooling are better predictors of income levels than regional IQs.
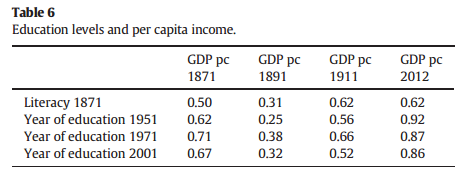
The above table shows this.
Eight, it is an interesting question whether the differences in Italian regional IQs were present in earlier historical periods. Some useful data bearing on this question have been assembled by Murray (2003, pp. 303–5) who has compiled the numbers of “significant figures” (i.e. those who have made significant contributions to science, literature, music and art) and their places of birth for the whole of Europe from the year 1400 to 1950. His figures for the north, center and south of Italy are shown in Table 3.
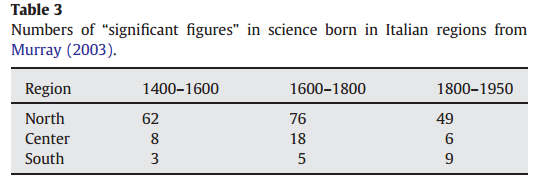
Pretty damning right? Wrong.
More than half of the country is put into the ‘North’ section of what he is talking about, and how he did the dividing, it looks like this.
Murray also said that achievement happened in a few places in Italy, with Southern Italy being one of the many areas in Europe with ‘low achievement’, which includes a big part of Northern Italy as well. The achievements in Italy were mainly found in Tuscany, which the literacy rate wasn’t too high in 1880. Again, refuting Lynn on his thesis.
Nine, Putnam (1993, p. 159) and Tabellini (2007) have proposed that “civic trust” is a determinant of regional differences in economic development in Italy and in western Europe.
There are hardly any regional differences in economic development, as seen above.
A possible explanation for the northern regions having had higher IQs than the southern regions at least from 1880 and possibly from 1400 to 1600 is that the populations of the north and south are genetically different and these genetic differences are related to differences in intelligence.
Not at all. I touched on this in my Refuting Afrocentrism: Are Italians Black? article.
They write of the population genetics of Italy that “northern Italy shows similarities with countries of central Europe, whereas central and southern Italy are more similar to Greece and other Mediterranean countries.
See above. They are genetically the same:
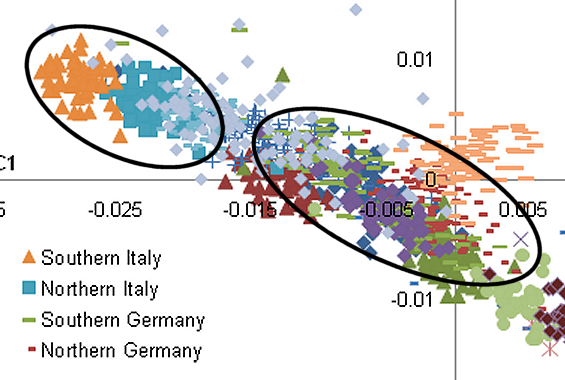
Comparison with Germany and Italy, Germans are spread out farther on the graph than are Italians, are there huge genetic differences with Germans as well?
They write of the population genetics of Italy that “northern Italy shows similarities with countries of central Europe, whereas central and southern Italy are more similar to Greece and other Mediterranean countries. This corresponds to the well-known differences in physical type (especially pigmentation and size) between the northern and north-central Italians on the one side and southern Italians on the other”.
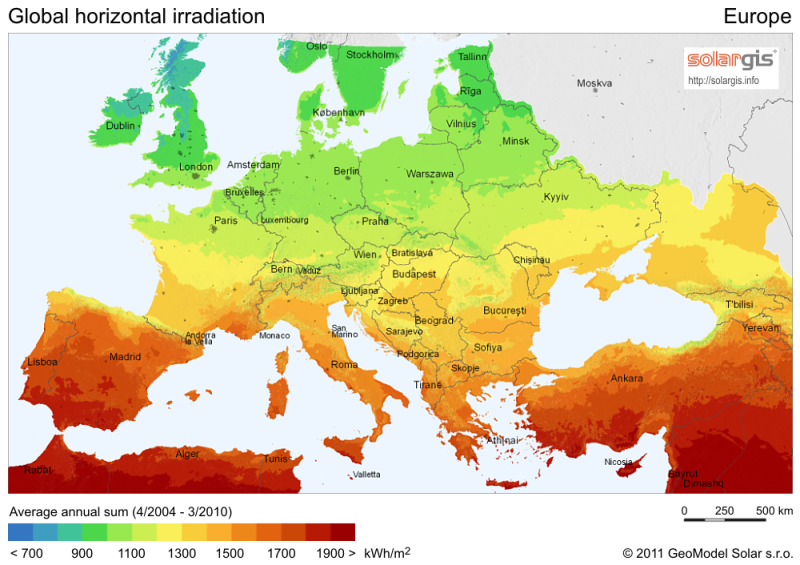
Pigmentation is explained by getting the same UV rays as Northern Africa:
Size differences explained by slight differences in nutrition.
Subsequent studies have confirmed the genetic impact of immigration from the Near East and North Africa into southern Italy. For instance, the Taql, p1 2f2-8-kb allele has a high frequency in the Near East and North Africa (Morocco, 81.8; Lebanon, 43.7; Tunisia, 34.1). The allele is also present but at a lower frequency (26.4) in southern Italy, including Sicily.
Using a single, or small number of loci will lead to you finding the same loci in different populations? Who knew!!
The diffusion of genes from the Near East and North Africa may explain why the populations of southern Italy have IQs in the range of 89–92, intermediate between those of northern Italy and central and northern Europe (about 100) and those of the Near East and North Africa (in the range of 80–84) (these IQs are given in Lynn, 2006). This also explains the north–south gradient of IQ in Italy in which the regional IQs do not show a clear dichotomy between north and south but rather a gradient in which IQs decline steadily with more southerly latitude.
Nope. I’ve covered this in my ‘Black Italians’ article:
Combined data from two large mtDNA studies provides an estimate of non-Caucasoid maternal ancestry in Italians. The first study sampled 411 Italians from all over the country and found five South Asian M and East Asian D sequences (1.2%) and eight sub-Saharan African L sequences (1.9%). The second study sampled 465 Sicilians and detected ten M sequences (2.2%) and three L sequences (0.65%).This makes a total of 3% non-white maternal admixture (1.3% Asian and 1.7% African), which is very low and typical for European populations, since Pliss et al. 2005, e.g., observed 1.8% Asian admixture in Poles and 1.2% African admixture in Germans. (Plaza et al. 2003; Romano et al. 2003)
Similar data from the Y-chromosome reveals Italians’ even lower non-Caucasoid paternal admixture. Both studies obtained samples from all over the mainland and islands. No Asian DNA was detected anywhere, but a single sub-Saharan African E(xE3b) sequence was found in the first study’s sample of 416 (0.2%), and six were observed in the second study’s sample of 746 (0.8%). The total is therefore a minuscule 0.6%, which decreases to 0.4% if only Southern Italians are considered and 0% if only Sicilians are considered.Again, these are normal levels of admixture for European populations (e.g. Austrians were found to have 0.8% E(xE3b) by Brion et al. 2004). (Semino et al. 2004; Cruciani et al. 2004)
An analysis of 10 autosomal allele frequencies in Southern Europeans (including Italians, Sicilians and Sardinians) and various Middle Eastern/North African populations revealed a “line of sharp genetic change [that] runs from Gibraltar to Lebanon,” which has divided the Mediterranean into distinct northern and southern clusters since at least the Neolithic period. The authors conclude that “gene flow [across the sea] was more the exception than the rule,” attributing this result to “a joint product of initial geographic isolation and successive cultural divergence, leading to the origin of cultural barriers to population admixture.” (Simoni et al. 1999)
One of the most important citations is the Simoni et al. 1999 cite. Which says that gene flow across the sea was more the exception than the rule. Those 3 studies above refute any ‘racial differences’ between Northern and Southern Italians.
There are problems deriving Italian IQ from PISA test scores. You cannot take PISA data and infer a group’s IQ from it!! Moreover, on purer measures of intelligence, such as Raven’s Progressive Matrices, there is no significant difference between North and South children. These are differences in achievement, not intelligence. None of the studies cited by Lynn were aimed at comparing Italian IQ across regions and none of them used the same age groups!! This is why his data on Italian IQ is wrong.
To conclude, we don’t know the true IQs of all of the regions of Italy. Lynn used faulty measures to make his theory (which doesn’t need fluff) of north/south disparities in IQ more palatable. He’s been refuted multiple times on this matter. I may do another in the future.
Italianthro source: Refuting Richard Lynn’s IQ Study
Southern Italians and Ashkenazi Jews: What Is the Connection?
700 words.
It has been noted in many studies that there is a close genetic similarity between Ashkenazi Jews and Southern Italians/Greeks. Why such close genetic similarity?
First, some history on the Mediterranean. The Greeks colonized Italy, Sicily and territory up to the Black Sea coast. This is why Southern Italians and Greeks are genetically similar.
Where do Ashkenazi Jews fit in?
The four major founders of the Ashkenazi Jew population have ancestry in prehistoric Europe, and not the Caucus or the Near East. The four minor founders share a deep European ancestry. So with genetic testing, we can see that the majority of the Ashkenazi population didn’t have its origins in the Caucus or Levant, but through assimilation of Roman women who converted to Judaism.
Overall, it seems that at least 80% of Ashkenazi maternal ancestry is due to the assimilation of mtDNAs indigenous to Europe, most likely through conversion. The phylogenetic nesting patterns suggest that the most frequent of the Ashkenazi mtDNA lineages were assimilated in Western Europe, ~2 ka or slightly earlier. Some in particular, including N1b2, M1a1b, K1a9 and perhaps even the major K1a1b1, point to a north Mediterranean source. It seems likely that the major founders were the result of the earliest and presumably most profound wave of founder effects, from the Mediterranean northwards into central Europe, and that most of the minor founders were assimilated in west/central Europe within the last 1,500 years. The sharing of rarer lineages with Eastern European populations may indicate further assimilation in some cases, but can often be explained by exchange via intermarriage in the reverse direction.
Male Jews migrated from the Levant to Rome during Greco-Roman times, which mass conversions led to 6 million Roman women who then began to practice Judaism. The genetic proximity of Ashkenazi Jews and Syrian Jews to Northern Italians, Sardinians and French populations suggest that there is non-Semitic ancestry in Ashkenazi Jews. The findings also say that any theories of Ashkenazi Jews having ancestry in Khazaria or from Slavs are incompatible with genetic studies. The close genetic similarity of Ashkenazi Jews and Southern Europeans has been noted in many studies.
So we have male Jews from the Levant who trekked to Rome around Greco-Roman times. They took beautiful Roman women as wives, who then converted to Judaism. Which brings me to another point about Ashkenazi Jews.
Again, for anyone who thinks that Ashkenazi Jews have origins in Khazaria, and thus are not the ‘True Jews’, these studies definitively put that to rest.
It’s always said that Judaism is passed down through the mother to the child. Other sects of Judaism have it passed from father to child. So why the difference with Ashkenazi Jews?
I have a simple theory.
We know that the mother’s IQ is the most important predictor of the child’s IQ. That being said, why do Ashkenazi Jews say that Judaism passes from the mother to child?
My theory is this. Because IQ is passed from the mother to child, they say that ONLY Ashkenazi women can birth an Ashkenazi Jew. We know that since IQ passes from mother to child, that the reason for Judaism being passed like that is because it’s KNOWN that mother’s are the best predictor of intelligence.
So due to Jewish males migrating to Rome and courting and mating with beautiful Roman women who then converted to Judaism, this is where the Ashkenazi Jews get their intellect from.
We can see from the average IQs of Mizrahi and Sephardic Jews that their IQs average between 85 and 95, right around the average of the Middle East.
Reading up on Italian genetics, I always wondered why they are genetically similar. I always wondered why the Aquiline nose (Roman nose) is prevalent in both Italians and Ashkenazi Jews. Though, it looks better on Italians.
I posit the Ashkenazi Jews got their current intellect from breeding with Roman women. It makes sense, especially with what we know now about mother’s and child’s IQ. This is why Ashkenazi Jews ONLY come from those women who are Ashkenazi.
I will now end with posting pictures of beautiful Southern Italian women. Enjoy.


MILAN, ITALY – SEPTEMBER 14: Elisabetta Gregoracci attends a press conference for Italian TV show ‘The Apprentice’ on September 14, 2012, in Milan, Italy. (Photo by Pier Marco Tacca/Getty Images)

The definition of beauty is Southern Italian women.
