
Home » Posts tagged 'Nutrition'
Tag Archives: Nutrition
Differences in Body Composition Between Asians and Whites
1700 words
Black-white differences get talked about more than Asian-white differences. (For the purposes of this article, “Asian” refers to Koreans, Chinese, Japanese and Filipinos whereas “white” refers to those of European descent.) One interesting racial difference is that of body fatness between ethnies/races. Blacks have thinner skin folds and lower percent body fat than whites at the same height/BMI, and Asians have higher body fat and larger skinfolds than do whites. The interesting thing about this Asian-white difference is the fact that, at the same BMI, Asians have more upper body fat (trunk) than whites. The interesting thing is that there are two good studies, looking at these types of differences between Asians and whites (one study looking at the aforementioned “Asians” I previously identified and whites in the NYC area and another comparing whites and Chinese living in China.)
Wang et al (1994) studied 687 healthy volunteers (445 whites and 242 Asians, ranging from 18-94 years of age with BMIs in the range of 15-38). They defined ethnicity as the birthplace of one’s grandparents. The “Asian” category included 225 Chinese, 9 Japanese, 6 Koreans and 2 Filipinos; 97 percent of this sample was born in Asia. Then, after an overnight fast to better assess body fat differences and skinfold measures, they were weighed and measured, with their back, butt and feet firmly against the wall.
They measured skinfold thickness at the midarm for the average of the triceps and biceps, trunk thickness was the average circumference of the chest, subscapular, umbilicus, abdomen, and suprailiac. The circumference of the arm was measured at the midarm, while the circumference of the trunk was the average circumference of the upper chest, waist, iliac crest, and chest.
Wang et al (1994) found that whites were significantly taller, heavier and had higher BMIs than Asians. Wang et al (1994: 25) write:
For lean and normal BMIs, Asians were fatter than whites in both sexes, but the differences in estimated fat% between whites and Asians varied by BMI in different directions for males and females: fat% increased with BMI for males but decreased with BMI for females.
Whites were had significantly larger circumference in the measured appendages compared to Asians, while in Asian and white females, the circumference of the arms and waist were not different but other circumferences showed a greater difference, favoring whites. Asians had significantly higher levels of subcutaneous trunk fat (upper body fat) than whites, while white females had more lower (thigh) body fat than Asians. In both sexes, Asians had thicker bicep, subscapular, abdomen, and suprailiac skinfolds than whites, in both sexes. White women had higher levels of subcutaneous fat in their thighs. The only difference between white and Asian males in regard to skinfold area was the thigh, with whites having larger thighs, but were similar at the midarm and trunk. Asian men had a larger trunk skinfold area whereas whites had a larger thigh skinfold area while arm fatness did not differ between the races. Women in both races had larger skinfold areas except in the trunk; for whites, there were no differences between the sexes. In both sexes, Asians had higher values in subcutaneous fat (at the midarm, trunk, and midthigh), but white women had a higher value in the thigh than Asian women.
Wang et al (1994) show that there are significant differences in body fatness at different sites of the body, and so, since most (if not all) BMI equations are based on white populations, then, these equations will not work for Asians and will result in substantial error.
Wang et al (2011) studied differences in body composition between Chinese and white males living in the Shenzhen, Guangdong Province, China. They studied 115 Chinese and 114 white males. In this sample, Chinese males were younger, shorter, had a lower body weight and lower BMI than the white sample. Whites had higher fat mass, fat-free mass and bioelectrical impedance (which assess body composition, which measures lean mas in relation to fat mass; but these can be skewed by how much water one has or has not drunk, and so the DXA scan and hydrostatic weighing are, in my opinion, superior assessors). After adjustment for age and BMI, the percentage of fat mass in the trunk and arm was higher in Chinese than white males. Further, Chinese men had higher diastolic blood pressure (DBP), fasting glucose (FG) and triglycerides (TG), while whites had higher fasting total plasma cholesterol (TC) and high-density lipoprotein (HDL). The only statistically significant differences were between FG and HDL. Even after adjustment, Chinese men had 3.0 mmHg higher DBP than whites.
Chinese men had higher percent body fat than whites and more fat stored around their trunks than whites at the same BMI. Chinese men had higher fasting glucose levels (a risk-factor for obesity) but lower HDL levels at the same BMI as whites. Wang et al (2011) write:
In addition, comparing the two nationally representative studies, NHANES III [32] and China National Nutrition and Health Survey 2002 (CNNHS 2002) [33], Chinese men held a relatively 15.0% lower mean value of BMI than that for American white men. While comparison results from two large-scale epidemiological studies, the Shanghai Diabetes Studies (SHDS) [34] and the NHANES III [35], show that the mean value of PBF for American men is relatively 7.4% higher than that for Chinese men. The relative difference of PBF between American and Chinese males is much less than the difference of BMI, implying that the PBF among American men should be lower than that of Chinese men with the same BMI level.
What this implies is that the proportion of overweight/obese Chinese men are severely underestimated since, as noted earlier, most—if not all—BMI equations are created using strictly white populations. This study also provides more evidence that Chinese men had more central (trunk) adiposity than whites (Britons, in this study; Eston, Evans, and Fu, 1994). Central adiposity and risk for type II diabetes and cardiovascular disease is heightened in those of Chinese descent (Weng et al, 2006). It should also be noted that, in a sample of 129 Pacific Islanders, 120 Asians, 91 Maoris, and 91 Europeans aged 12-91, the relationship between bioelectrical impedance analysis (BIA) is ethnicity-dependent, due to the fact the equations developed for fatness estimation using BIA were more accurate than what was recommended by the manufacturer (Sluyter et al, 2010). Cheng (2011) showed that central adiposity was more predictive of cardiovascular diseases in the Chinese population than was BMI, while Hu et al (2007) showed that central obesity was more related to diabetes mellitus and impaired fasting glucose than to overall obesity in the Chinese population.
So, clearly, obesity-related factors appear at lower BMIs for Asians than Europeans (e.g., Huxley et al, 2008). Pan et al (2004) showed that for most BMI values, incidences of hypertension, diabetes, and hyperuricemia were higher in the Taiwanese sample than in the white and black samples. As BMI got higher, the risk for hypertriglyceridemia and hypertension increased. They showed that BMIs of 22.6, 26, and 27.5 were the cutoffs for the best predictabilty in regard to negative and positive variables for Taiwanese, white and black men, respectively. Pan et al (2004: 31) write:
For BMIs 27, 85% of Taiwanese, 66% of whites, and 55% of blacks had at least one of the studied comorbidities. However, a cutoff close to the median of the studied population was often found by maximizing sensitivity and specificity. Reducing BMI from 25 to 25 in persons in the United States could eliminate 13% of the obesity comorbidity studied. The corresponding cutoff in Taiwan is slightly 24.
Pan et al (2004) conclude that, for Taiwanese (Asians) in their study, they should have a lower BMI cutoff than whites and blacks, though it is tough to ascertain where that cutoff would be.
Bell, Adair, and Popkin (2002) show that “at BMI levels less than 25, prevalence difference figures suggested a stronger association between BMI and hypertension in Chinese men and women but not in Filipino women, compared with non-Hispanic Whites” while “[n]on-Hispanic Blacks and Filipino women had a higher prevalence of hypertension at every level of BMI compared with non-Hispanic Whites and Mexican Americans.”
Since Asians have a higher risk of hypertension than whites after controlling for BMI, this indicates that the effects of obesity are not as important as other factors, be they genetic or environmental (or both, which it obviously is). The higher incidence of obesity-related risk-factors in Asian populations with lower BMIs has been attributed to GxE interactions, which, of course, have been intensified with the introduction of the Western Diet (AKA the SAD [Standard American Diet] diet). This can be most notably seen with the explosion of childhood obesity in China, with the number of obese people in China surpassing the US recently, while China is on its way to have the most obese children in the world. The surging obesity epidemic in China is due to increasingly similar lifestyles to what we have (sedentary populations; highly processed, high fat, high carbohydrate foodstuff).
So since the findings in the reviewed studies suggest that, at a lower BMI, Asians are more susceptible to obesity-related risk-factors, and so, BMI standards must be lowered for Asian populations, which would be BMI 24 for overweight and BMI 27 for obese, which was recommended by the Chinese Ministry of Health (Wang et al, 2010). Cheung et al (2018) show that diet quality is inversely associated with obesity in Chinese adults who have type II diabetes.
In conclusion, Asians at the same BMI have higher body fat percentage than whites, and they also have more obesity-related risk-factors than whites at a lower BMI (Pan et al, 2004; WHO expert consultation, 2004; Wang et al, 2010; Hsu et al, 2015), which implies that they need differing BMI scales, just as blacks need different scales in comparison with whites. Here is a good example of two people with the same BMI (22.3) but different DXA results:
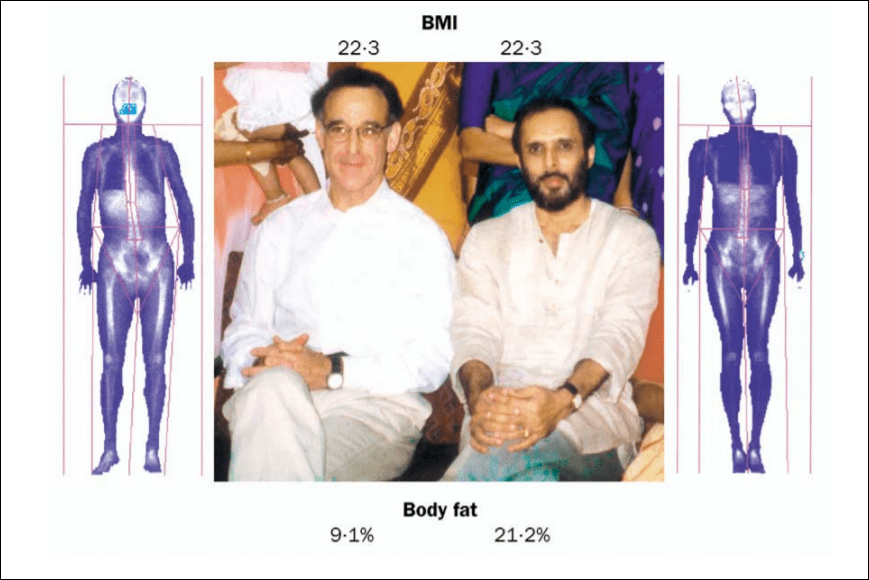
This, of course, shows the strong limitations of the use of the same BMI standards calculated in one ethny and used for another. So, just like at the same BMI blacks have lower body fat and thinner skinfolds than whites (Vickery, Cureton, and Collins, 1988; Wagner and Heyward, 2000; Flegal et al, 2010), at the same BMI as whites, Asians have higher body fat and thicker skinfolds (Wang et al, 1994; WHO expert consultation, 2004; Wang et al, 2011).
What Is the “Human Diet”?
3000 words
Is there one (or, one with slight modifications) diet that all humans should be eating? I’m skeptical of such claims. Though both vegans (one who does not eat or use animal products) and carnivores (one who eats only animal products), in my opinion, have some warped views on diet and human evolution. Both are extreme views; both have wrong ideas about diet throughout our evolution; both get some things right. Though, both are extreme views with little to no support. While it is hard to pinpoint what the “human diet” is, clearly, there were certain things that we ate through our evolutionary niches in our ancestral Africa that we “should” be eating today (in good quantities).
Although it is difficult to reconstruct the diet of early hominids due to lack of specimens (Luca, Perry, and Rienzo, 2014), by studying the eating behavior of our closest evolutionary relatives—the chimpanzees—we can get an idea of what our LCA ate and its eating behavior (Ulijaszek, Mann, and Elton, 2013). Humans have been throughout most every niche we could possibly been in and, therefore, have come across the most common foods in each ecology. If animal A is in ecosystem E with foods X, Y, and Z, then animal A eats foods X, Y, and Z, since animals consume what is in their ecosystem. Knowing this much, the niches our ancestors lived in in the past had to have a mix of both game and plants, therefore that was our diet (in differing amounts, obviously). But it is more complicated than that.
So, knowing this, according to Ulijaszek, Mann, and Elton, (2013: 35) “Mammalian comparisons may be more useful than ‘Stone Age’ perspectives, as many of the attributes of hominin diets and the behaviour associated with obtaining them were probably established well before the Pleistocene, the time stone agers were around (Foley 1995; Ulijaszek 2002; Elton 2008a).” Humans eat monocots (various flowering plants with one seed), which is not common our order. The advent of farming was us “expanding our dietary niche”, which began “the widespread adoption of agriculture [which] is an obvious point of transition to a ‘monocot world’” (Ulijaszek, Mann, and Elton, 2013). Although these foodstuffs dominate our diet, there is seasonality in what types of those foods we consume.
So since humans tend to not pick at things to eat, but have discrete meals (it is worth noting that one should have “three square meals a day” is a myth; see Mattson et al, 2014), we need to eat a lot in the times we do eat. Therefore, since we are large-bodied primates and our energy needs are much higher (due to our large brains that consume 20 percent of our daily caloric consumption), we need higher quality energy. The overall quality and energy density of our diets are due to meat-eating—which folivorous/frugivorous primates do not consume. We have a shorter gut tract which is “often attributed to the greater reliance of faunivory in humans“, though “humans are not confined to ‘browse’ vegetation … and make extensive use of grasses and their animal consumers” (Ulijaszek, Mann, and Elton, 2013: 58). Due to this, we show amazing dietary flexibility and adaptability due to our ability to eat a wide range of foodstuffs in most any environment we find ourselves in.
So “It is difficult to pinpoint what the human diet actually is … Nonetheless, humans are frequently described as omnivores” (Ulijaszek, Mann, and Elton, 2013: 59). Omnivores normally feed at two or more trophic levels, though others define it as just consuming plants and animals (Chubaty et al, 2014). Trophic level one is taken up by plants; level two is taken up by herbivores—primary consumers; level three is taken up by predators—who feed on the herbivores; level four or five is taken up by apex predators or carnivores; while the last level is also taken up by detrivores—those who feed on waste. Though, of course, “omnivory” is a continuum and not a category in and of itself. Humans eat primary producers (plants) and primary consumers (herbivores) and some secondary consumers (like fish), “although human omnivory may only be possible because of technological processing” (Ulijaszek, Mann, and Elton, 2013: 59). Other animals described as “omnivorous” eat only foods from one trophic level and only consume food from another level when needed.
Humans—as a species—rely on meat consumption. Fonseca-Azevedo and Herculano-Houzel (2012) showed that the energetic cost of a brain is directly related to the number of neurons in the brain. So, there were metabolic limitations in regard to brain and body size. The number of hours available to feed along with the low caloric yield of plant foods explains why great apes have such large bodies and small brains—which was probably overcome by erectus, who probably started cooking food around 1.5 mya. If we consumed only a diet of raw foods, then it would have taken us around 9 h/day to consume the calories we would need to power our brains—which is just not feasible. So it is unlikely that erectus—who was the first to have the human body plan and therefore the ability to run, which implies he would have needed higher quality energy—would have survived on a diet of raw plant foods since it would take so many hours to consume enough food to power their growing brains.
We can see that we are adapted to eating meat by looking at our intestines. Our small intestines are relatively long, whereas our long intestines are relatively short, which indicates that we became adapted to eating meat. Our “ability to eat significant quantities of meat and fish is a significant departure from the dietary norm of the haplorhine primates, especially for animals in the larger size classes.” Though “Humans share many features of their gut morphology with other primates, particularly the great apes, and have a gut structure that reflects their evolutionary heritage as plant, specifically ripe fruit, eaters” (Ulijaszek, Mann, and Elton, 2013: 63). Chimpanzees are not physiologically adapted to meat eating, which can be seen in the development of hypercholesterolemia along with vascular disease, even when controlled diets in captivity (Ford and Stanford, 2004).
When consuming a lot of protein, though, “rabbit starvation” needs to be kept in mind. Rabbit starvation is a type of malnutrition that arises from eating little to no fat and high amounts of protein. Since protein intake is physiologically demanding (it takes the most energy to process out of the three macros), Ben-Dor et al (2011) suggest a caloric ceiling of about 35 percent of kcal coming from protein. So erectus’ protein ceiling was 3.9 g/bw per day whereas for Homo sapiens it was 4.0 g/bw per day. Ben-Dor et al (2011) show that erectus’ DEE (daily energy expenditure) was about 2704 kcal, with “a maximum long-term plant protein ceiling of 1014 calories“, implying that erectus was, indeed, an omnivore. So, of course, the consumption of protein and raw plants are physiologically limited. Since erectus’ ceiling on protein intake was 947 kcal and his ceiling on raw plant intake was 1014 kcal, then, according to the model proposed by Ben-Dor et al (2011), erectus would have needed to consume about 744 kcal from fat, which is about 27 percent of his overall caloric intake and 44 percent of animal product intake.
Neanderthals would have consumed between 74-85 percent of their daily caloric energy during glacial winters from fat, with the rest coming from protein (Ben-Dor, Gopher, and Barkai, 2016), while consuming between 3,360 to 4,480 kcal per day (Steegman, Cerny, and Holliday, 2002). (See more on Neanderthal diet here.) Neanderthals consumed a large amount of protein, about 292 grams per day (Ben-Dor, Gopher, and Barkai, 2016: 370). Since our close evolutionary cousins (Neanderthals and erectus) ate large amounts of protein and fat, they were well-acclimated, physiologically speaking, to their high-protein diets. Though, their diets were not too high in protein to where rabbit starvation would occur—fat was consumed in sufficient amounts in the animals that Neanderthals hunted and killed, so rabbit starvation was not a problem for them. But since rabbit starvation is a huge problem for our species, “It is therefore unlikely that humans could be true carnivores in the way felids are” (Ulijaszek, Mann, and Elton, 2013: 66).
We consume a diet that is both omnivorous and eclectic, which is determined by our phylogeny through the form of our guts; we have nutritional diversity in our evolutionary history. We needed to colonize new lands and, since animals can only consume what is in their ecosystem, the foods that are edible in said ecosystem will be what is consumed by that animal. Being eclectic feeders made the migration out of Africa possible.
But humans are not true carnivores, contrary to some claims. “Meat-eating has allowed humans to colonize high latitudes and very open landscapes. However, bearing in mind the phylogenetic constraints that prevent humans from being true carnivores, such expansion was probably not accomplished through meat-eating alone. Instead, humans have used their ability to technologically harvest, produce, and consume a very wide range of foods to help exploit all major biomes” (Ulijaszek, Mann, and Elton, 2013: 67).
Humans, though, lack the gut specialization and dentition to process grasses efficiently. This means that our ancestors ate animals that ate these things, and therefore the C4 they consumed elevated the levels in the fossils we discovered. Information like this implies that our ancestors ate across a wide variety of trophic levels and had substantial dietary diversity throughout evolutionary history.
“Hominins lack the specialized dentition found in carnivorans (the group of animals that includes the cat and dog families) and other habitual meat and bone eaters, so must have pre-processed at least some of the meat in their diet” (Ulijaszek, Mann, and Elton, 2013: 81). This is where stone tools come into play (Zink and Lieberman, 2016). “Processing” food can be anything from taking out nutrients to changing how the food looks. We can look at “food processing” as a form of pre-digestion before consumption. The use of stone tools, and cooking, was imperative for us to begin the processing of meat and other foods. This gave us the ability to “pre-digest” our food before consumption, which increases the available energy in any food that is cooked/processed. For example, cooking denatures protein strands and breaks down the cell walls which gelatinizes the collagen in the meat which allows for easier chewing and digestion. Carmody et al (2016) showed that adaptation to a cooked diet began around 275 kya.
In his book Catching Fire, Wrangham (2009: 17-18) writes:
Raw-foodists are dedicated to eating 100 percent of their diets raw, or as close to 100 percent as they can manage. There are only three studies of their body weight, and all find that people who eat raw tend to be thin. The most extensive is the Giessen Raw Food study, conducted by nutritionist Corinna Koebnick and her colleagues in Germany, who used questionnaires to study 513 raw-foodists who ate from 70 to 100 percent of their diet raw. They chose to eat raw to be healthy, to prevent illness, to have a long life, or to live naturally. Raw food included not only uncooked vegetables and occasional meat, but also cold-pressed oil and honey, and some items were lightly heated such as dried fruits, dried meat, and dried fish. Body mass index (BMI), which measures weight in relation to the square of the height, was used as a measure of fatness. As the proportion of food eaten raw rose, BMI fell. The average weight loss when shifting from a cooked to a raw food diet was 26.5 pounds (12 kilograms) for women and 21.8 pounds (9.9 kilograms) for men. Among those eating a purely raw diet (31 percent), the body weights of almost a third indicated chronic energy deficiency. The scientists’ conclusion was unambiguous: “a strict raw food diet cannot guarantee an adequate energy supply.”
Also, vegetarians and meat-eaters who cooked their food have similar body weights. This implies that cooking food—no matter the type—gives more caloric energy to use for the body and that raw-foodists are fighting a losing battle with biology, consuming raw foods at such a high quantity that our guts are not used for. As can be seen above in the citation from Fonseca-Azevedo and Herculano-Houzel (2012), great apes who eat nothing but raw food have large guts and bodies which are needed to consume the raw plant foods they eat but we cannot thrive on such a diet because it is not calorically nor nutritionally viable for us—most importantly due to the size of our brains and its caloric requirements.
Carmody, Weintraub, and Wrangham (2011) show that modern raw-foodists who subsist on raw meat and plants have nutrient deficiencies and chronic energy deficiencies, even though they process their foods (cooking is a form of processing, as is cutting, mashing, pounding, etc) in different manners, while females experience low fecundity. Thus, the cooking of food seems to be needed for normal biological functioning; we have clearly evolved past consuming all raw foods. So it is clear that cooking—along with meat-eating—was imperative to our evolution. (Which does not mean that humans only ate meat and that eating meat and only meat is part of our evolutionary history.) Cooking food lead to it gelatinizing which denatured the protein, leading to easier mastication of the food, which meant less force since the food was not as hard after cooking. This then led to smaller teeth, over time, which was seen in erectus (Zink and Lieberman, 2016). This was due to cooking along with tool-use: the tool-use lead to smaller particles leading to less force per bite, which eventually led to smaller teeth in our lineage.
Finally, humans are said to be “facultative carnivores.” A facultative carnivore is an animal that does best on a carnivorous diet but can survive—not thrive—on other foodstuffs when meat is not available. This, though, doesn’t make sense. Humans are eclectic feeders—omnivorous in nature. Yes, we began cooking about 1.5 mya; yes meat-eating (and the cooking of said meat) is huge in the evolution of our species; yes without meat and cooking we would not have had the energy requirements to split off from chimpanzees/great apes. But this does not mean that we do “best” on a carnivorous diet. There are about 7,105 ethnic groups in the world (Spencer, 2014: 1029), and so to say that all of these ethnies would do the same or similar, physiologically speaking, on an all-meat diet is crazy talk. The claims that we subsisted on one type of food over the other throughout our evolutionary history is a bold claim—with no basis in evolutionary history.
Marlene Zuk (2013: 103-104), author of Paleofantasy writes:
Another implication of the importance Marlowe attaches to bow hunting is that, rather than starting out as exclusively carnivorous and then adding starches and other plant material to the diet, ancient humans have been able to increase the proportion of meat only after newer technology had come about, a mere 30,000 years ago. Other anthropologists concur that the amount of meat in the human diet grew as we diverged from our other primate ancestors. All of this means that, first, contrary to the claims of many paleo-diet proponents, the earliest humans did not have an exclusively meat-based diet that we are best adapted to eat; and second, our ancestors’ diets clearly changed dramatically and repeatedly over the last tens, not to mention hundreds, thousands of years, even before the advent of agriculture.
The assumption that we were fully (or even mostly) carnivorous and then added plant foods/carbs is clearly false. “Fantasies” like this are “just-so stories”; they are nice-sounding stories, but reality is clearly more nuanced than people’s evolutionary and Stone Age imaginations. This makes sense, though. Since we evolved from an LCA (last common ancestor) with chimpanzees some 6.3 mya (Patterson et al, 2006). So why would it make sense that we would then, ultimately, only subsist on an all-meat diet, if our LCA with chimpanzees was most likely a forager who lived in the trees (Lieberman, 2013).
One thing, though, I’m sure that everyone agrees with is that the environments we have constructed for ourselves in the first world are maladaptive—what is termed an “evolutionary mismatch” (Lieberman, 2013; Genne-Bacon, 2014). The mismatch arises from the high-carb food environments we have constructed, with cheap foodstuffs that is loaded with sugar, salt, and fat which is much more addictive than on their own (see Kessler, 2010). This makes food more palatable and people then want to eat it more. Foods like this, obviously, were not in our OEE (original evolutionary environment), and therefore cause us huge problems in our modern-day environments. Evolutionary mismatches occur when technological advancement increases faster than the genome can adapt. This can clearly be seen in our societies and the explosion of obesity over the past few decades (Fung, 2016, 2018).
We did not evolve eating highly processed carbohydrates loaded with salt and sugar. That much everyone can agree on.
Conclusion
It is clear that both claims from vegans/vegetarians and carnivores are false: there is no one “human diet” that we “should” be eating. Individual variation in different physiologic processes implies that there is no one “human diet”, no matter what type of food is being pushed as “what we should be” eating. Humans are eclectic feeders; we will eat anything since “Humans show remarkable dietary flexibility and adaptability“. Furthermore, we also “have a relatively unspecialized gut, with a colon that is shorter relative to overall size than in other apes; this is often attributed to the greater reliance on faunivory in humans (Chivers and Langer 1994)” (Ulijaszek, Mann, and Elton, 2013: 58). Our dietary eclectism can be traced back to our Australopithecine ancestors. The claim that we are either “vegetarian/vegan or carnivore” throughout our evolution is false.
Humans aren’t “natural carnivores” or “natural vegans/vegetarians.” Humans are eclectic feeders. Animals eat whatever is in their ecosystem. Ergo humans are omnivores, though we can’t pinpoint what the “human diet” is since there is great variability in it due to culture/ecology, we know one thing: we did not subsist on mainly only one food; we had a large variety of food, especially with fallback foods, to consume throughout our evolutionary history. So claims that we evolved to eat a certain way (as vegans/vegetarians and carnivores claim) is false. (Note I am not saying that high carb diets are good; I’ve railed hard on them.)
Nutrition, Development, Epigenetics, and Physical Plasticity
1650 words
Humans are extremely “plastic”. “Plastic” meaning that our development can be shaped by what goes on (or does not go in) in our developmental environment along with the environment outside of the womb. Many factors drive development, and if one factor changes then part of the developmental course for the organism changes as well. Thus, environment can and does drive development, with the addition (or subtraction) of different factors. In this article, I will discuss some of the factors that drive development and physical plasticity and what can change them.
Subsistence provides food while food provides nutrition. Nutrients, then, supply our bodies with energy and promote tissue growth—among other things. However, nutrient requirements vary across and between species, while all mammals need a mixture of macronutrients (carbs, fat, protein, water, and fiber) and micronutrients (vitamins and minerals). Biological variability in nutrient requirements and “the eventual degree of metabolic function that an individual can achieve for a particular intake level is determined to a greater or lesser extent by genetic variants in enzymes controlling the absorption, uptake, distribution, retention or utilization of the nutrient” (Molloy, 2004: 156). Thus, individuals who consume the same amount of micro and macronutrients—who also have different polymorphisms in genes coding for the metabolism of any nutrient (through hormones and enzymes)—can, and do, have differing physiological responses to same vitamin intake. Thus, differences in genetic polymorphisms between individuals can—and do—lead to different disease.
Next we have phenotypic plasticity. Phenotypic plasticity, simply put, is the ability for a genome to express a different phenotype in variable environments. For instance, people born in hotter environments—no matter their race or ethnicity—develop larger pores in order to sweat more, since sweating is needed for cooling the body (Lieberman, 2015). Phenotypic plasticity can be a problem, though, in environments with numerous environmental stressors that will stress the mother and, in turn, affect the baby’s development in the womb as well affecting post-birth events. An example of this is when food availability is low and exposure to infection is high (in-utero and post-birth), and when these stressors are removed, the organism in question shows “catch-up growth”, implying that these stressors impeded the development of the organism in question.
Maternal nutritional imbalance has been found—both in animal studies and epidemiological studies—and metabolic disturbances, during critical windows of development for the organism, have both a persistent effect on the health of the organism and can be transmitted epigenetically to future generations (Gallou-Kabani and Junien, 2005). Gallou-Kabani and Junien (2005) write:
Epigenetic chromatin marks may be propagated mitotically and, in some cases, meiotically, resulting in the stable inheritance of regulatory states. Transient nutritional stimuli occurring at critical ontogenic stages may have lasting influences on the expression of various genes by interacting with epigenetic mechanisms and altering chromatin conformation and transcription factor accessibility (11).
Thus, metabolic syndrome can show transgenerational effects by way of incomplete erasure of the epigenetic factors carried by grandparents and parents. (See also Treretola et al, 2005.) Epigenetic regulation was extremely important during our evolution and especially during the development of the human organism, and is how and why we are so phenotypically plastic.
Epigenetic regulation during fetal reprogramming of the individual in preparation for the environment they expect to enter is likely to be a response to seasonal energy imbalance; changes that favour the metabolic efficiency are likely to be adaptive in such circumstances. Removal of seasonal energy stress, as has taken place in contemporary industrialized societies, may turn efficiency toward pathology. Humans thus have evolved an animal model that can respond genetically (through natural selection), phenotypically (through developmental plasticity) and epigenetically (by a balance of both). (Ulijaszek, Mann, and Elton, 2013: 19)
This seems to be a fundamental response to the human organism in-utero, responding to the lack of food in its environment and growing accordingly (low birth weight, susceptibilities to differing disease), which are still a problem for much of the developed world. Though this can be maladaptive in the developed, industrialized world, since poor early-life environments can lead to epigenetic changes which then spell out bad consequences for the low-birth-weight baby who was exposed to a slew of negative nutritional factors during conception (and post-birth).
It has already been established that nutrition can alter the genome and epigenome (Niculescu and Lupu, 2011; Niculescu, 2012; Anderson, Sant, and Dolinoy, 2012). So if differing nutritional effects can alter the genome and epigenome and these effects are transgenerationally inherited by future generations, then famines change the expression of the genome and epigenome which can then inherited by future generations if the epigenetic factors carried by the grandparents and parents are not erased (and there is mounting evidence for this claim, see Yang, Liu, and Sun, 2017).
There is evidence of phenotypic plasticity regarding the lack of nutrition when it comes to humans, in-utero, and the evidence comes from the Dutch Family Studies (see Lumey et al, 2007 for an overview of the project). Individuals who were prenatally exposed to the Dutch winter famine of 1944-45, six decades later, had less DNA methylation of the IGF2 (insulin-like growth factor 2) gene than same-sex siblings who were not exposed to the winter famine (Heijmns et al, 2008). The IGF2 gene plays an essential role of the development of the fetus before birth. The gene is highly active during fetal development, but much less so after birth. (It should be noted that the loss of imprinting on the IGF2 gene can promote prostate cancer; Fenner, 2017 and loss of imprinting on IGF2 can also promote other types of cancer as well; Livingstone, 2013).
Stein et al (2009) concluded that “famine exposure prior to conception is associated with poorer self-reported mental health and a higher level of depressive symptoms.” Tobi et al (2009) write that their data “support the hypothesis that associations between early developmental conditions and health outcomes later in life may be mediated by changes in the epigenetic information layer.” Tobi et al (2014) also show that the “Epigenetic modulation of pathways by prenatal malnutrition may promote an adverse metabolic phenotype in later life.” The prenatal—and neonatal—periods of development are of utmost importance in order for the organism to develop normally, any deviation outside of these measures can—and does—affect the genome and epigenome (Hajj et al, 2014).
Another strong example that these responses are adaptive to the organism in question is the fact that people who were exposed to nutritional imbalances in the womb showed a higher chance of becoming obese later in life (Roseboom, de Rooji, and Painter, 2006). Their study has implications for babies born in developing countries (since famines mirror, in a way, developing countries). Roseboom, de Rooji, and Painter (2006: 489) write:
This may imply that adaptations that enable the fetus to continue to grow may nevertheless have adverse consequences for health in later life.
Roseboom, de Rooji, and Painter (2006: 490) also write:
The nutritional experience of babies who were exposed to famine in early gestation may resemble that of babies in developing countries whose mothers are undernourished in early pregnancy and receive supplementation later on, but also of babies in developed countries whose mothers suffer from severe morning sickness.
So on-going studies, such as the Dutch Famine Study, have the chance to elucidate the mechanisms of low birth weight, and it can also show us how and why those exposed to adverse conditions in the womb show so many negative symptoms which are not present in kin who were not exposed to such malnutrition in the womb. These findings also suggest that nutrition before—and after—pregnancy can play a role in disease acquisition later in life. The fact that those exposed to famines have a higher chance of becoming obese later in life (Abeleen et al, 2012; Meng et al, 2017) shows that this adaptive response of the organism in the womb was very important in our evolution; the babe exposed to low maternal nutrition in the womb can, after birth, consume enough energy to become overweight, which would have been an adaptive evolutionary response to low maternal caloric energy.
Babies who are exposed to maternal under-nutrition in the womb—when exposed to an environment with ample foodstuffs—are at heightened risk of becoming type II diabetics and acquiring metabolic syndromes (Robinson, Buchholz, and Mazurak, 2007). This seems to be an adaptive, plastic response of the organism: since nutrients/energy were in low quantity in the womb, low nutrients/energy in the womb changed the epigenome of the organism, and so when (if) the organism is exposed to an environment with ample amounts of food energy, they will then have a higher susceptibility to metabolic syndromes and weight gains, due to their uterine environment. (Diet also has an effect on brain plasticity in both animals and humans, in the womb and out of it; see Murphy, Dias, and Thuret, 2014.)
In sum, phenotypic plasticity, which is driven in part by epigenetics, was extremely important in our evolution. This epigenetic regulation that occurs in the womb prepared the individual in question to be able to respond to the energy imbalance of the environment the organism was born in. The plasticity of humans, and animals, in regard to what occurs (or does not occur) in the environment, is how we were able to survive in new environments (not ancestral to our species). Epigenetic changes that occur in the grandparental and parental generations, when not completely erased during the meiotic division of cells, can affect future generations of progeny in a negative way.
The implications of the data are clear: under-nutrition (and malnutrition) affect the genome and epigenome in ways that are inherited through the generations, which is due to the physical plasticity of the human in-utero as well as post-birth when the baby developing. These epigenetic changes then lead to the one who experienced the adverse uterine environment to have a higher chance of becoming obese later in life, which suggests that this is an adaptive response to low amounts of nutrients/caloric energy in the uterine environment.
Nutrition and Antisocial Behavior
2150 words
What is the relationship between nutrition and antisocial behavior? Does not consuming adequate amounts of vitamins and minerals lead to an increased risk for antisocial behavior? If it does, then lower class people will have commit crimes at a higher rate, and part of the problem may indeed be dietary. Though, what kind of data is there that lends credence to the idea? It is well-known that malnutrition leads to antisocial behavior, but what kind of effect does it have on the populace as a whole?
About 85 percent of Americans lack essential vitamins and minerals. Though, when most people think of the word ‘malnutrition’ and the imagery it brings along with it, they assume that someone in a third-world country is being talked about, say a rail-thin kid somewhere in Africa who is extremely malnourished due to lack of kcal and vitamins and minerals. However, just because one lives in a first-world country and has access to kcal to where they’re “not hungry” doesn’t mean that vitamin and mineral deficiencies do not exist in these countries. This is known as “hidden hunger” when people can get enough kcal for their daily energy needs but what they are eating is lower-quality food, and thus, they become vitamin and nutrient deficient. What kind of effects does this have?
Infants are most at risk, more than half of American babies are at-risk for malnutrition; malnutrition in the postnatal years can lead to antisocial behavior and a lower ‘IQ’ (Galler and Ramsey, 1989; Liu et al, 2003; Galler et al, 2011, 2012a, 2012b; Gesch, 2013; Kuratko et al, 2013; Raine et al, 2015; Thompson et al, 2017). Clearly, not getting pertinent vitamins and minerals at critical times of development for infants leads to antisocial behavior in the future. These cases, though, can be prevented with a good diet. But the preventative measures that can prevent some of this behavior has been demonized for the past 50 or so years.
Poor nutrition leads to the development of childhood behavior problems. As seen in rat studies, for example, lack of dietary protein leads to aggressive behavior while rats who are protein-deficient in the womb show altered locomotor activity. The same is also seen with vitamins and minerals; monkeys and rats who were fed a diet low in tryptophan were reported to be more aggressive whereas those that were fed high amounts of tryptophan were calmer. Since tryptophan is one of the building blocks of serotonin and serotonin regulates mood, we can logically state that diets low in tryptophan may lead to higher levels of aggressive behavior. The role of omega 3 fatty acids are mixed, with omega 3 supplementation showing a difference for girls, but not boys (see Itomura et al, 2005). So, animal and human correlational studies and human intervention studies lend credence to the hypothesis that malnutrition in the womb and after birth leads to antisocial behavior (Liu and Raine, 2004).
We also have data from one randomized, placebo-controlled trial showing the effect of diet and nutrition on antisocial behavior (Gesch et al, 2002). They state that since there is evidence that offenders’ diets are lacking in pertinent vitamins and minerals, they should test whether or not the introduction of physiologically adequate vitamins, minerals and essential fatty acids (EFAs) would have an effect on the behavior of the inmates. They undertook an experimental, double-blind, placebo-controlled randomized trial on 231 adult prisoners and then compared their write-ups before and after nutritional intervention. The vitamin/mineral supplement contained 44 mg of DHA (omega 3 fatty acid docosahexaenoic acid; plays a key role in enhancing brain structure and function, stimulating neurite outgrowth), 80 mg of EPA (eicosapentaenoic acid; n3), and 1.26 g of ALA (alpha-linolenic acid), 1260mg of LA (linolic acid), and 160mg of GLA (gamma-Linolenic acid, n6) and a vegetable oil placebo. (Also see Hibbeln and Gow, 2015 for more information on n3 and nutrient deficits in childhood behavior disorders and neurodevelopment.)
Raine (2014: 218-219) writes:
We can also link micronutrients to specific brain structures involved in violence. The amygdala and hippocampus, which are impaired in offenders, are packed with zinc-containing neurons. Zinc deficiency in humans during pregnancy can in turn impair DNA, RNA, and protein synthesis during brain development—the building blocks of brain chemistry—and may result in very early brain abnormalities. Zinc also plays a role in building up fatty acids, which, as we have seen, are crucial for brain structure and function.
Gesch et al (2002) found pretty interesting results: those who were given the capsules with vitamins, minerals, and EFAs had 26.3 percent fewer offenses than those who got the placebo. Further, when compared with the baseline, when taking the supplement for two weeks, there was an average 35.1 percent reduction in offenses compared to the placebo group who showed little change. Gesch et al (2002) conclude:
Antisocial behaviour in prisons, including violence, are reduced by prisons, are reduced by vitamins, minerals and essential fatty acids with similar implications for those eating poor diets in the community.
Of course one could argue that these results would not transfer over to the general population, but to a critique like this, the observed effect of behavior is physiological; so by supplementing the prisoners’ diets giving them pertinent vitamins, minerals and EFAs, violence and antisocial behavior decreased, which shows some level of causation between nutrition/nutrient/fatty acid deprivation and antisocial behavior and violent activity.
Gesch et al (2002) found that some prisoners did not know how to construct a healthy diet nor did they know what vitamins were. So, naturally, since some prisoners didn’t know how to construct diets with an adequate amount of EFAs, vitamins and minerals, they were malnourished, though they consumed an adequate amount of calories. The intervention showed that EFA, vitamin and mineral deficiency has a causal effect on decreasing antisocial and violent behavior in those deficient. So giving them physiological doses lowered antisocial behavior, and since it was an RCT, social and ethnic factors on behavior were avoided.
Of course (and this shouldn’t need to be said), I am not making the claim that differences in nutrition explain all variance in antisocial and violent behavior. The fact of the matter is, this is causal evidence that lack of vitamin, mineral and EFA consumption has some causal effect on antisocial behavior and violent tendencies.
Schoenthaler et al (1996) also showed how correcting low values of vitamins and minerals in those deficient led to a reduction in violence among juvenile delinquents. Though it has a small n, the results are promising. (Also see Zaalberg et al, 2010.) These simple studies show how easy it is to lower antisocial and violent behavior: those deficient in nutrients just need to take some vitamins and eat higher-quality food and there should be a reduction in antisocial and violent behavior.
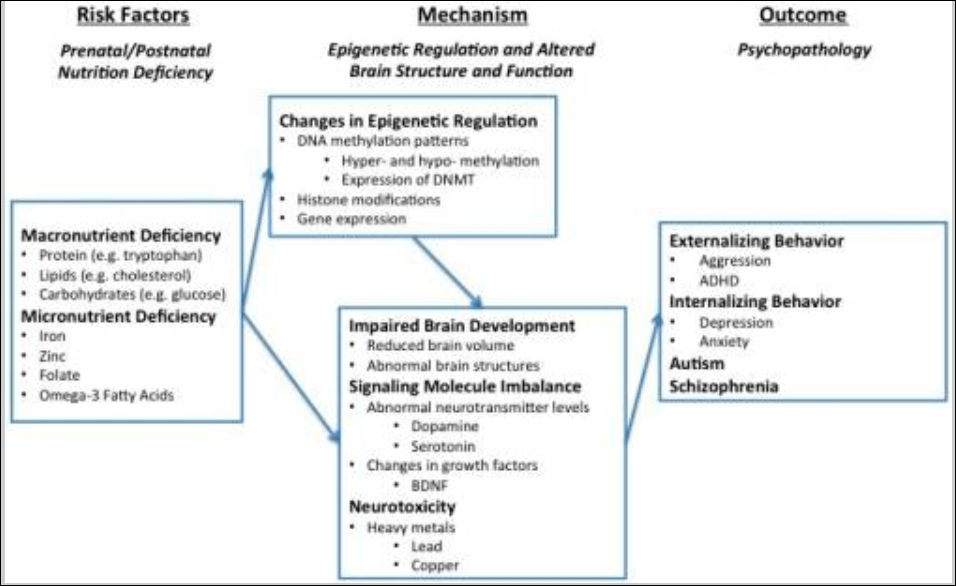
Liu, Zhao, and Reyes (2015) propose “a conceptual framework whereby epigenetic modifications (e.g., DNA methylation) mediate the link between micro- and macro-nutrient deficiency early in life and brain dysfunction (e.g., structural aberration, neurotransmitter perturbation), which has been linked to development of behavior problems later on in life.” Their model is as follows: macro- and micro-nutrient deficiencies are risk-factors for psychopathologies since they can lead to changes in the epigenetic regulation of the genome (along with other environmental variables such as lead consumption, which causes abnormal behavior and also epigenetic changes which can be passed through the generations; Senut et al, 2012; Sen et al, 2015) which then leads to impaired brain development, which then leads to externalizing behavior, internalizing behavior and autism and schizophrenia (two disorders which are also affected by the microbiome; Strati et al, 2017; Dickerson, 2017).
Clearly, since the food we eat gives us access to certain fatty acids that cannot be produced de novo in the brain or body, good nutrition is needed for a developing brain and if certain pertinent vitamins, minerals or fatty acids are missing, negative outcomes could occur for said individual in the future due to lack of brain development from being nutrient, vitamin, and mineral deficient in childhood. Further, interactions between nutrient deficiencies and exposure to toxic chemicals may be a cause of a large amount of antisocial behavior (Walsh et al, 1997; Hubbs-Tait et al, 2005; Firth et al, 2017).
Looking for a cause for this interaction between metal consumption and nutrient deficiencies, Liu, Zhao, and Reyes (2015) state that since protein and fatty acids are essential to brain growth, lack of consumption of pertinent micro- and macro-nutrients along with consumption of high amounts of protein both in and out of the womb contribute to lack of brain growth and, at adulthood, explains part of the difference in antisocial behavior. What you can further see from the above studies is that metals consumed by an individual can interact with the nutrient deficiencies in said individual and cause more deleterious outcomes, since, for example, lead is a nutrient antagonist—that is, it inhibits the physiologic actions of whatever bioavailable nutrients are available to the body for us.
Good nutrition is, of course, imperative since it gives our bodies what it needs to grow and develop as we grow in the womb, as adolescents and even into old age. So, therefore, developing people who are nutrient deficient will have worse behavioral outcomes. Further, lower class people are more likely to be nutrient deficient and consume lower quality diets than higher, more affluent classes, though it’s hard to discover which way the causation goes (Darmon and Drewnowski, 2008). Of course, the logical conclusion is that being deficient in vitamins, minerals and EFAs causes changes to the epigenome and retards brain development, therefore this has a partly causal effect on future antisocial, violent and criminal behavior. So, some of the crime difference between classes can be attributed to differences in nutrition/toxic metal exposure that induces epigenetic changes that change the structure of the brain and doesn’t allow full brain development due to lack of vitamins, minerals, and EFAs.
There seems to be a causal effect on criminal, violent and antisocial behavior regarding nutrient deficiencies in both juveniles and adults (which starts in the womb and continues into adolescence and adulthood). However, it has been shown in a few randomized controlled trials that nutritional interventions decrease some antisocial behavior, with the effect being strongest for those individuals who showed worse nutrient deficiencies.
If the relationship between nutrition/interaction between nutrient deficiencies and toxins can be replicated successfully then this leads us to one major question: Are we, as a society, in part, causing some of the differences in crime due to how our society is regarding nutrition and the types of food that are advertised to our youth? Are people’s diets which lead to nutrient deficiencies a driving factor in causing crime? The evidence so far on nutrition and its effects on the epigenome and its effects on the growth of the brain in the womb and adolescence requires us to take a serious look at this relationship. That lower class people are exposed to more neurotoxins such as lead (Bellinger, 2008) and are more likely to be nutrient deficient (Darmon and Drewnowski, 2008; Hackman, Farrah, and Meaney, 2011) then if they were educated on which foods to eat to avoid nutrient deficiencies along with avoiding neurotoxins such as lead (which exacerbate nutrient deficiencies and cause crime), then a reduction in crime should occur.
Nutrition is important for all living beings; and as can be seen, those who are deficient in certain nutrients and have less access to good, whole, nutritious food (who also have an increased risk for exposure to neurotoxins) can lead to negative outcomes. These things can be prevented, it seems, with a few vitamins/minerals/EFA consumption. The effects of sleep, poor diet (which also lead to metabolic syndromes) can also exacerbate this relationship, between individuals and ethnicities. The relationship between violence and antisocial behavior and nutrient deficiencies/the interaction with nutrient deficiencies and neurotoxins is a great avenue for future research to reduce violent crime in our society. Lower class people, of course, should be the targets of such interventions since there seems to be a causal effect—-however small or large—on behavior, both violent and nonviolent—and so nutrition interventions should close some of the crime gaps between classes.
Conclusion
The logic is very simple: nutrition affects mood (Rao et al, 2008; Jacka, 2017) which is, in part, driven by the microbiome’s intimate relationship with the brain (Clapp et al, 2017; Singh et al, 2017); nutrition also affects the epigenome and the growth and structure of the brain if vitamin and mineral needs are not met by the growing body. This then leads to differences in gene expression due to the foods consumed, the microbiome (which also influences the epigenome) further leads to differences in gene expression and behavior since the two are intimately linked as well. Thus, the aetiology of certain behaviors may come down to nutrient deficiencies and complex interactions between the environment, neurotoxins, nutrient deficiencies and genetic factors. Clearly, we can prevent this with preventative nutritional education, and since lower class people are more likely to suffer the most from these problems, the measures targeted to them, if followed through, will lower incidences of crime and antisocial/violent behavior.
Is Diet An IQ Test?
1350 words
Dr. James Thompson is a big proponent of ‘diet being an IQ test‘ and has written quite a few articles on this matter. Though, the one he published today is perhaps the most misinformed.
He first shortly discusses the fact that 200 kcal drinks are being marketed as ‘cures’ for type II diabetes. People ‘beat’ the disease with only 200 kcal drinks. Sure, they lost weight, lost their disease. Now what? Continue drinking the drinks or now go back to old dietary habits? Type II diabetes is a lifestyle disease, and so can be ameliorated with lifestyle interventions. Though, Big Pharma wants you to believe that you can only overcome the disease with their medicines and ‘treatments’ along with the injection of insulin from your primary care doctor. Though, this would only exacerbate the disease, not cure it. The fact of the matter is this: these ‘treatments’ only ‘cure’ the proximate causes. The ULTIMATE CAUSES are left alone and this is why people fall back into habits.
When speaking about diabetes and obesity, this is a very important distinction to make. Most doctors, when treating diabetics, only treat the proximate causes (weight, symptoms that come with weight, etc) but they never get to the root of the problem. The root of the problem is, of course, insulin. The main root is never taken care of, only the proximate causes are ‘cured’ through interventions, however, the underlying cause of diabetes, and obesity as well is not taken care of because of doctors. This, then, leads to a neverending cycle of people losing a few pounds or whatnot and then they, expectedly, gain it back and they have to re-do the regimen all over again. The patient never gets cured, Big Pharma, hospitals et al get to make money off not curing a patients illness by only treating proximate and not ultimate causes.
Dr. Thompson then talks about a drink for anorexics, called ‘Complan“, and that he and another researcher gave this drink to anorexics, giving them about 3000 kcals per day of the drink, which was full of carbs, fat and vitamins and minerals (Bhanji and Thompson, 1974).
The total daily calorific intake was 2000-3000 calories, resulting in a mean weight gain of 12.39 kilos over 53 days, a daily gain of 234 grams, or 1.64 kilos (3.6 pounds) a week. That is in fact a reasonable estimate of the weight gains made by a totally sedentary person who eats a 3000 calorie diet. For a higher amount of calories, adjust upwards. Thermodynamics.
Thermodynamics? Take the first law. The first law of thermodynamics is irrelevant to human physiology (Taubes, 2007; Taubes, 2011; Fung, 2016). (Also watch Gary Taubes explain the laws of thermodynamics.) Now take the second law of thermodynamics which “states that the total entropy can never decrease over time for an isolated system, that is, a system in which neither energy nor matter can enter nor leave.” People may say that ‘a calorie is a calorie’ therefore it doesn’t matter whether all of your calories come from, say, sugar or a balanced high fat low carb diet, all weight gain or loss will be the same. Here’s the thing about that: it is fallacious. Stating that ‘a calorie is a calorie’ violates the second law of thermodynamics (Feinman and Fine, 2004). They write:
The second law of thermodynamics says that variation of efficiency for different metabolic pathways is to be expected. Thus, ironically the dictum that a “calorie is a calorie” violates the second law of thermodynamics, as a matter of principle.
So talk of thermodynamics when talking about the human physiological system does not make sense.
He then cites a new paper from Lean et al (2017) on weight management and type II diabetes. The authors write that “Type 2 diabetes is a chronic disorder that requires lifelong treatment. We aimed to assess whether intensive weight management within routine primary care would achieve remission of type 2 diabetes.” To which Dr. Thompson asks ‘How does one catch this illness?” and ‘Is there some vaccination against this “chronic disorder”?‘ The answer to how does one ‘catch this illness’ is simple: the overconsumption of processed carbohydrates, constantly spiking insulin which leads to insulin resistance which then leads to the production of more insulin since the body is resistant which then causes a vicious cycle and eventually insulin resistance occurs along with type II diabetes.
Dr. Thompson writes:
Patients had been put on Complan, or its equivalent, to break them from the bad habits of their habitual fattening diet. This is good news, and I am in favour of it. What irritates me is the evasion contained in this story, in that it does not mention that the “illness” of type 2 diabetes is merely a consequence of eating too much and becoming fat. What should the headline have been?
Trial shows that fat people who eat less become slimmer and healthier.
I hope this wonder treatment receives lots of publicity. If you wish to avoid hurting anyone’s feelings just don’t mention fatness. In extremis, you may talk about body fat around vital organs, but keep it brief, and generally evasive.
So you ‘break bad habits’ by introducing new bad habits? It’s not sustainable to drink these low kcal drinks and expect to be healthy. I hope this ‘wonder treatment’ does not receive a lot of publicity because it’s bullshit that will just line the pockets of Big Pharma et al, while making people sicker and, the ultimate goal, having them ‘need’ Big Pharma to care for their illness—when they can just as easily care for it themselves.
‘Trial shows that fat people who eat less become slimmer and healthier’. Or how about this? Fat people that eat well and exercise, up to 35 BMI, have no higher risk of early death then someone with a normal BMI who eats well and exercises (Barry et al, 2014). Neuroscientist Dr. Sandra Aamodt also compiles a wealth of solid information on this subject in her 2016 book “Why Diets Make Us Fat: The Unintended Consequences of Our Obsession with Weight Loss“.
Dr. Thompson writes:
I see little need to update the broad conclusion: if you want to lose weight you should eat less.
This is horrible advice. Most diets fail, and they fail because the ‘cures’ (eat less, move more; Caloric Reduction as Primary: CRaP) are garbage and don’t take human physiology into account. If you want to lose weight and put your diabetes into remission, then you must eat a low-carb (low carb or ketogenic, doesn’t matter) diet (Westman et al, 2008; Azar, Beydoun, and Albadri, 2016; Noakes and Windt, 2016; Saslow et al, 2017). Combine this with an intermittent fasting plan as pushed by Dr. Jason Fung, and you have a recipe to beat diabesity (diabetes and obesity) that does not involve lining the pockets of Big Pharma, nor does it involve one sacrificing their health for ‘quick-fix’ diet plans that never work.
In sum, diets are not ‘IQ tests’. Low kcal ‘drinks’ to ‘change habits’ of type II diabetics will eventually exacerbate the problem because when the body is in extended caloric restriction, the brain panics and releases hormones to stimulate appetite while stopping hormones that cause you to be sated and stop eating. This is reality; these studies that show that eating or drinking 800 kcal per day or whatnot are based on huge flaws: the fact that this could be sustainable for a large number of the population is not true. In fact, no matter how much ‘willpower’ you have, you will eventually give in because willpower is a finite resource (Mann, 2014).
There are easier ways to lose weight and combat diabetes, and it doesn’t involve handing money over to Big Pharma/Big Food. You only need to intermittently fast, you’ll lose weight and your diabetes will not be a problem, you’ll be able to lose weight and will not have problems with diabetes any longer (Fung, 2016). Most of these papers coming out recently on this disease are garbage. Real interventions exist, they’re easier and you don’t need to line the pockets of corporations to ‘get cured’ (which never happens, they don’t want to cure you!)
No, Soy Doesn’t Feminize Males
1400 words
There are a few things I constantly see around the Internet that really irk me. One of those things is the meme that soy causes feminization in males. Some people may see a picture of a guy with soft facial features and they’ll say ‘oh that’s a soy boy.’ They do not show a good understanding of soy and its chemicals. As usual, overblown claims from people who have no specialty in what they’re talking about have an answer—just one they do not want to hear.
I have no idea when this craze of blaming soy and other foods on ‘feminization of males’ (I have done so a few years ago, though I realize my error now), but it’s starting to get out of hand. I see this around Twitter a lot; ‘oh it’s the soy making men beta’ or ‘they know exactly what soy does to men and they still push it!’. The whole scare about soy is that soy has phytoestrogens called isoflavones, and these phytoestrogens then may mimic estrogen production in the body. (It’s worth noting that phytoestrogens do not always mimic estrogens, despite some people’s protesting to me that “It has estrogen right in the name!”.)
Many men have blamed soy and phytoestrogens/isoflavones on their growing breasts, having a flaccid penis, slow beard growth (that’d be enough motivation for me to do something about it, to be honest), loss of hair on his arms and legs, and, he says “Men aren’t supposed to have breasts … It was like my body is feminizing.” So this man went to an endocrinologist and was told that he had gynecomastia—enlarged breasts in men. He got tested for a whole slew of maladies, but they all came back negative. Then the doctor told him to be very specific with his diet. The man then said that he was lactose intolerant and that he drank soy milk instead of cow’s milk. The doctor then asked him how much soy milk he drank per day, to which the man responded 3 quarts. Was soy the cause of his gynecomastia and other negative health effects? I don’t think so.
For men and boys, soy does not seem to have an effect on estrogen and other hormone levels, nor does it seem to have an effect on development and fertility:
A handful of individuals and organizations have taken an anti-soy position and have questioned the safety of soy products. In general, this position latches to statistically insignificant findings, understates how powerfully the research refutes many of the main anti-soy points, and relies heavily on animal research studies, which are medically irrelevant to human health.
Most of those people are ‘activists’ who do not understand the intricacies of what they are talking about. In the field of nutrition, it’s dumb to take studies done on animals nd then extrapolate that data to humans. It does not make sense.
There are reasons not to eat soy that do not go along with this dumb hysteria from people who do not know what they are talking about. One reasons is that, when compared to casein protein, soy protein is inferior (Luiking et al, 2005). Further, data is “inconsistent or inadequate in supporting most of the suggested health benefits of consuming soy protein or ISF” (Xiao, 2008). People may cite studies like Lephart et al (2002) where they write in their article Neurobehavioral effects of dietary soy estrogens:
Whether these observations hold true for the human brain remains to be established and will only become apparent from long-term clinical studies. One point that needs clarification relates to the timing of brain development in the rat, which differs from that in the human. (pg. 12)
Rats and humans are different; I don’t think I need to say that. Though people who cite these studies (uncritically) as ‘evidence’ that soy lowers T, causes infertility problems, and feminization just look to grab anything that affirms their fearmongering views.
Jargin (2014) writes in his article Soy and phytoestrogens: possible side effects:
Feminizing effect of phytoestrogens and soy products may be subtle, detectable only statistically in large populations; it can be of particular importance for children and adolescents. This matter should be clarified by independent research, which can have implications for the future of soy in the agriculture.
If it’s only identifiable in statistically large populations, then it is meaningless. Though, East Asians seem to be adapted to soy and so (like all studies should note), these results should not be extrapolated to other races/ethnies (Jargin, 2014). I do agree with that assessment; I do not agree with the claim that these phytoestrogens would cause problems that would only be seen in statistically large populations.
If people want to use rat studies to show that soy supposedly raises estrogen levels, then I will use a rat study showing the opposite (Song, Hendrich, and Murphy, 1999). They showed that the effects of the isoflavones from soy were only weakly estrogenic. Further, Mitchell et al (2001) write in their article Effect of a phytoestrogen food supplement on reproductive health in normal males:
The phytoestrogen supplement increased plasma genistein and daidzein
concentrations to approx. 1 µM and 0.5 µM respectively; yet, there was no observable effect on endocrine measurements, testicular volume or semen parameters over the study period. This is the first study to examine the effects of a phytoestrogen supplement on reproductive health in males. We conclude that the phytoestrogen dose consumed had no effect on semen quality.
The men in this study took a daily isoflavone supplement containing 40 mg of isoflavone every day for two months and still did not show negative effects. Looking at rat studies and then extrapolating that to humans doesn’t make sense.
Finally, there was a large meta-analysis by Messina (2010) who writes:
The intervention data indicate that isoflavones do not exert feminizing effects on men at intake levels equal to and even considerably higher than are typical for Asian males.
And from the conclusion:
Isoflavone exposure at levels even greatly exceeding reasonable dietary intakes does not affect blood T or estrogen levels in men or sperm and semen parameters. The ED-related findings in rats can be attributed to excessive isoflavone exposure and to differences in isoflavone metabolism between rodents and humans. Thus, men can feel confident that making soy a part of their diet will not compromise their virility or reproductive health.
Now, I know that proponents of the hypothesis of soy feminizing males would say to me “Why don’t you just eat a bunch of soy and see what happens then, if it is fine for you?” Well, unlike most people, I eat a strict diet and soy is not part of it.
Soy isoflavones are currently being researched in regards to the prevention and treatment of diabetes, cardiovascular disease, cancer, osteoporosis, and neuroprotection (Kalaiselven et al, 2010), while the nutritional and health benefits of soy isoflavones are currently being studied (Friedman and Brandon, 2001; McCue and Shetty, 2004). Soy foods may also be optimal for bone health (Lanou, 2011).
In conclusion, as you can see, the claims of soy causing feminizing effects on men are largely overblown. People extrapolate data from rat studies to humans, which doesn’t make any sense. To paraphrase Dr. Jason Fung, imagine 2 lions are watching a deer eat. They see how strong and in shape the deer are eating grass. So the lions, noticing that the deer are healthy eating grass, begin to eat grass too thinking it is healthy and they die. One hundred years later, 2 deer are watching a lion eat meat and sees how strong, fast, and healthy it is. They then draw the conclusion that eating meat is healthy and will do the same for them and they eat meat and die. The point of the analogy is that just because studies on animals show X and therefore Y, that does not mean that it will hold for humans! This is something very simple for people to understand, though most do not.
Most people search for things to prove their assumptions without having an actual understanding of the biological mechanisms of what they’re talking about. People should learn some of the literature before they cite studies that supposedly back their biases, because they would then see that it is not as nuanced as they believe.
(Note: Diet changing under Doctor’s supervision only.)
The West’s Testosterone Decline
1850 words
The tone of this article may be slightly different than the rest. I hate when people make idiotic, rash judgments on things that they really do not understand.
People are dumb. There is nothing wrong with that, but when those dumb people discover some science, they then misinterpret the article and twist and turn it to fit a political agenda, all the while having absolutely no idea at all about the actual study nor knowing anything about the hormone testosterone! Due to this, you get some cringey articles from the alt-right because they are too ignorant to actually read something without their ideological blinders on.
The study I will be reviewing was on testosterone, which established new levels for nonobese American and European men. The problem is that the new levels are lower than the previous levels; uneducated and biased morons think that means that they (the government) are trying to feminize men and thus they—on their own—lowered testosterone levels themselves. …this is dumb. Like, really really dumb.
Over 9,000 nonobese American and European men were assayed for a harmonized normal range in males; Travison et al, (2017) used the results from a local assay which was sent to the CDC where “testosterone concentrations were measured using a higher order liquid chromatography tandem mass spectrometry method.” Then, Travison et al (2017) used the results from both tests (the local sample and CDC sample) to create a ‘harmonized reference range’ which were then used to generate the age-specific reference ranges across the whole cohort. Using this method, they discovered that the range for testosterone for nonobese males aged 19-39 was between 264-916 ng/ml.
Now, people who don’t understand why this study was done (to see the range of testosterone in men to see the actual range) would say ‘aha! They are trying to lower testosterone and feminize men!”, like the retards Chateau Heartiste and ‘Zeiger‘ from the Daily Stormer. I won’t cover the article from Heartiste (because there’s nothing of substance there to talk about, just some inane drivel), so I’ll cover ‘Zeiger’s’ main points.
The feds have started a process to lower the official “standard” levels of testosterone in men, presumably in an effort to solve the grave “toxic masculinity” problem we’ve got going on here in America.
No. No one has ‘started a process to lower’ the levels of testosterone in America. You do not understand science, so why the hell are you talking about it?
The problem here is that it’s basically a hoax study.
….is this guy a retard? How is this a ‘hoax study’?
The blood samples were obtained not from healthy, athletic males, but from males who were already the subjects of other medical studies. In other words, they were largely composed of ordinary people who ate crappy standard diets, lived sedentary lifestyles, drank water loaded with chemicals, and who are exposed to a whole bunch of estrogen-mimicking chemicals.
….you mean the average man in America? You think they should control for weight, when the average man in America is obese/overweight? Why control for all of those variables when you’re attempting to see what the range is in a large cohort to get a better idea of what the actual range is in men so that they could better diagnose low testosterone and any other maladies involved with it? This study was done to establish the range for the average American and European male, not one who is athletic, low body fat, etc. You’d need to actually understand why the study was undertaken to get that, though.
Now, this new, much lower range of what is considered “normal” testosterone levels is becoming the standard pushed by the CDC (Center for Disease Control) and applied by the various private testing organizations.
You don’t even understand why this ‘new, much lower range’ is considered ‘normal’ and why it’s ‘becoming the standard pushed by the CDC’ and ‘applied by the various private testing corporations’. Because that is the new range for nonobese American and European males aged 19-39!
The old reference range comes from the Framingham Heart Study in which men aged 19-40 were assayed (Bhalin et al, 2011; assays were done in the morning after an overnight fast so I have no problem with this). ‘Zeiger’ writes:
The old standard was based on actual healthy males. Now they’ve dropped the standard to “non-obese.” As a rule, the fatter someone is, the lower their testosterone. This means that the broadening of the criteria for “healthy” to include men who are pretty fat, but short of “obese” will certainly lead to a lower average testosterone level.
Did you know that in the old reference sample (Bhalin et al, 2011), the average BMI of the whole cohort aged 19-39 was 25.2 (average age 32.7)? For men with an average age of 33.3, they had a BMI of 27.4 and men aged 40 had BMI 28 (see table 1; Bhalin et al, 2011). I don’t take BMI as a predictor of health (indeed men with a 27 BMI had a lower risk of mortality than men in other BMI categories), but it is a predictor of testosterone levels. ‘Lean males’ are not between BMI 25 and 28; unless they were testing some IFBB pros, which I know they did not. So they values were similar. He wouldn’t know that though because he’s clueless to the literature.
For one, it makes it a lot harder to get testosterone hormones prescribed to you by a doctor, since your T levels need to be absolutely rock bottom in order to be considered “deficient.”
No, retard. If you’re feeling lethargic, have low energy, low sex drive, etc, then you will be assayed and compared against the new harmonized values. If you’re teetering on the low-end of the normal range variation, then you will get some TRT (testosterone replacement therapy). You’ve never worked with people with low testosterone, so shut the fuck up.
In addition, if this process continues, you could start seeing men with healthy testosterone begin to be seen as “pathological” because their levels are “too high” compared with the new standard. So power-lifters who watch their diets could start being prescribed drugs to lower their T levels.
This is dumb. If I get prescribed drugs to lower my testosterone levels, I’ll be sure to let my readers know (I compete and watch my diet) and my levels are above average for my age.
All of this is based on an obviously flawed methodology.
No, it isn’t. You don’t understand the methodology because you don’t understand science and you don’t understand testosterone.
It’s a transparent push to feminize men and normalize being a low-T faggot.
Nice appeal to emotion at the end there. You don’t understand science so you don’t understand the methodology so this lets you use the new study to support your biases. I strongly recommend that you do some heavy reading into this because you don’t know shit about this matter.
Ten years ago, Travison et al (2007) observed that there was a substantial “and as yet unrecognized, age-independent population-level decrease in T in American men, potentially attributable to birth cohort differences or to health or environmental effects not captured in observed data.” Testosterone levels have declined in America, independent of chronological aging. (See Nyante et al, 2007 for contrary view, they state that there is no decrease in testosterone, also see table 4 which shows that blacks had higher levels than whites, with whites having 5.28 ng/ml and blacks having 5.9 ng/ml for an 11 percent difference. Using previous NHANES data, Nyante et al, 2007 showed that the levels in whites were 5.38 while in blacks it was 5.28 for a .05 percent difference. Nevertheless, this is more evidence for the honor culture hypothesis (Mazur, 2016) which shows why low-income blacks have higher levels of testosterone than better-educated blacks of the same age range.)
Further, a substantial proportion of the intercohort variation was due to assay differences, i.e., saliva, blood, etc (Travison et al, 2017). Further, Travison et al (2017) tested men with BMIs less than 30, the same as Bhalin et al (2011) which was the old reference. But people need to read the actual studies cited to get the truth, and not just speak from emotion (ironic…) about something that they literally have no clue about. Also, read the LabCorp statement on this matter.
Yes, we do have a testosterone decline in the West, and no, it is not due to any nefarious plot to lower testosterone levels or feminize men; if people knew how to read scientific papers then I wouldn’t have to write this article in the tone that I did, but alas you can’t have everything you want in life.
I did write in the past that the testosterone decline in the West is the cause of our fertility problems (this article compliments the linked article), and to higher fertility rates in the West, testosterone levels must also be raised. People who have no idea about how and why studies are carried out shouldn’t talk about them. People who do not understand what they are talking about should not talk about them. Recall that I blasted Heartiste’s Big Food Shilling a few months back, and I also did the same last month rebutting the article that ‘Man ‘originated’ in Europe‘. These people clearly have no understanding of science and quickly latch on to anything that will affirm their worldviews without having the actual knowledge to assess what they are talking about.
I hope that Heartiste and Zeiger actually educate themselves on the matters they write about, because this is just embarrassing and shows no understanding of science or of the hormone testosterone. There is a lot of bullshit floating around out there, mostly from uneducated morons who don’t know a thing about what they are writing about, it just conforms to their worldview and they will thusly write about it all the while being ignorant to the reality of the matter. I wish ideologues would stop writing about things that are not educated in. Alas, I don’t think that will happen anytime soon because people have an agenda to push, science be damned (which is ironic because these same people get on the Left for doing the same. . .).
This is a serious problem, as I have noted before, so to change this, change diet to whole foods, get more exercise, stop drinking from plastic water bottles; you need to shape your own environment in order to have higher testosterone levels; I have extensively documented that testosterone increases or decreases based on a ton of environmental factors. That we are experiencing a large decline in testosterone here in the West shows that we are not as active, we are eating shitty food, and men are not being as dominant as they were in the past.
So yes, in two days time the testosterone reference range for men in America and Europe will be between 264 to 916 ng/ml, and no it is not due to them, this is the actual level in nonobese men. People need to stop the fear mongering bullshit and people need to stop talking about shit that they literally have no understanding of.
Rebutting Heartiste on the Twinkie Diet
1300 words
Nutritional myths run amok everywhere. One of the most persistent is that ‘a calorie is a calorie’, that is, every macronutrient will be processed the same by the body. Another assumption is that the body doesn’t ‘care’ about where the calories come from—they can come from fat, protein, or carbs and the response will be the same: bodyweight will be reduced until one reaches their goal. However, it’s not as simple as that. He also has the assumption that “diets work”, when the best meta-analysis I know of on the matter shows the opposite (Mann et al, 2007, see especially table 1). They control for studies where weight was self-reported. They conclude that dieting does not work. This is what, as Heartiste says, “iScience!” says on the matter, so he should believe everything I state in this article, which is backed by “iScience!”.
Chateau Heartiste published an article back in 2010 titled The Twinkies Diet Proves Fatty Fats Are Fat Because They Eat Too Much. He is referring to professor of human nutrition Mark Haub and his success on ‘the twinkies diet’, where 2/3rds of his caloric intake came from junk food such as Twinkies. He lost 27 pounds in a two month period while his LDL cholesterol decreased by 20 percent and his HDL cholesterol increased by 20 percent. His level of triglycerides also decreased by 37 percent, with his body fat decreasing from 33.4 to 24.9 percent. So he ate 1800 kcal per day—2/3rds of it being junk food—for two months and lost 27 pounds. Case closed, right? Eat junk food at a deficit and lose weight? A calorie is a calorie? There are a few problems with this contention which will be addressed below.
Heartiste writes:
Big bottom line: Being fat itself is bad for your health. “Fat and fit” is a myth. The change that counts the most is losing the weight, which can only be done by PUSHING AWAY FROM THE TABLE.
Except fit and overweight and obese individuals have similar mortality rates than their normal weight counterparts (Barry et al, 2014). However, more recently a study was published purporting that overweight and obese individuals being healthy despite excess weight is a myth. The researchers state that in a sample of millions of Britons that overweight and obese individuals had a higher risk of heart disease than their normal-weight counterparts. Unfortunately, I cannot locate the study since it wasn’t published in a journal (and thusly not peer reviewed). I wonder if variables such as diet, smoking and other lifestyle factors were taken into account. Nevertheless, the debate on fitness and fatness continues.
Another large meta-analysis shows that grade 1 obesity (BMI 30->35) had the same mortality risk as normal-weight individuals with grade 2 obese (BMI +35) having a significantly higher risk of death (Flegal, Kit, and Orpana, 2013).
Heartiste claims that ‘a calorie is a calorie’. This is a common fallacy. This suggests that the body will process all foods the same way—that is, processing them the same metabolically. This, however, is not the case. Haub himself is a sample size of 1. If Heartiste can use a sample size of 1 to make a claim, then I can too.
Sam Feltham ate +5,000 kcal per day for 21 days and only gained 1.3 kg when he should have gained 7.3 kg based on the amount of kcal he ate. A calorie is a calorie, right? This is a fallacious statement. The statement “a calorie is a calorie” violates the second law of thermodynamics (Feinman and Fine, 2004). Heartiste writes:
That first law of thermodynamics looms large over everything.
The first law of thermodynamics is irrelevant to human physiology. It only states that an organism gets bigger if it consumes more energy; it doesn’t state why this occurs, which is due to the hormone insulin which causes weight gain.
He does rightly state that an omega 3/6 imbalance is part of the reason but then handwaves it away. Western-like high-fat diets (i.e., diets with an imbalance of linoleic acids (LA; and n-6 fatty acid) with n-3) are sufficient enough to induce gradual enhancement in fat mass across the generations (Massiera et al, 2010). This obviously includes the average 55 percent carbohydrate diet that the AHA recommends (Eckel et al, 2014). The Standard American Diet (aptly named the “SAD diet”) has the n-3/n-6 imbalance along with being high in carbohydrates which spike insulin which impedes fat being unlocked from the adipocyte.
Heartiste doesn’t understand that if you reduce the ‘in’, the ‘out’ also decreases. This was noted in the famous starvation experiment headed by Ancel Keys. They took 36 healthy men who ate normally for three months while being their behavior and personality was monitored. In the next six months, they were reduced to eating half of their initial intake (they started at 2000 kcal and dropped to 1000 kcal; some individuals going lower than that) and their metabolic rate decreased by 40 percent (Keys et al, 1945). This is proof for the contention that the body decreases its metabolic rate due to what is ingested. A similar study was done on Vermont prisoners, except they were told to gorge on food. Since they were in a controlled setting, the prisoners could be monitored to ensure they ate all of the food.
At the end of the study, their metabolic rates had increased by 50 percent. This is evidence that the body was trying to get back to its original weight. In six months, the prisoners went back to their normal weight as they ate normally (Salas, Horton, and Sims, 1971) One man only gained ten pounds eating all of those calories. Clearly, the body was resisting weight gain and when they were allowed to eat normally, they effortlessly regained their normal weights.
Finally, on the topic of Haub, Big Food shill, I will address a few things about him and his ‘research’ that recently came to light.
Intermittent fasting and obesity expert Dr. Jason Fung showed that in 2016 after Coca-Cola released their funding reports after criticisms of transparency, Mark Haub was found to be one of the many researchers that were backed by Coca-Cola. This is an attempt to show that ‘a calorie is a calorie’ and that ‘all calories are created equal’. This has been rebutted above.
In 2016—six years after his ‘experiment—it was revealed that he was funded by Coca-Cola. No doubt in order to ‘prove’ that ‘a calorie is a calorie’ and have people continue to gorge on high carbohydrate/insulinogenic foods. However, the human body is a lot more complex than to just reduce it to simply calories in and calories out—which I have written about in depth.
People like Heartiste need to get an actual understanding of the literature and what Coca-Cola has been trying to do for years, which is to make eating junk food ‘OK’ because ‘it doesn’t cause obesity’. Children consume 45 percent more food when exposed to advertisements (Harris, Bargh, and Brownell, 2009). So to begin to curb obesity rates we don’t need to ‘eat junk food’, we need to not eat junk food and eat a diet more ancestral to us—that is, one lower in processed carbs and higher in animal fat and protein. Big Food shills like Haub need to be exposed for what they are—people who do ‘research’ for a quick buck, i.e., not furthering our understanding of a complex issue as he would like you to believe. Exercise also doesn’t induce weight loss. So the claims of ‘eat less and move more’ (eat less according to the 55 percent carbohydrate recommendations) is bound to fail.
If Heartiste can make a claim using one man as an example then so can I. Read the above article by Sam Feltham in which he writes about hs experience eating 5,000 kcal per day for 21 days while only gaining 1.3 kg. I can use this example to say that eating low carb and high fat at 5,000 kcal per day will lead to negligible weight gain, however, I don’t use n=1 sample sizes to make claims and no one else should either.
Fatty Acids and PISA Math Performance
1800 words
There are much more interesting theories of the evolution of hominin intelligence other than the tiring (yawn) cold winter theory. Last month I wrote on why men are attracted to a low waist-to-hip ratio in women. However, the relationship between gluteofemoral fat (fat in the thighs and buttocks) is only part of the story on how DHA and fatty acids (FAs) drove our brain growth and our evolution as a whole. Tonight I will talk about how fatty acids predict ‘cognitive performance’ (it’s PISA, ugh) in a sample of 28 countries, particularly the positive relationship between n-3 (Omega-3s) and intelligence and the negative relationship between n-6 and intelligence. I will then talk about the traditional Standard American Diet (the SAD diet [apt name]) and how it affects American intelligence on a nation-wide level. Finally, I will talk about the best diet to maximize cognition in growing babes and women.
Lassek and Gaulin (2013) used the 2009 PISA data to infer cognitive abilities for 28 countries (ugh, I’d like to see a study like this done with actual IQ tests). They also searched for studies that showed data providing “maternal milk DHA DHA values as percentages of total fatty acids in 50 countries”. Further, to control for SES influences on cognitive performance, they controlled for GDP/PC (gross domestic product per country) and “educational expenditures per pupil.” They further controlled for the possible effect of macronutrients on maternal milk DHA levels, they included estimates for each country of the average amount of kcal consumed from protein, fat, and carbohydrates. To explore the relationship between DHA and cognitive ability, they included foodstuffs high in n-3—fish, eggs, poultry, red meat, and milk which also contain DPA depending on the type of feed the animal is given. There is also a ‘metabolic competition’ between n-3 and n-6 fatty acids, so they also included total animal and vegetable fat as well as vegetable oils.
Lassek and Gaulin (2013) found that GDP/PC, expenditures per student and DHA were significant predictors of (PISA) math scores, whereas macronutrient content showed no correlation.
The predictive value of milk DHA on cognitive ability is only weak when either two of the SES variables are added in the multiple regression. When milk arachidonic (a type of Omega-6 fatty acid) is added to the regression, it is negatively correlated with math scores but not significantly (so it wasn’t added to the table below).
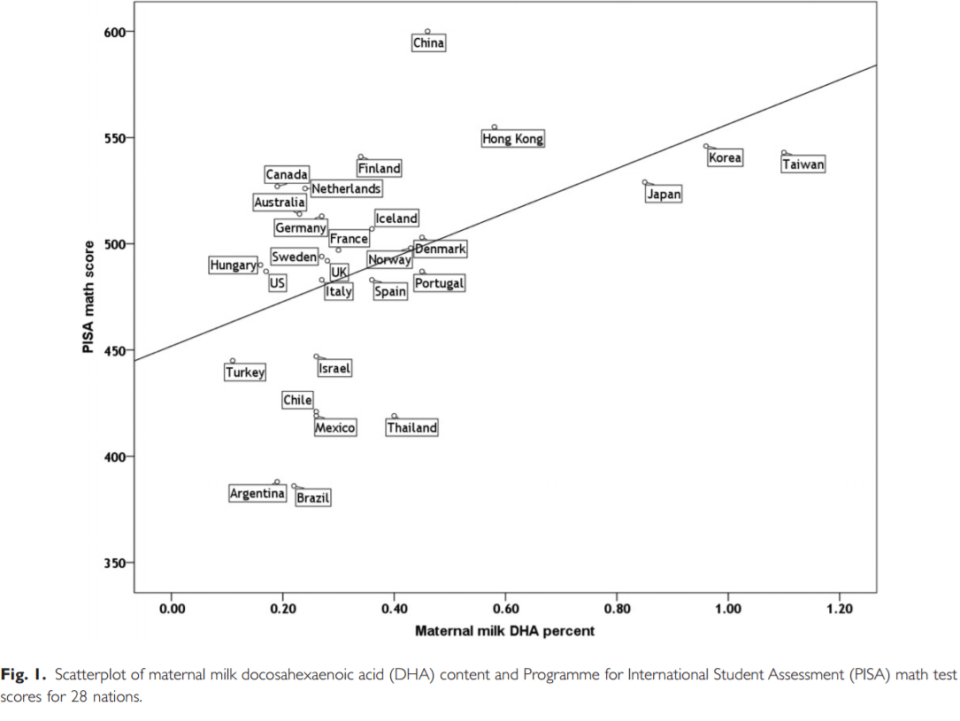
So countries with lower maternal milk levels of DHA score lower on the maths section of the PISA exam (not an IQ test, but it’s ‘good enough’). Knowing what is known about the effects of DHA on cognitive abilities, countries who have higher maternal milk levels of DPA do score higher on the maths section of the PISA exam.
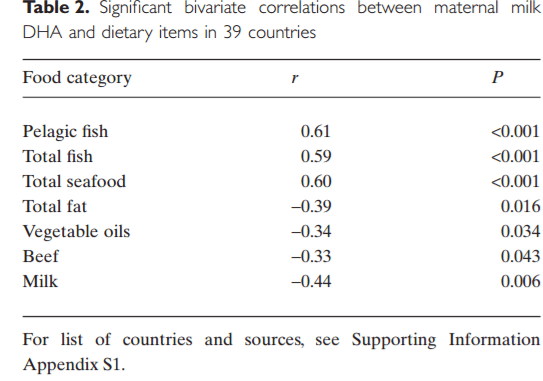
Table 2 shows the correlations between grams per capita per day of food consumption in the data set they used and maternal milk DHA. As you can see, total fish and seafood consumption are substantially correlated with total milk DHA, while foods that are high in n-6 show medium negative correlations with maternal milk DHA. The combination of foods that explain the most of the variance in maternal milk DHA is total fat consumed and total fish consumed. This explained 61 percent of the variance in maternal milk DHA across countries.
Not surprisingly, foodstuffs high in n-6 showed significant negative correlations on maternal milk DHA. “Any regression including total fish or seafood, and vegetable oils, animal fat or milk consistently explains at least half of the variance in milk DHA, with fish or seafood having positive beta coefficients and the remainder having negative beta coefficients.”
The study showed that a country’s balance of n-3 and n-6 was strongly related to the students’ math performance on the PISA. This relationship between milk DHA and cognitive performance remains sufficient even after controlling for national wealth, macro intake and investment in education. The availability of DHA in populations is a better predictor of test scores than are SES factors (which I’ve covered here on Italian IQ), though SES explains a considerable portion of the variance, it’s not as much as the overall DHA levels by country. Furthermore, maternal DHA levels are strongly correlated to per capita fish and seafood consumption while a negative correlation was noticed with the intake of more vegetable oils, fat, and beef, which suggests ‘metabolic competition’ between the n-3 and n-6 fatty acids.
There are, of course, many possible errors with the study such as maternal milk DHA values not reflecting the total DHA in that population as a whole; measures of extracting milk fatty acids differed between studies; test results being due to sampling error; and finally the per capita consumption of foods is based on food disappearance, not amount of food consumed. However, even with the faults of the study, it’s still very interesting and I hope they do further work with actual measures of cognitive ability. Despite the pitfalls of the study (the main one being the use of PISA to test ‘cognitive abilities’), this is a very interesting study. I eventually hope that a study similar to this one is undertaken with actual measures of cognitive ability and not PISA scores.
We now know that n-6 is negatively linked with brain performance, and that n-3 is positively linked. What does this say about America?
As I’m sure all of you are aware of, America is one of the fattest nations in the world. Not surprisingly, Americans consume extremely low levels of seafood (very high in DPA) and more foods high in n-6 (Papanikolaou et al, 2014). High levels of n-3 (which we do not get enough of in America) and n-6 are correlated with obesity (Simopoulos, 2016). So not only do we have a current dysgenic effect in America due to decreased fertility of the more intelligent (which is also part of the reason why we have the effect of dysgenic fertility in America), obesity is also driven by high levels of n-6 in the Western diet, which then causes obesity down the generations (Massiera et al, 2010).
I also previously wrote on agriculture and diseases of civilization. Our hunter-gatherer ancestors were all around healthier than we were. This, clearly, is due to the fact that they ate a more natural diet and not one full of processed, insulin-spiking carbohydrates, among other things. Our hunter-gatherer ancestors consumed n-3 and n-6 at equal amounts (1:1) (Kris-Etherson, et al 2000). As I documented in my article on agriculture and disease, HGs had low to nonexistent rates of the diseases that plague us in our modern societies today. However, around 140 years ago, we entered the Industrial Revolution. The paradigm shift that this caused was huge. We began consuming less n-3 (fish and other assorted seafood and nuts among other foods) while n-6 intake increased (beef, grains, carbohydrates) (Kris-Etherson, et al 2000). Moreover, the ratio of n-6 to n-3 from the years 1935 to 1939 were 8.4 to 1, whereas from the years 1935 to 1985, the ratio increased to about 10 percent (Raper et al, 2013). We Americans also consume 20 percent of our daily kcal from one ‘food’ source—soybean oil—with almost 9 percent of the total kcal coming from n-6 linoleic acids (United States Department of Agriculture, 2007). The typical American diet contains about 26 percent more n-6 than n-3, and people wonder why we are slowly getting dumber (which is, obviously, a side effect of civilization). So our n-6 consumption is about 26 percent higher than it was when we were still hunter-gatherers. Does anyone still wonder why diseases of civilization exist and why hunter-gatherers have low to nonexistent rates of the diseases that plague us?
The bioavailability of n-6 is dependent on the amount of n-3 in fatty tissue (Hibbeln et al, 2006). This goes back to the ‘metabolic competition’ mentioned earlier. N-3 also makes up 10 percent of the overall brain weight since the first neurons evolved in an environment high in n-3. N-3 fatty acids were positively related to test scores in both men and women, while n-6 showed the reverse relationship (with a stronger effect in females). Furthermore, in female children, the effect of n-3 intake were twice as strong in comparison to male children, which also exceeded the negative effects of lead exposure, suggesting that higher consumption of foods rich in n-3 while consuming fewer foods rich in n-6 will improve cognitive abilities (Lassek and Gaulin, 2011).
The preponderance of evidence suggests that if parents want to have the healthiest and smartest babes that a pregnant woman should consume a lot of seafood while avoiding vegetable oils, total fat and milk (fat, milk and beef moreso from animals that are grain-fed) Grassfed beef has higher levels of n-3, which will balance out the levels of n-6 in the beef. So if you want your family to have the highest cognition possible, eat more fish and less grain-fed beef and animal products.
In sum, if you want the healthiest, most intelligent family you can possibly have, the most important factor is…diet. Diets high in n-3 and low in n-6 are extremely solid predictors of cognitive performance. Due to the ‘meatbolic competition’ between the two fatty acids. This is because n-6 accumulates in the blood and tissue lipids exacerbating the competiiton between linolic acid (the most common form of n-6) and n-3 for metabolism and acylation into tissue lipds (Innis, 2014). Our HG ancestors had lower rates of n-6 in their diets than we do today, along with low to nonexistent disease rates. This is due to the availability of n-6 in the modern diet, which was unknown to our ancestors. Yes, seafood intake had the biggest effect on the PISA math scores, which, in my opinion (I need to look at the data), is due in part to poverty. I’m very critical of PISA, especially as a measure of cognitive abilities, but this study is solid, even though it has pitfalls. I hope a study using an actual IQ test is done (and not Richard Lynn IQ tests that use children, a robust adult sample is the only thing that will satisfy me) to see if the results will be replicated.
I also think it’d be extremely interesting to get a representative sample from each country studied and somehow make it so that all maternal DHA levels are the same and then administer the tests. This way, we can see how all groups perform with the same amounts of DHA (and to see how much of an effect that DHA really does have). Furthermore, nutritonally impoverished countries will not have access to the high-quality foods with more DHA and healthy fatty acids that lead to higher cognitive function.
It’s clear: if you want the healthiest family you could possibly have, consume more seafood.
