
1700 words
Black-white differences get talked about more than Asian-white differences. (For the purposes of this article, “Asian” refers to Koreans, Chinese, Japanese and Filipinos whereas “white” refers to those of European descent.) One interesting racial difference is that of body fatness between ethnies/races. Blacks have thinner skin folds and lower percent body fat than whites at the same height/BMI, and Asians have higher body fat and larger skinfolds than do whites. The interesting thing about this Asian-white difference is the fact that, at the same BMI, Asians have more upper body fat (trunk) than whites. The interesting thing is that there are two good studies, looking at these types of differences between Asians and whites (one study looking at the aforementioned “Asians” I previously identified and whites in the NYC area and another comparing whites and Chinese living in China.)
Wang et al (1994) studied 687 healthy volunteers (445 whites and 242 Asians, ranging from 18-94 years of age with BMIs in the range of 15-38). They defined ethnicity as the birthplace of one’s grandparents. The “Asian” category included 225 Chinese, 9 Japanese, 6 Koreans and 2 Filipinos; 97 percent of this sample was born in Asia. Then, after an overnight fast to better assess body fat differences and skinfold measures, they were weighed and measured, with their back, butt and feet firmly against the wall.
They measured skinfold thickness at the midarm for the average of the triceps and biceps, trunk thickness was the average circumference of the chest, subscapular, umbilicus, abdomen, and suprailiac. The circumference of the arm was measured at the midarm, while the circumference of the trunk was the average circumference of the upper chest, waist, iliac crest, and chest.
Wang et al (1994) found that whites were significantly taller, heavier and had higher BMIs than Asians. Wang et al (1994: 25) write:
For lean and normal BMIs, Asians were fatter than whites in both sexes, but the differences in estimated fat% between whites and Asians varied by BMI in different directions for males and females: fat% increased with BMI for males but decreased with BMI for females.
Whites were had significantly larger circumference in the measured appendages compared to Asians, while in Asian and white females, the circumference of the arms and waist were not different but other circumferences showed a greater difference, favoring whites. Asians had significantly higher levels of subcutaneous trunk fat (upper body fat) than whites, while white females had more lower (thigh) body fat than Asians. In both sexes, Asians had thicker bicep, subscapular, abdomen, and suprailiac skinfolds than whites, in both sexes. White women had higher levels of subcutaneous fat in their thighs. The only difference between white and Asian males in regard to skinfold area was the thigh, with whites having larger thighs, but were similar at the midarm and trunk. Asian men had a larger trunk skinfold area whereas whites had a larger thigh skinfold area while arm fatness did not differ between the races. Women in both races had larger skinfold areas except in the trunk; for whites, there were no differences between the sexes. In both sexes, Asians had higher values in subcutaneous fat (at the midarm, trunk, and midthigh), but white women had a higher value in the thigh than Asian women.
Wang et al (1994) show that there are significant differences in body fatness at different sites of the body, and so, since most (if not all) BMI equations are based on white populations, then, these equations will not work for Asians and will result in substantial error.
Wang et al (2011) studied differences in body composition between Chinese and white males living in the Shenzhen, Guangdong Province, China. They studied 115 Chinese and 114 white males. In this sample, Chinese males were younger, shorter, had a lower body weight and lower BMI than the white sample. Whites had higher fat mass, fat-free mass and bioelectrical impedance (which assess body composition, which measures lean mas in relation to fat mass; but these can be skewed by how much water one has or has not drunk, and so the DXA scan and hydrostatic weighing are, in my opinion, superior assessors). After adjustment for age and BMI, the percentage of fat mass in the trunk and arm was higher in Chinese than white males. Further, Chinese men had higher diastolic blood pressure (DBP), fasting glucose (FG) and triglycerides (TG), while whites had higher fasting total plasma cholesterol (TC) and high-density lipoprotein (HDL). The only statistically significant differences were between FG and HDL. Even after adjustment, Chinese men had 3.0 mmHg higher DBP than whites.
Chinese men had higher percent body fat than whites and more fat stored around their trunks than whites at the same BMI. Chinese men had higher fasting glucose levels (a risk-factor for obesity) but lower HDL levels at the same BMI as whites. Wang et al (2011) write:
In addition, comparing the two nationally representative studies, NHANES III [32] and China National Nutrition and Health Survey 2002 (CNNHS 2002) [33], Chinese men held a relatively 15.0% lower mean value of BMI than that for American white men. While comparison results from two large-scale epidemiological studies, the Shanghai Diabetes Studies (SHDS) [34] and the NHANES III [35], show that the mean value of PBF for American men is relatively 7.4% higher than that for Chinese men. The relative difference of PBF between American and Chinese males is much less than the difference of BMI, implying that the PBF among American men should be lower than that of Chinese men with the same BMI level.
What this implies is that the proportion of overweight/obese Chinese men are severely underestimated since, as noted earlier, most—if not all—BMI equations are created using strictly white populations. This study also provides more evidence that Chinese men had more central (trunk) adiposity than whites (Britons, in this study; Eston, Evans, and Fu, 1994). Central adiposity and risk for type II diabetes and cardiovascular disease is heightened in those of Chinese descent (Weng et al, 2006). It should also be noted that, in a sample of 129 Pacific Islanders, 120 Asians, 91 Maoris, and 91 Europeans aged 12-91, the relationship between bioelectrical impedance analysis (BIA) is ethnicity-dependent, due to the fact the equations developed for fatness estimation using BIA were more accurate than what was recommended by the manufacturer (Sluyter et al, 2010). Cheng (2011) showed that central adiposity was more predictive of cardiovascular diseases in the Chinese population than was BMI, while Hu et al (2007) showed that central obesity was more related to diabetes mellitus and impaired fasting glucose than to overall obesity in the Chinese population.
So, clearly, obesity-related factors appear at lower BMIs for Asians than Europeans (e.g., Huxley et al, 2008). Pan et al (2004) showed that for most BMI values, incidences of hypertension, diabetes, and hyperuricemia were higher in the Taiwanese sample than in the white and black samples. As BMI got higher, the risk for hypertriglyceridemia and hypertension increased. They showed that BMIs of 22.6, 26, and 27.5 were the cutoffs for the best predictabilty in regard to negative and positive variables for Taiwanese, white and black men, respectively. Pan et al (2004: 31) write:
For BMIs 27, 85% of Taiwanese, 66% of whites, and 55% of blacks had at least one of the studied comorbidities. However, a cutoff close to the median of the studied population was often found by maximizing sensitivity and specificity. Reducing BMI from 25 to 25 in persons in the United States could eliminate 13% of the obesity comorbidity studied. The corresponding cutoff in Taiwan is slightly 24.
Pan et al (2004) conclude that, for Taiwanese (Asians) in their study, they should have a lower BMI cutoff than whites and blacks, though it is tough to ascertain where that cutoff would be.
Bell, Adair, and Popkin (2002) show that “at BMI levels less than 25, prevalence difference figures suggested a stronger association between BMI and hypertension in Chinese men and women but not in Filipino women, compared with non-Hispanic Whites” while “[n]on-Hispanic Blacks and Filipino women had a higher prevalence of hypertension at every level of BMI compared with non-Hispanic Whites and Mexican Americans.”
Since Asians have a higher risk of hypertension than whites after controlling for BMI, this indicates that the effects of obesity are not as important as other factors, be they genetic or environmental (or both, which it obviously is). The higher incidence of obesity-related risk-factors in Asian populations with lower BMIs has been attributed to GxE interactions, which, of course, have been intensified with the introduction of the Western Diet (AKA the SAD [Standard American Diet] diet). This can be most notably seen with the explosion of childhood obesity in China, with the number of obese people in China surpassing the US recently, while China is on its way to have the most obese children in the world. The surging obesity epidemic in China is due to increasingly similar lifestyles to what we have (sedentary populations; highly processed, high fat, high carbohydrate foodstuff).
So since the findings in the reviewed studies suggest that, at a lower BMI, Asians are more susceptible to obesity-related risk-factors, and so, BMI standards must be lowered for Asian populations, which would be BMI 24 for overweight and BMI 27 for obese, which was recommended by the Chinese Ministry of Health (Wang et al, 2010). Cheung et al (2018) show that diet quality is inversely associated with obesity in Chinese adults who have type II diabetes.
In conclusion, Asians at the same BMI have higher body fat percentage than whites, and they also have more obesity-related risk-factors than whites at a lower BMI (Pan et al, 2004; WHO expert consultation, 2004; Wang et al, 2010; Hsu et al, 2015), which implies that they need differing BMI scales, just as blacks need different scales in comparison with whites. Here is a good example of two people with the same BMI (22.3) but different DXA results:
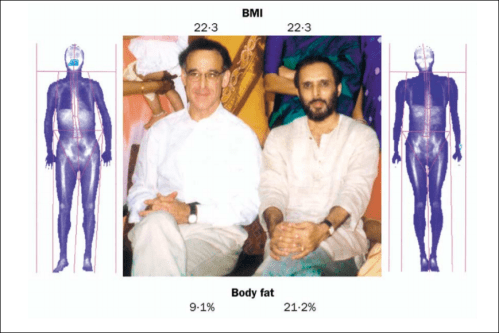
This, of course, shows the strong limitations of the use of the same BMI standards calculated in one ethny and used for another. So, just like at the same BMI blacks have lower body fat and thinner skinfolds than whites (Vickery, Cureton, and Collins, 1988; Wagner and Heyward, 2000; Flegal et al, 2010), at the same BMI as whites, Asians have higher body fat and thicker skinfolds (Wang et al, 1994; WHO expert consultation, 2004; Wang et al, 2011).
