
Open Thread
Talk about anything (reasonable).
In honor of Movember, I’m going to take some time this month to write about prostate cancer, it’s causes and how to prevent it (doctor supervision, etc). Since ‘charities’ like the Susan G. Komen Foundation are very shady and all eyes go to them Movember gets looked over. Movember is to raise awareness for prostate cancer and other diseases that plague men. Also read I Will Not Be Pinkwashed: Komen’s Race is for Money, Not the Cure.
See also my articles on race and prostate cancer:
Race, Testosterone, and Prostate Cancer
Explaining the Black-White Prostate Cancer Gap
Racial Differences in Prostate Cancer: Part II
Also on prostate cancer, one meta-analysis show there is no B-W PCa gap:
This meta-analysis concludes that there are no racial differences in the overall and prostate cancer–specific survival between African American and White men.
While another study shows the same:
Although African-American patients tend to have higher pretreatment PSA levels than white patients, the outcome for the disease is similar in the two groups when stratified by known pretreatment prognostic factors. Our data provide no evidence for the hypothesis that prostate cancer in African-Americans is intrinsically more virulent than in whites.
Most Human Performance Traits Do Not Lie On a Bell Curve
1050 words
Steve Sailer published an article the other day titled Wieseltier vs. “The Bell Curve” and I left a comment saying that psychological traits are not normally distributed. Two people responded to me, and I replied back but Sailer didn’t approve my two comments. I have a blog, so I can post it here.
“We revisit a long-held assumption in human resource management, organizational behavior, and industrial and organizational psychology”
Maybe instead debunking allegedly long-held assumptions they should Notice that none of those disciplines actually exists.
They do actually exist.
“Human resource management: Human Resource Management (HRM) is the term used to describe formal systems devised for the management of people within an organization. The responsibilities of a human resource manager fall into three major areas: staffing, employee compensation and benefits, and defining/designing work.”
Organizational behavior: “the study of the way people interact within groups. Normally this study is applied in an attempt to create more efficient business organizations. The central idea of the study of organizational behavior is that a scientific approach can be applied to the management of workers.”
Industrial and organizational psychology: “This branch of psychology is the study of the workplace environment, organizations, and their employees. Technically, industrial and organizational psychology – sometimes referred to as I/O psychology or work psychology – actually focuses on two separate areas that are closely related.”
O’Boyle Jr and Aguinis (2012) write:
We conducted 5 studies involving 198 samples including 633,263 researchers, entertainers, politicians, and amateur and professional athletes. Results are remarkably consistent across industries, types of jobs, types of performance measures, and time frames and indicate that individual performance is not normally distributed—instead, it follows a Paretian (power law) distribution. Assuming normality of individual performance can lead to misspecified theories and misleading practices. Thus, our results have implications for all theories and applications that directly or indirectly address the performance of individual workers including performance measurement and management, utility analysis in preemployment testing and training and development, personnel selection, leadership, and the prediction of performance, among others.
Even most types of job performance and performance measures don’t fit a normal curve.
You say, “…psychological traits aren’t normally distributed.”
But the abstract you linked says,
…individual performance is not normally distributed.
Yes, those of us who have had the misfortune to manage work groups know all about 80/20. This is performance, not “psychological traits.”
Psychological tests aren’t a measure of performance? Traits like IQ only show a normal distribution because the normal distribution is built into the tests (see below).
The other one linked says,
… at many physiological and anatomical levels in the brain, the distribution of numerous parameters is in fact strongly skewed . . .
Okay. The cylinders in the straight-six engine of my BMW lean over to one side, but that doesn’t seem to effect the horsepower. This is a physical trait.
So, what of those “psychological traits”? Like IQ? Granted, it is a kind of performance, one of taking IQ tests, but the results have a normal distribution, and it’s not the kind of performance being measured in the study referenced anyway. IQ, by definition, is a “psychological trait,” and it has a normal distribution.
IQ tests have been constructed so that the scores will exhibit a bell curve distribution. That is, the tests themselves are constructed to reveal differences that are already presumed. IQ tests are constructed with the assumption that the scores are normally distributed, however, the normal distribution is built into the test. Items that 50 percent of the testees get right are kept, along with the smaller proportion of items that many testees get right. (See Richardson, 2002 for more information.) Even most psychological constructs are not normally distributed. This is like g being supposedly physiological when—if it were—it wouldn’t mimic any known physiologic process in the body.
Buzsaki and Muzuseki (2014) review data that sensory acuity, reaction time, memory word usage and sentence lengths are not normally distributed. Basic physiologic processes, too, are not normally distributed, like visual acuity, resting heart rate, metabolic rate, etc. And this makes sense, because those traits are crucial to human survival and therefore need to be malleable. Hormones raise, for instance, during a life-or-death situation, and that is what is needed for survival. So, therefore, few physiological traits are normally distributed.
Honestly, I don’t know what your point is, but I don’t disagree with what you have shown me. I know it’s true, but I’m just too far left on your ski jump curve of losers to grasp why you responded to me that way.
Wieseltier was referring to The Bell Curve, in which results have a normal distribution.
Rigbt, the IQ book. But tests are constructed with the assumption of a normal distribution, but psychological traits are not normally distributed. Read Mizsukei and Buzsaki’s work.
Burt (1967) writes:
A detailed analysis of test results obtained from a large sample of English children (4,665 in all), supplemented by a study of the meagre data already available, demonstrates beyond reasonable doubt that the distribution of individual differences in general intelligence by no means conforms with strict exactitude to the so-called normal curve.
In sum, IQ tests are constructed with the assumption that whatever is being tested lies on a bell curve. Clearly, since they are constructed in such a way, the results are forced to fit a normal distribution. But, as seen above, most traits that are critical to survival are not normally distributed, so why should intelligence/IQ be the same? The data from Buzsaki and Mizuseki (2014) show that “skewed … distributions are fundamental to structural and functional brain organization.”
(Also read The Myth of the Bell Curve and The Unicorn, The Normal Curve, and Other Improbable Creatures. where Micceri shows that achievement measures in “language arts, quantitative arts/logic, sciences, social studies/history, and skills such as study skills grammar, and punctuation” are not normally distributed. Human performance does not follow a bell curve. Also read The Bell Curve Is A Myth — Most People Are Actually Underperformers. The Bell Curve in Psychological Research and Practice: Myth or Reality?: “If IQ scores distribute normally, this does not mean that intelligence equally distribute normally in the population.” … “ In this way, a normal distribution in summated test scores, for example, would be seen as the sign of the presence of an error sufficient to give scores the characteristic bell shape, not as the proof of a good measurement.“)
Microcephaly and Normal IQ
1400 words
In my last article on brain size and IQ, I showed how people with half of their brains removed and people with microcephaly can have IQs in the normal/above average range. There is a pretty large amount of data out there on microcephalics and normal intelligence—even a family showing normal intelligence in two generations despite having dominantly inherited microcephaly.
Microcephaly is a condition in which an individual has a head circumference of 2 SD below the mean. Though most would think that would doom all microcephalics to low IQs, 15 percent of microcephalics have IQs in the normal range. This is normally associated with mental retardation, but this is a medical myth (Skoyles and Sagan, 2002: 239), though there are numerous cases of microcephalics having normal IQs (Dorman, 1991). Numerous studies show that it’s possible for normal people to have small brains. Giedd et al (1996) showed a wide variation in head circumference. Of the 104 individuals who had their heads scanned, volume for the cerebellum ranged from 735 cc in a 10 year old boy to 1470 cc in a 14 year old boy (Skoyles, 1999: 4, para 12). Though Giedd et al (1996) did not report total brain volumes in their subjects, brain volume can be inferred. Skoyles (1999; 4, para 12) writes:
The cerebral cortex makes up only 86.4% of brain volume when measured by MRI (Filipek, Richelme, Kennedy & Caviness, 1994), so the total brain volume of the 10-year-old would be larger at 850.7 cc. Brains at 10 years are about 4.4% smaller than adult size (Dekaban & Sadowsky, 1978), suggesting that that brain would grow to an adult size of 888 cc. Even using the lower figure of 80% cerebrum to brain ratio derived from anatomical studies suggests a figure of only 960 cc.
The variation of 888 cc to 960 cc depending on which value for the cerebrum to brain ratio you use still shows that people can have brains 450-300 cc lower than average and still be ‘normal’.
Researchers began noticing many cases of both individuals and families exhibiting features of microcephaly—but they had normal intelligence (Simila, 1970;Seemanova et al, 1985; Rossi et al, 1987; Teebi et al, 1987; Sherrif and Hegab, 1988; Desch et al, 1990; Opitz and Holt, 1990; Evans, 1991; Heney et al, 1991; Green et al, 1995; Rizzo and Pavone, 1995; Teebi and Kurash, 1996; Innis et al, 1997; Kawame, Pagon, and Hudgens, 1997; Abdel-Salam et al, 1999; Digweed, Reis, and Sperling, 1999; Woods, Bond, and Enard, 2005; Ghaoufari-Fard et al, 2015). This is a pretty huge blow to the brain size/IQ correlation, for if people with such small heads can have normal IQs, why do we have such large brains that leave us with such large problems (Skoyles and Sagan, 2002: 240-244)?
If we can have smaller heads—which would make childbirth easier and allow us to continue to have smaller pelves which would be conducive to endurance running since we are the running ape, why would brains have gotten so much larger from that of erectus (where modern people can have normal IQs with erectus-sized brains) if it is perfectly possible to have a brain on around the size of early erectus? In any event, these anomalies need an explanation, and Skoyles (1999) hypothesizes that people with smaller heads but normal IQs may have a lower capacity for expertise. This is something that I will look into in the future, as it may explain these anomalies, along with the true reason why our brains began increasing around 3 mya.
Sells (1977)—using the criteria of 2 SD below mean head size—showed that 1.9 percent of the children he tested (n=1009) had IQs indistinguishable from their normocephalic peers. Watemberg et al (2002) studied 1,393 patients. They found that almost half of their patients with microcephaly (15.4% of their patients studies had microcephaly) had IQs within the normal limits, while among those with sub-normal intelligence, 30 percent had borderline IQs or were mildly mentally retarded (it’s worth noting that l-glutamate can raise IQ scores by 5-20 points in the mild to moderate mental deficiency; Vogel, Braverman and Draguns, 1966 review numerous lines of evidence that glutamate raises IQ in mentally deficient individuals). Sassaman and Zartler (1982) showed that 31.9 percent of microcephalics had normal intelligence, 6.9 percent of them had average intelligence.
Head circumference does not directly correlate with IQ in microcephalic patients (Baxter et al, 2009). Dorman (1991: 268) writes: “Decreased head size may or may not be associated with lowered intelligence, indicating that small head size by itself does not affect intelligence. The presence of subgroups of microcephalic persons who typically have normal intelligence is sufficient to rule out a causal relationship between head size and intellect. … It can be added that reduction in brain size without such structural pathology, as mayvoccur in some genetic conditions or evenvas a result of normal variation, does not
affect intelligence. ”
Tenconi et al (1981) write: “We were able to examine five other members of this family (1-3; 11-1; 11-4; 11-5; 11-8) and found no abnormalities: they were of normal intelligence, head circumference, and ophthalmic evaluation. Members of the grandmother’s family who refused to be examined appeared to be of normal intelligence and head appearance and did not have any serious eye problems.”
Stoler-Poria et al (2010) write: “There was a K-ABC cognitive score < 85 (signifying developmental delay) in two (10%) children from the study group and in one (5%) child from the control group: one of the children in the study group (the one with HC below − 3 SD) scored significantly below the normal range (IQ = 70), while the other scored in the borderline range (IQ = 83); the child from the control group also scored in the borderline range (IQ = 84).” Whereas Thelander and Pryor (1968) showed that individuals with head circumferences 2-2.6 SDs below the mean had average IQs, though the smaller their HC, the lower their IQ. Ashwal et al (2009: 891) write: “The students with microcephaly had a similar mean IQ to the normocephalic group (99.5 vs 105) but had lower mean academic achievement scores (49 vs 70).” So it seems that microcephalics can have normal IQs, but have lower academic achievement scores.
Primary microcephalics have higher IQs than secondary microcephalics (Cowie, 1987). Primary microcephaly is microcephaly that one is born with whereas secondary microcephaly is acquired.
There is one case study of a girl with microcephaly where Tan et al (2014) write: “Most recent measures of general intelligence (performed at 6½ years of age) reveal a below average full scale IQ of 75 with greatest impairment in processing speed. On the Wechsler Preschool and Primary Scale of Intelligence III Revised (for children 2 years 6 m – 7 years 3 m), she obtained a Verbal IQ of 83, Nonverbal IQ of 75, and Processing speed 71. On the Wechsler Individual Achievement Testing (WIAT) she showed significant struggles in secondary language on tasks of early reading (SS 60), word reading (SS 70), reading comprehension (SS 69) and struggles in math on the task of numerical operations (SS 61) (WPPSI – R and WIAT mean = 100 and SD = 15). Parents report subjectively that differences in development relative to her sisters are becoming more apparent with time.”
It is not a foregone conclusion that if an individual has microcephaly that they will have a low IQ and be mentally retarded, as reviewed above, there are numerous cases of individuals with microcephaly and normal IQs, with this even being seen in families—that is, multiple families with normal IQs yet have microcephaly. Numerous people with Nijmegen breakage syndrome (a type of microcephaly) can have normal IQs. Rossi et al (1987) reported that for 6 Italian families (n=21 microcephalics) with autsomally inherited microcephaly, for those administered psychometric tests (n=12), all had normal IQs but one, with an IQ range of 99 to 112 for a mean of 99.3.
In conclusion, microcephalics can have normal IQs and live normal lives, despite having heads, on average, that are 2 SDs below the mean. These anomalies (and there are many, many more) need explaining. This is great evidence that a larger brain does not always mean a higher IQ, as well as yet more evidence that it was possible for Homo erectus to have an IQ in our range today, which means that we may not need brains our current size for our intellect and achievements. To conclude, I will provide a quote from Dorman (1991):
The normal intelligence found by SELLS in school children with small head size also militates against any straightforward relationship between diminished head size and lowered intelligence.
With the correlation between brain size and IQ being .4 (Gignac and Bates, 2017), this does not rule out the ‘outliers’ reviewed in this article. These cases deserve an explanation, for if large brains lead to high IQs, why do these people with heads significantly smaller have IQs in the normal range? (See Skoyles, 1999: 8, para 31 for an explanation for the brain size/IQ correlation.)
No, Soy Doesn’t Feminize Males
1400 words
There are a few things I constantly see around the Internet that really irk me. One of those things is the meme that soy causes feminization in males. Some people may see a picture of a guy with soft facial features and they’ll say ‘oh that’s a soy boy.’ They do not show a good understanding of soy and its chemicals. As usual, overblown claims from people who have no specialty in what they’re talking about have an answer—just one they do not want to hear.
I have no idea when this craze of blaming soy and other foods on ‘feminization of males’ (I have done so a few years ago, though I realize my error now), but it’s starting to get out of hand. I see this around Twitter a lot; ‘oh it’s the soy making men beta’ or ‘they know exactly what soy does to men and they still push it!’. The whole scare about soy is that soy has phytoestrogens called isoflavones, and these phytoestrogens then may mimic estrogen production in the body. (It’s worth noting that phytoestrogens do not always mimic estrogens, despite some people’s protesting to me that “It has estrogen right in the name!”.)
Many men have blamed soy and phytoestrogens/isoflavones on their growing breasts, having a flaccid penis, slow beard growth (that’d be enough motivation for me to do something about it, to be honest), loss of hair on his arms and legs, and, he says “Men aren’t supposed to have breasts … It was like my body is feminizing.” So this man went to an endocrinologist and was told that he had gynecomastia—enlarged breasts in men. He got tested for a whole slew of maladies, but they all came back negative. Then the doctor told him to be very specific with his diet. The man then said that he was lactose intolerant and that he drank soy milk instead of cow’s milk. The doctor then asked him how much soy milk he drank per day, to which the man responded 3 quarts. Was soy the cause of his gynecomastia and other negative health effects? I don’t think so.
For men and boys, soy does not seem to have an effect on estrogen and other hormone levels, nor does it seem to have an effect on development and fertility:
A handful of individuals and organizations have taken an anti-soy position and have questioned the safety of soy products. In general, this position latches to statistically insignificant findings, understates how powerfully the research refutes many of the main anti-soy points, and relies heavily on animal research studies, which are medically irrelevant to human health.
Most of those people are ‘activists’ who do not understand the intricacies of what they are talking about. In the field of nutrition, it’s dumb to take studies done on animals nd then extrapolate that data to humans. It does not make sense.
There are reasons not to eat soy that do not go along with this dumb hysteria from people who do not know what they are talking about. One reasons is that, when compared to casein protein, soy protein is inferior (Luiking et al, 2005). Further, data is “inconsistent or inadequate in supporting most of the suggested health benefits of consuming soy protein or ISF” (Xiao, 2008). People may cite studies like Lephart et al (2002) where they write in their article Neurobehavioral effects of dietary soy estrogens:
Whether these observations hold true for the human brain remains to be established and will only become apparent from long-term clinical studies. One point that needs clarification relates to the timing of brain development in the rat, which differs from that in the human. (pg. 12)
Rats and humans are different; I don’t think I need to say that. Though people who cite these studies (uncritically) as ‘evidence’ that soy lowers T, causes infertility problems, and feminization just look to grab anything that affirms their fearmongering views.
Jargin (2014) writes in his article Soy and phytoestrogens: possible side effects:
Feminizing effect of phytoestrogens and soy products may be subtle, detectable only statistically in large populations; it can be of particular importance for children and adolescents. This matter should be clarified by independent research, which can have implications for the future of soy in the agriculture.
If it’s only identifiable in statistically large populations, then it is meaningless. Though, East Asians seem to be adapted to soy and so (like all studies should note), these results should not be extrapolated to other races/ethnies (Jargin, 2014). I do agree with that assessment; I do not agree with the claim that these phytoestrogens would cause problems that would only be seen in statistically large populations.
If people want to use rat studies to show that soy supposedly raises estrogen levels, then I will use a rat study showing the opposite (Song, Hendrich, and Murphy, 1999). They showed that the effects of the isoflavones from soy were only weakly estrogenic. Further, Mitchell et al (2001) write in their article Effect of a phytoestrogen food supplement on reproductive health in normal males:
The phytoestrogen supplement increased plasma genistein and daidzein
concentrations to approx. 1 µM and 0.5 µM respectively; yet, there was no observable effect on endocrine measurements, testicular volume or semen parameters over the study period. This is the first study to examine the effects of a phytoestrogen supplement on reproductive health in males. We conclude that the phytoestrogen dose consumed had no effect on semen quality.
The men in this study took a daily isoflavone supplement containing 40 mg of isoflavone every day for two months and still did not show negative effects. Looking at rat studies and then extrapolating that to humans doesn’t make sense.
Finally, there was a large meta-analysis by Messina (2010) who writes:
The intervention data indicate that isoflavones do not exert feminizing effects on men at intake levels equal to and even considerably higher than are typical for Asian males.
And from the conclusion:
Isoflavone exposure at levels even greatly exceeding reasonable dietary intakes does not affect blood T or estrogen levels in men or sperm and semen parameters. The ED-related findings in rats can be attributed to excessive isoflavone exposure and to differences in isoflavone metabolism between rodents and humans. Thus, men can feel confident that making soy a part of their diet will not compromise their virility or reproductive health.
Now, I know that proponents of the hypothesis of soy feminizing males would say to me “Why don’t you just eat a bunch of soy and see what happens then, if it is fine for you?” Well, unlike most people, I eat a strict diet and soy is not part of it.
Soy isoflavones are currently being researched in regards to the prevention and treatment of diabetes, cardiovascular disease, cancer, osteoporosis, and neuroprotection (Kalaiselven et al, 2010), while the nutritional and health benefits of soy isoflavones are currently being studied (Friedman and Brandon, 2001; McCue and Shetty, 2004). Soy foods may also be optimal for bone health (Lanou, 2011).
In conclusion, as you can see, the claims of soy causing feminizing effects on men are largely overblown. People extrapolate data from rat studies to humans, which doesn’t make any sense. To paraphrase Dr. Jason Fung, imagine 2 lions are watching a deer eat. They see how strong and in shape the deer are eating grass. So the lions, noticing that the deer are healthy eating grass, begin to eat grass too thinking it is healthy and they die. One hundred years later, 2 deer are watching a lion eat meat and sees how strong, fast, and healthy it is. They then draw the conclusion that eating meat is healthy and will do the same for them and they eat meat and die. The point of the analogy is that just because studies on animals show X and therefore Y, that does not mean that it will hold for humans! This is something very simple for people to understand, though most do not.
Most people search for things to prove their assumptions without having an actual understanding of the biological mechanisms of what they’re talking about. People should learn some of the literature before they cite studies that supposedly back their biases, because they would then see that it is not as nuanced as they believe.
(Note: Diet changing under Doctor’s supervision only.)
My Response to Jared Taylor’s Article “Breakthroughs in Intelligence”
1300 words
Here is my reply to Jared Taylor’s new article over at AmRen Breakthroughs in Intelligence:
“The human mind is not a blank slate; intelligence is biological”
The mind is not a ‘blank slate’, though there is no ‘biological’ basis for intelligence (at least in the way that hereditarians believe). They’re just correlations. (Whatever ‘intelligence’ is.)
“there is no known environmental intervention—including breast feeding”
There is a causal effect of breast feeding on IQ:
While reported associations of breastfeeding with child BP and BMI are likely to reflect residual confounding, breastfeeding may have causal effects on IQ. Comparing associations between populations with differing confounding structures can be used to improve causal inference in observational studies.
Brion, M. A., Lawlor, D. A., Matijasevich, A., Horta, B., Anselmi, L., Araújo, C. L., . . . Smith, G. D. (2011). What are the causal effects of breastfeeding on IQ, obesity and blood pressure? Evidence from comparing high-income with middle-income cohorts. International Journal of Epidemiology, 40(3), 670-680. doi:10.1093/ije/dyr020
Breastfeeding is related to improved performance in intelligence tests. A positive effect of breastfeeding on cognition was also observed in a randomised trial. This suggests that the association is causal.
Horta, B. L., Mola, C. L., & Victora, C. G. (2015). Breastfeeding and intelligence: a systematic review and meta-analysis. Acta Paediatrica, 104, 14-19. doi:10.1111/apa.13139
“before long we should be able to change genes and the brain itself in order to raise intelligence.“
Which genes? 84 percent of genes are expressed in the brain. Good luck ‘finding’ them…
These results corroborate with the results from previous studies, which have shown 84% of genes to be expressed in the adult human brain …
Negi, S. K., & Guda, C. (2017). Global gene expression profiling of healthy human brain and its application in studying neurological disorders. Scientific Reports, 7(1). doi:10.1038/s41598-017-00952-9
“Normal people can have extraordinary abilities. Prof. Haier writes about a non-savant who used memory techniques to memorize 67,890 digits of π! He also notes that chess grandmasters have an average IQ of 100; they seem to have a highly specialized ability that is different from normal intelligence. Prof. Haier asks whether we will eventually understand the brain well enough to endow anyone with special abilities of that kind.”
Evidence that intelligence is not related to expertise.
“It is only after a weight of evidence has been established that we should have any degree of confidence in a finding, and Prof. Haier issues another warning: “If the weight of evidence changes for any of the topics covered, I will change my mind, and so should you.” It is refreshing when scientists do science rather than sociology.”
Even with the “weight of evidence”, most people will not change their views on this matter.
“Once it became possible to take static and then real-time pictures of what is going on in the brain, a number of findings emerged. One is that intelligence appears to be related to both brain efficiency and structure”
Patterns of activation in response to various fluid reasoning tasks are diverse, and brain regions activated in response to ostensibly similar types of reasoning (inductive, deductive) appear to be closely associated with task content and context. The evidence is not consistent with the view that there is a unitary reasoning neural substrate. (p. 145)
Nisbett R. E., Aronson J., Blair C., Dickens W., Flynn J., Halpern D. F., Turkheimer E. Intelligence: New findings and theoretical developments. American Psychologist. 2012;67:130–159. doi: 10.1037/a0026699.
“Early findings suggested that smart people’s brains require less glucose—the main fuel for brain activity—than those of dullards.”
Cause and correlation aren’t untangled; they could be answering questions in a familiar format, for instance, and this could be why their brains show less glucose consumption.
“It now appears that grey matter is where “thinking” takes place, and white matter provides connections between different areas of grey matter. Some brains seem to be organized with shorter white-matter connections, which appear to allow more efficient communication, and there seem to be sex differences in the ways the part of the brain are connected. One of the effects of aging is deterioration of the white-matter connections, which reduces intelligence.”
Read this commentary (pg. 162): Norgate, S., & Richardson, K. (2007). On images from correlations. Behavioral and Brain Sciences, 30(02), 162. doi:10.1017/s0140525x07001379
“Brain damage never makes people smarter”
This is wrong:
You would think that cutting out one-half of people’s brains would kill them, or at least leave them vegetables needing care for the rest of their lives. But it does not. Consider this striking story. A boy starts having seizures at 10 years of age when his right cerebral hemisphere atrophies. By the time he is 12, the left side of his body is paralyzed. When he is 19, surgeons decide to operate and remove the right side of his brain, as it is causing gits in his intact left one. You might think this would lower his IQ or leave him severely retarded, but no. His IQ shoots up 14 points, to 142! The mystery is not so great when you realize that the operation has gotten rid of the source of his fits, which had previously hampered his intelligence. When doctors saw him 15 years later, they described him as “having obtained a university diploma . . . [and now holding] a responsible administrative position with a local authority.”
Skoyles, J. R., & Sagan, D. (2002). Up from dragons: the evolution of human intelligence. New York: McGraw-Hill (pg. 282)
“Prof. Haier wants a concerted effort: “What if a country ignored space exploration and announced its major scientific goal was to achieve the capability to increase every citizen’s g-factor [general intelligence] by a standard deviation?””
Don’t make me laugh. You need to prove that ‘g’ exists first. Glad to see some commentary on epigenetics that isn’t bashing it (it is a real phenomenon, though the scope of it in regards to health, disease and evolution remains to be discovered).
As most readers may know, I’m skeptical here and a huge contrarian. I do not believe that g is physiological and if it were then they better start defining it/talking about it differently because I’ve shown that if it were physiological then it would not mimick any known physiological process in the body. I eagerly await some good neuroscience studies on IQ that are robust, with large ns, their conclusions show the arrow of causality, and they’re not just making large sweeping claims that they found X “just because they want to” and are emotionally invested in their work. That’s my opinion about a lot of intelligence research; like everyone, they are invested in their own theories and will do whatever it takes to save face no matter the results. The recent Amy Cuddy fiasco is the perfect example of someone not giving up when it’s clear they’re incorrect.
I wish that Mr. Taylor would actually read some of the literature out there on TBI and IQ along with how people with chunks of their brains missing can have IQs in the normal range, showing evidence that most a lot of our brain mass is redundant. How can someone survive with a brain that weighs 1.5 pounds (680 gms) and not need care for the rest of his life? That, in my opinion, shows how incredible of an organ the human brain is and how plastic it is—especially in young age. People with IQs in the normal range need to be studied by neuroscientists because anomalies need explaining.
If large brains are needed for high IQs, then how do these people function in day-to-day life? Shouldn’t they be ‘as dumb as an erectus’, since they have erectus-sized brains living in the modern world? Well, the human body and brain are two amazing aspects of evolution, so even sudden brain damage and brain removal (up to half the brain) does not show deleterious effects in a lot of people. This is a clue, a clue that most of our brain mass after erectus is useless for our ‘intelligence’ and that our brains must have expanded for another reason—family structure, sociality, expertise, etc. I will cover this at length in the future.
Racial Differences in Physical Activity and Acquisition of Coronary Artery Calcification
1200 words
Last week a study was published stating that white men who exercised 3 times the recommendation of 1.5 hours (450 minutes, 7.5 hours) had a higher chance of getting coronary artery calcification (CAC), which is the accumulation of plaque and calcium in the arteries of the heart. You, of course see news headlines such as: “Physically active white men at high risk for plaque buildup in arteries“; “White Men Who Exercise Every Day Have 86 Per Cent Higher Risk of Heart Disease Than Black Men, Study Claims“; “Excessive Exercise May Harm The Heart, Study Suggests “; “Excessive exercise increases risk of arterial plaque buildup in white men“; (and my personal favorite headline about this study): “You can exercise yourself to death, says new study“. People just passing by and reading the title (like most do) may then conclude that “they’re saying not to exercise because of CAC.” No, this is not what they are saying at all.
The Coronary Artery Risk Development in Young Adults (CARDIA) study is one of the most important studies in the study of coronary heart disease that have been undertaken. It is a sample of men and women, about equal numbers of each race, from Birmingham, Alabama; Chicago, Illinois; Minneapolis, Minnesota; and Oakland, California. The study began in 1985-86 and there were follow-up examinations at “1987-1988 (Year 2), 1990-1991 (Year 5), 1992-1993 (Year 7), 1995-1996 (Year 10), 2000-2001 (Year 15), 2005-2006 (Year 20), 2010-2011 (Year 25), and 2015-2016 (Year 30).” The CARDIA website writes:
Data have also been collected on physical measurements such as weight and body composition as well as lifestyle factors such as dietary and exercise patterns, substance use (tobacco and alcohol), behavioral and psychological variables, medical and family history, and other chemistries (e.g., insulin).
So there is a goldmine of information to be gleaned from this data. The study that is getting press in the news uses data from this cohort.
The study
The study is titled 25-Year Physical Activity Trajectories and Development of Subclinical Coronary Artery Disease as Measured by Coronary Artery Calcium by Laddu et al (2017). They studied three cohorts by the amount of time they exercised per week: below requirement, at requirements, or above requirements. It is recommended to exercise at least 150 minutes per week.
There were 3,175 men and women who participated in the CARDIA study between 1985 and 2011 who had CAC data available for 25 years. About 47.4 percent of the sample was black, with 56.6 being women. The cohort “consisted of 18.9% black men, 24.6% white men, 28.6% black women, and 28.0% white women” (Laddu et al, 2017).
Of the three activity levels they studies (below 150 minutes, 150 minutes, and over 150 minutes), they observed that white men who exercised 3 times the weekly recommendation (150 minutes(3)= 450 minutes=7.5 hours) had a higher chance of developing CAC. It’s worth noting that exercise time was self-reported (which is the only way I can see how something like this would work, are you supposed to follow people with a camera every day to see how long they engage in physical activity?).
In regards to the physical activity measurement, Laddu et al (2017) write:
At each of the 8 examinations, self-reported leisure-time PA was ascertained by the interviewer-administered CARDIA Physical Activity History Questionnaire.17 Participants were asked about the frequency of participation in 13 specific categories (8 vigorous intensity and 5 moderate intensity) of recreational sports, exercise, home maintenance, and occupational activities during the previous 12 months. Intensity for each activity was expressed as metabolic equivalents (METs), in which 1 MET is defined as the energy expended at rest, which is approximately equivalent to an oxygen consumption of 3.5 mL per 1 kg of body weight per minute.18Vigorous activities (≥6 METs) included running or jogging; racquet sports; biking; swimming; exercise or dance class; job lifting, carrying, or digging; shoveling or lifting during leisure; and strenuous sports. Moderate-intensity activities (3-5 METs) included nonstrenuous sports, walking and hiking, golfing and bowling, home exercises or calisthenics, and home maintenance or gardening.19 Each activity was scored according to whether it was performed for 1 hour or longer during any 1 month during the past year, the number of months it was performed at that level, and the number of months the activity was performed frequently. Each activity was then assigned an intensity score, ranging from 3 to 8 METs, and a duration threshold (ranging from 2-5 hours per week), above which participation was considered to be frequent.20
This is a good metric; though I would like to see a study that looks at just gym-going activity and death, time spent in the gym strength training/moderate to intense cardio. Nevertheless, white men who reported more physical activity had a higher chance of acquiring CAC. Though I can see people’s recall being hazy, people over/under reporting, etc etc.
White men who exercised 7.5 hours per week were 27 percent more likely to get CAC, whereas blacks who exercised that much were at no greater risk to acquire CAC when compared to whites (7.5 hours of exercise compared to less than 2.5 hours per week). Black women who exercised less than the recommendations had a higher chance of acquiring CAC. The researchers couldn’t ascertain why white men who exercised three times the recommendations had such a higher chance of acquiring CAC by the time they reached middle age, but Dr. Jamal Rana says “however this plaque buildup may well be of the more stable kind, and thus less likely to rupture and causes heart attack, which was not evaluated in this study.” The head author, Dr. Deepika Laddu also reiterated: “it does not suggest that anyone should stop exercising.” So people who just read these click bait headlines who say “They’re telling whites not to exercise!”, you’re wrong and you should read papers and not news articles.
This is the perfect example of people reading click baity, fear-mongering headlines and running with it. I saw some people saying “They’re telling us not to exercise!” No. If you were to read the paper and any serious news articles on the matter, you’d see that they do not recommend that people do not exercise. Now the question is, why do whites who exercise more than 7.5 hours per week have a higher chance of acquiring heart disease? I can think of a few explanations (though they are not satisfactory): 1) genes: which genes? Why? How do they interact with the body over time to lead to arterial calcification?; 2) dietary habits: I’d like to know what their diet was like and see their macro composition, carbohydrates, not saturated fat, causes heart disease (Siri-Tirino et al, 2010; de Souza et al, 2015) so that may be a huge contributing factor.
Nevertheless, this is yet another physiological race difference. Oddly enough, black men are more likely than white men to have hypertension (Hicken et al, 2013).
Even though black men, on average, have higher rates of hypertension than white men, white men who are physically active for 7.5 had a higher chance of acquiring CAC than those who exercised less than 2.5 hours per week. This effect wasn’t seen in black men who had physical activity at that level, which, of course, implies that differences in genes and SES underlie this difference. I await more papers into this matter into the mechanisms of how and why this occurs and will ruminate on this myself in the future. No, this study does not tell white men not to exercise.
Small Brain, Normal IQ
1650 words
Emil Kirkegaard left a short commentary on John Skoyles’ 1999 paper Human Evolution Expanded Brains to Increase Expertise Capacity, not IQ, in which Emil writes in his article Evolution and imperfect mediators:
If we condense the argument, it becomes a little clearer:
John Skoyles (1999) [Condensed argument from Emil; paragraph 2] Brain expansion causes problems. Thus, whatever selected for increased brain size must have offered compensating benefits. People can have below average size brains yet exhibit normal intelligence. Thus, the compensating benefit offered by large brains is unlikely to be intelligence. Why should evolution have increased brain size with its associated problems for something smaller sized brains could have without expansion?
I merely edited out the unnecessary parts. Now try substituting some other trait, say fighting ability and some mediator of it.
Muscle size increases causes problems. Thus, whatever selected for increased muscle size must have offered compensating benefits. People can have below average size muscles yet exhibit normal fighting ability. Thus, the compensating benefit offered by large muscles is unlikely to be fighting ability. Why should evolution have increased muscle size with its associated problems for something smaller sized muscles could have without increase?
See the issue? This argument works for any imperfect physical underpinning of a trait, which is to say, basically all of them. Longer legs didn’t evolve for running well for some people with short legs run well. Bigger/stronger hears didn’t evolve for better cardio, because some people smaller/weaker hearts have good cardio. Longer arms didn’t evolve for fighting because some short armed people fight well. Darker skin didn’t evolve as a protection against sun exposure for some relative light skinned people don’t get skin cancer or sunburns. Larger eyes didn’t evolve for seeing better for some people with smaller eyes see well. Bigger ears… Bigger noses… Stronger hands… …
I don’t agree. Our brains sap about 20 percent of our daily energy needs while being 2 percent of our overall body mass whereas, in other primates, their brains cost about 9 percent of their daily energy needs (Fonseca-Azevedo and Herculano-Houzel, 2012).
In regards to Emil’s counterarguments, I’ll address them one by one:
Long legs: People with longer legs were better runners and could escape from predators and chase prey. People with shorter legs were killed.
Bigger/stronger hearts: Those with a larger heart (sans cardiomegaly) could run for longer distance (remember, we are distance runners; Carrier, 1984; Skoyles and Sagan, 2002; Bramble and Lieberman, 2004; Mattson, 2012) and so long legs and bigger/stronger hearts tie in with each other.
Long arms: This, again, goes back to our morphology in Africa. Long limbs are more conducive to heat dissipation (Lieberman, 2015). So those who had the right body plan for distance running could survive better during our evolutionary history.
Dark skin: A light-skinned person who spends enough time without protection in a tropical climate will develop skin cancer. (It is hypothesized that skin cancer is what caused the evolution of dark skin; Greaves, 2014, though this was contested by Jablonksi and Chaplin, 2014.)
Large eyes: Bigger eyes don’t mean better eyesight in comparison to smaller ones.
All in all, the brain size argument is 100 percent different from these arguments: large brains come with large problems. Further, there is evidence (which will be reviewed below) that people can live long, normal lives with half of their brain missing
The brain-size/IQ puzzle
The oft-repeated wisdom is that our brains evolved to such a large size so we could become more intelligent. And looking at when our brains began to increase (starting with erectus, which had to do with the advent of cooking/fire use), we can see that that’s when our modern body plan appeared. We can ascertain this by looking at Nariokotome boy, an erectus that lived about 1.6 mya.
Further, in regards to brain size, there was a man named Daniel Lyon. What was so extraordinary about this man is that, at the time of his death, had a brain that weighed 1.5 pounds (see Wilder, 1911)! Skoyles and Sagan (2002: 239) write:
Upon examination, anatomists could find no difference between it [Lyon’s brain] and other human brains apart from its size with one exception: The part of his brain attached to the brainstem, the cerebellum, was near normal size. Thus, the total size of Lyon’s cerebral hemisphere was smaller than would be suggested by a total brain weight of 1.5 lb. We do not know how bright he was—being a watchman is not particularly intellectually demanding—but he clearly was not retarded. A pound and a half brain may not be enough to manage a career as an attorney, a professor of theology, or a composer, but it was sufficient to let Lyon survive for 20 years in New York City.
Skoyles and Sagan (2002) review numerous lines of evidence of individuals with small brains/people with severe TBI living full lives, even having IQs in the average/above average range. They write (pg 238):
You would think that cutting out one-half of people’s brains would kill them, or at least leave them vegetables needing care for the rest of their lives. But it does not. Consider this striking story. A boy starts having seizures at 10 years of age when his right cerebral hemisphere atrophies. By the time he is 12, the left side of his body is paralyzed. When he is 19, surgeons decide to operate and remove the right side of his brain, as it is causing gits in his intact left one. You might think this would lower his IQ or leave him severely retarded, but no. His IQ shoots up 14 points, to 142! The mystery is not so great when you realize that the operation has gotten rid of the source of his fits, which had previously hampered his intelligence. When doctors saw him 15 years later, they described him as “having obtained a university doploma . . . [and now holding] a responsible administrative position with a local authority.” (18)
They also write about the story of an Argentinian boy who had a right hemispherectomy when he was 3-years-old who was notable for “the richness of his vocabulary and syntax” and also “attends English classes at school, in which he attains a high level of success (20; quote from Skoyles and Sagan, 2002: 238).
It is also a “medical myth that microcephaly (having a head smaller than two standard deviations (SD) below average circumference) is invariably linked to retardation.” (Skoyles and Sagan, 2002: 239).
There are some important things to be noted in regards to the study of Nariokotome boy’s skeleton and skull size. Skoyles and Sagan (2002: 240) write (emphasis mine):
So how well equipped was Homo erectus? To throw some figures at you (calculations shown in the notes), easily well enough. Of Nariokotome boy’s 673 cc of cortex, 164 cc would have been prefrontal cortex, roughly the same as half-brained people. Nariokotome boy did not need the mental competence required by cotemporary hunter-gatherers. … Compared to that of our distant ancestors, Upper Paleolithic technology is high tech. And the organizational skills used in hunts greatly improved 400,000 years ago to 20,000 years ago. These skills, in terms of our species, are recent, occurring by some estimates in less than the last 1 percent of our 2.5 million year existence as people. Before then, hunting skills would have required less brain power, as they were less mentally demanding. If you do not make detailed forward plans, then you do not need as much mental planning abilities as those who do. This suggests that the brains of Homo erectus did not arise for reasons of survival. For what they did, they could have gotten away with much smaller, Daniel Lyon-sized brains.
Lastly, I will touch on the fact that since we are running apes, that we need a narrow pelvis. As I stated above, our modern body plan came to be around 1.6 mya with the advent of erectus, which could be inferred from footprints (Steudel-Numbers, 2006; Bennett et al, 2009). Now the picture is beginning to become clearer: if people with brains the size of erectus could have intelligence in the modern range, and if our modern body plans evolved 1.6 mya (which is when our brains began to really increase in size due to metabolic constraints being unlocked due to erectus’ cooking ability), then you can see that it’d be perfectly possible for modern Homo sapiens to have brains the size of erectus while still having an IQ in the normal range.
Lastly, Skoyles and Sagan (2002: 245) write (emphasis mine):
Kanzi seems to do remarkably well with a chimp-sized brain. And while we tend to link retardation with small brains, we have seen that people can live completely normal lives while missing pieces of their brains. Brain size may enhance intelligence, but it seems we can get away without 3 pounders. Kanzi shows there is much potential in even 13 oz.
So Skoyles and Sagan do concede that brain size may enhance intelligence, however, as they have argued (and as Skoyles does in his 1999 paper), it is perfectly possible to live a normal life with half a brain, as well as have an average/above average IQ (as reviewed in Skoyles, 1999). So if people with erectus-sized brains can have IQs in the normal range and live normal lives, then brains must have increased for another reason, which Skoyles has argued is expertise capacity.
Large brains are, clearly, not needed for high IQs.
(Also search for this paper: Reiss, A. L., Abrams, M. T., Singer, H. S., Ross, J. L. & Denckla, M. B. (1996). Brain development, gender and IQ in children: A volumetric imaging study. Brain, 119, 1763-1774. where they show that there is a plateau, and a decrease in IQ in the largest brains; see table 2. I also reviewed some studies on TBI and IQ and how even those with severe TBI can have IQs in the normal range (Bigler, 1995; Wood and Rutterford, 2006; Crowe et al, 2012). Yet more evidence that people with half of their brains missing can lead normal lives and have IQs in the modern range.)
More Than A Few Teeth Are Needed to Rewrite Human Evolutionary History
1700 words
10/26/17 update:
Dr. Julian Benoit (who also commented on the previous findings on Graecopithecus back in May) has now commented on this finding, writing in his article The theory that humans emerged in Africa is often questioned. That’s good for science:
The most recent piece of research that seeks to stake Europe’s claim as human ancestors’ birthplace centres on two teeth: a canine and a molar. This find was greeted with some excitement outside expert circles.
But scientists have responded sceptically. Palaeoprimatologists around the world have shown that the molar is not from a representative of the human family. Teeth in mammals, including humans, are very distinctive between species. The molar from Germany is simply too dissimilar from those of the earliest African hominins. It looks more like a molar belonging to Anapithecus, a typically European species of fossil primates. These scientists have also argued that the “canine” is actually a fragment of a tooth from an antelope-like herbivorous animal.
In all three cases, the new evidence raised questions about the African origin of hominins and was critically evaluated. For now, these studies can’t be considered convincing enough to “rewrite human history” – as some excited press releases claimed. But there is no doubt that more studies of the nature will follow, again and again.
A few days ago it was announced that a few teeth were discovered in Germany which were about 9.7 million years old—about 4 million years older than the oldest hominin teeth discovered in Africa. Of course, you get click-baity mainstream news titles like Archaeology fossil teeth discovery in Germany could re-write human history. Who was the one who said that this finding ‘could rewrite human history’? The mayor of the town it was discovered in:
In the press conference announcing the find, Mainz Mayor Michael Ebling claimed the find would force scientists to reconsider the history of early mankind.
“I don’t want to over-dramatize it, but I would hypothesize that we shall have to start rewriting the history of mankind after today,” Ebling was quoted as saying.
That a mayor’s statement, who I presume has no scientific background, is being put into news titles that human history may need revision shows the low-quality of mainstream news articles when they report on new scientific findings.
There are a few problems with these claims that ‘human history needs to be rewritten’ due to a few teeth. Back in May, I covered how the finding that Graecopithicus Freybergi had a 4th molar ‘similar’ to us and was, therefore, a part of our species was incorrect and that we needed way more evidence than a few teeth and a jawbone. The same holds for these findings.
The researchers stated that they hesitated a year to publish the findings. I don’t see why; the only reason I can think of is because they believed that the finding was not ‘PC’ and therefore waited to publish their results (kind of like when Robert Putnam waited to publish his findings on diversity and social trust). However, this does not mean that the OoA hypothesis is debunked and that Europe is the home of Mankind.
However, other experts in the field say that this ‘hardly’ has us rethinking our view of human evolution. Only two teeth were discovered, and as National Geographic reported paleoanthropologist Ben Viola said by e-mail:
“I think this is much ado about nothing,” he says by email. “The second tooth (the molar), which they say clearly comes from the same individual, is absolutely not a hominin, [and] I would say also not a hominoid.”
Most of the experts contacted by National Geographic stated that the teeth looked like they belonged to pliopithecids, with Luntz’s team acknowledging that the tooth looked like it belonged to anapithecus, which is a primate that lived in Hungary and Austria around 10 million years ago. The molar is important, not because it shows that human ancestors evolved in Europe but because it would validate the fact that a femur found in the 1820s in Eppelsheim belonged to a pliopithecid and not a hominoid, says paleoanthropologist David Begun:
“The ‘canine’ looks to me like a piece of a ruminant tooth,” Begun says by email. Ruminants are cud-chewing, plant-eating mammals such as cows and sheep. “It has a funny break that makes it look a bit like a canine, but it is definitely not a canine, nor is it [from] a primate.”
David Begun also writes:
“The molar is important, because it validates an idea proposed by several researchers that a femur known from Eppelsheim since the 1820s actually does most likely belong to a pliopithecoid and not a hominoid,” says Begun.
Begun also says that the tooth looks like a ‘ruminant tooth’ (ruminant teeth being used to chew cud) and that “It has a funny break that makes it look a bit like a canine, but it is definitely not a canine, nor is it [from] a primate.”
So, as usual, such weak evidence being touted such as this has huge problems and the evidence that is being touted to rewrite human evolutionary history actually shows something completely opposite.
There are a few problems for the claim that human evolution needs to be rewritten based off of these findings:
- The paper is not peer-reviewed yet: Some may say that this shouldn’t matter, however, as I’ve shown from the few bits of peer commentary that I am able to find about this, a lot of people in the field have a few hangups about who the teeth belonged to and whether or not they belonged to members of our genus.
- You need more than two teeth to rewrite human evolutionary history: Since when are two teeth enough to say that human evolution needs a rewrite? Just like the findings back in May, this does not mean that we need to rethink human evolutionary history. You would need more than a few teeth to prove that Man began outside of Africa, just like you would need more than a few teeth to prove that man began IN Africa.
- The head researcher Herman Luntz was interviewed by Research Gate and he said:
RG: Can you say already what this find will mean for our understanding of human history?
Lutz: We want to hold back on speculation. What these finds definitely show us is that the holes in our knowledge and in the fossil record are much bigger than previously thought. So we’ve got the puzzle of having finds that, in terms of the expected timeline, don’t fit the region we found them in. We’ve got two teeth from a single individual. That means there must have been a whole population. It wouldn’t have been just one, all alone like Robinson Crusoe. So the question is, if we’re finding primate species all around the Mediterranean area, why not any like this? It’s a complete mystery where this individual came from, and why nobody’s ever found a tooth like this somewhere before.
So, of course, he wants to hold back on speculation, because he knows that you cannot make these great proclamations that human history needs to be rewritten due to two teeth—contrary to what the mayor of Mainz, Germany Michael Ebling claimed (a non-scientist). News outlets then take that statement and run with it, despite the caution from Luntz the head researcher of the study, the fact that it’s yet to pass peer review, and the fact that other researchers in the field have other things to say about it other than the fact that it may be a hominoid.
In the paper, Luntz et al (2017) write:
The relative size of the canine, i.e. the ratio of the buccal heights of C and M1, is similar to those of e.g. Dryopithecus sp., Ankarapithecus meteai but also Ardipethcus ramidus. Both, reduced size and shape of the canine likely largely indicate that the new species from Eppelsheim had lost a honing (C/p3) complex already ca. 9.7 Ma ago. From all information gathered up to now, the question arises, if the newly discovered Eppelsheim species may be related to members of the African hominin tribe.
Well the answer, according to others in the field, is that it belongs to a pliopithecid species, not a hominin. They, of course, claim that it bears a close resemblance to hominin teeth.
Of course, the two primates could have faced similar evolutionary pressure leading to convergence of traits. If the climate in one area is the same as in another area, then convergence of traits between two similar species is possible. This could also account for the similarities in teeth between this species (whatever it is) and hominins.
We’re going to need more than two teeth to rewrite human evolution. We’re going to need more than a jawbone to rewrite human evolution. The teeth that were discovered last year in Germany will need to go through a longer process to be shown to belong to a hominin species—because all of the evidence that we currently have about it points to it being a part of a priopithecus species—not a hominin species.
I recommend people wait and see/do some digging into claims from news articles that purport to show that human evolution needs ‘rewriting’, because, as you can see, this time the claim came from a governor of the town the teeth were found in. The teeth discovered look like they may be similar to species from early in our genus, however other experts in the field urge extreme caution in any interpretation of what they mean and who they belong to. Just like with the Graecopithcus case back in May, it seems to belong to another species of ape—though this one could be more closely related to us. No, this finding does not show that human evolution needs rewriting. I wish news agencies would set a higher standard of quality for their titles; but they are just trying to get clicks and will publish the most click-baity title possible. You’ll need more than a few teeth and jawbone to say that Man did not evolve in Africa, when all of the evidence we currently have points to Africa as the origin of Mankind.
Evidence for Natural Selection in Humans: East Asians Have Higher Frequency of CASC5 Brain Size Regulating Gene
1500 words
Brain size is one physical difference that the races differ on. East Asians have bigger brains than Europeans who have bigger brains than Africans (Beals et al, 1984; Rushton, 1997). What caused these average differences and the ultimate causes for them have been subject to huge debate. Is it drift? Natural/sexual selection? Mutation? Gene flow? Epigenetic? One reason why brains would need to be large in colder climates is due to heat retention, while in tropical climates heads need to be smaller to dissipate heat. One of the biggest criticisms of HBD is that there is no/little evidence of recent natural selection between human races. Well, that has changed.
CASC5 “performs two crucial functions during mitosis, being required for correct attachment of chromosome centromeres to the microtubule apparatus, and also essential for spindle-assembly checkpoint (SAC) signaling” (Shi et al, 2016). The gene has been found to be important in recent human evolution along with neurogenesis.
Shi et al (2016) genotyped 278 Han Chinese (174 females and 104 males with a mean age of 36) who were free of maladies or genetic defects. They had the coding sequences of CASC5 for humans, chimpanzees, gorillas, baboons, gibbons, orangutans, tarsiers, Denisovans, and Neanderthals. They downloaded genotypes from the Human Genome Project for their analysis.
They compared CASC5 among three human species: humans, Neanderthals, and Denisovans. Using chimpanzees as an outgroup, they discovered 45 human-specific mutations, 48 Neanderthal-specific mutations, and 41 Neanderthal-specific mutations. Further, when one exon region was aligned among modern humans, non-human primates and other mammalian species, 12 amino acid sites showed divergence between modern humans, Neanderthals, and Denisovans with 8 occurring in modern humans. Of the 8 sites in humans, 6 are preserved which implies that they were important in our evolutionary history.
Shi et al (2016) write:
At the population level, among the 8 modern human amino acid changes, two (H159R and G1086S) are fixed in current human populations, and the other six are polymorphic Fig. 1). Surprisingly, 5 of the 6 amino acid polymorphic sites showed deep between-population divergence in allele frequencies. East Asians possess much higher frequencies of the derived alleles at four sites (T43R-rs7177192, A113T-rs12911738, S486A-rs2412541 and G936R-rs8040502) as compared to either Europeans or Africans (Fig. 1), while E1285K-rs17747633 is relatively enriched in Europeans (46%), and rare in East Asians (10%) and Africans (3%). No between-population divergence was observed for T598 M-rs11858113 (Fig. 1).
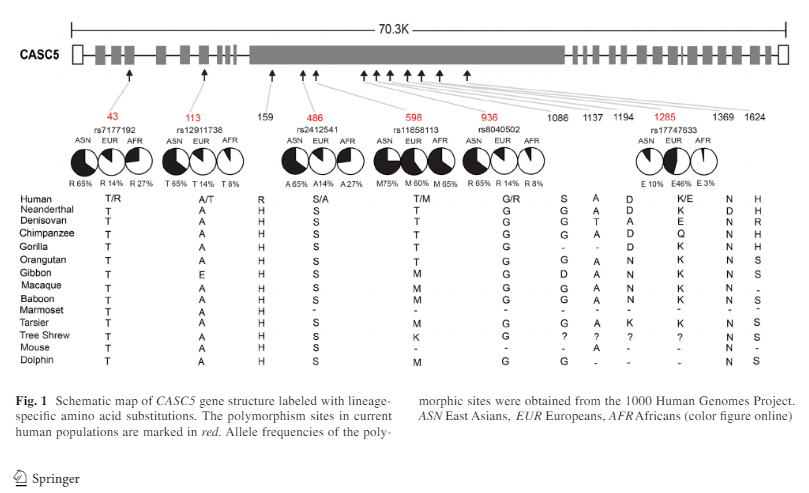
So East Asians have a much higher frequency of this derived trait. This is direct evidence for natural selection in recent human evolution in regards to the physical structure of the brain.
Since most of the amino acid polymorphic sites showed between-population divergence, they decided to analyze the three classical races using 1000 genomes. The variation between the races could be due to either genetic drift or natural selection. When they analyzed certain gene regions, they observed a signal of positive selection for East Asians but not Europeans or Africans. They further tested this selection signal using “the standardized integrated haplotype score (iHS) which is used for detecting recent positive selection with incomplete sweep (i.e. the selected allele is not yet fixed)” (Shi et al, 2016). Using this method, they discovered a few SNPs with large iHS values in Europeans (7 SNPs at 4.2 percent) and none in Africans.
They also conducted a genome-wide scan of Fst, iHS, and “XPCLR (searching for highly differentiated genomimc regions as targets of selective sweeps)” (Shi et al, 2016). Several SNPs had high Fst, iHS and XPCLR scores, which indicate that these alleles have been under positive selection in East Asians. Among the fixed amino acid sites in human populations, East Asians showed 5, Europeans showed 1, and Africans showed 0 which, the authors write, “[imply] that these amino acid changes may have functional effects” (Shi et al, 2016). Furthermore, using the HDGP, they obtained the frequency of the 6 amino acid sites in 53 populations. This analysis showed that 4 of the 6 amino acid sites are “regionally enriched in East Asia .. in line with the suggested signal of population-specific selection in this area” (Shi et al, 2016).
Then, since CASC5 is a brain size regulating gene, they looked for phenotypic effects. They recruited 167 Han Chinese (89 men, 178 women) who were free of maladies. They genotyped 11 SNPs and all of the frequencies followed Harvey-Weinberg Equilibrium (which states that allele and genotype frequencies will remain constant in a population from generation to generation in the absence of evolutionary pressures; Andrews, 2010). In the female sample, 5 regions were related to gray matter volume and four were on the amino acid polymorphic sites. Interestingly, the four alleles which showed such a stark difference between East Asians and Europeans and Africans showed more significant associations in Han Chinese females than males. Those carrying the derived alleles had larger brain volumes in comparison with those who had the ancestral alleles, implying recent natural selection in East Asia for brain size.
Shi et al (2015) also attempted two replications on this allele writing:
We further conducted a replication analysis of the five significant CAC5 SNPs in two other independent Han Chinese samples (Li et al. 2015; Xu et al. 2015). The results showed that three SNPs (rs 7177192, rs11858113 and rs8040502) remained significant in Replication-1 for total brain volume and gray matter volume (Xu et al. 2015), but no association was detected in Replication-2 (Li et al. 2015) (Table S4).
It is very plausible that the genes that have regulated brain growth in our species further aid differences in brain morphology within and between races. This effect is seen mostly in Han Chinese girls. Shi et al (2016) write in the Discussion:
If this finding is accurate and can be further verified, it suggests that that [sic] after modern humans migrated out of Africa less than 100,000 years ago, the brain size may still be subject to selection.
I do believe it is accurate. Of course, the brain size could still be subject to selection; there is no magic field shielding the brain against selection pressure. Evolution does not stop at the neck.
So Shi et al (2016) showed that there were brain genes under recent selection in East Asians. What could the cause be? There are a few:
- Climate: In colder climates you need a smaller body size and big brain to survive the cold to better thermoregulate. A smaller body means there is less surface area to cover, while a larger head retains heat. It, obviously, would have been advantageous for these populations to have large brains and thus get selected for them—whether by natural or sexual selection. This could also have to do with the fact that one needs bigger eyes in colder environments, which would cause an increase in the size of the brain for the larger eyes, as well as being sharper visio-spatially.
- Intelligence: East Asians in this study showed that they had high levels of gray matter in the skull. Further, large brains are favored by an intermediately challenging environment (Gonzalez-Forero, Faulwasser, and Lehmann, 2017).
- Expertise: I used Skoyle’s (1999) theory on expertise and human evolution and applied it to racial differences in brain size and relating it to the number of tools they had to use which differed based on climate. Now, of course, if one group uses more tools then, by effect, they would need more expertise with which to learn how to make those tools so large brains would be selected for expertise—especially in novel areas.
- Vision: Large brains mean large eyes, and people from cold climates have large eyes and large brains (Pearce and Dunbar, 2011). Decreasing light levels select for larger eye size and visual cortex size in order to “increase sensitivity and maintain acuity“. Large eyeballs mean enlarged visual cortices. Therefore, in low light, large brains and eyes get selected for so one can see better in a low light environment.
Of course, all four of the examples below could (and probably do) work in tandem. However, before jumping to conclusions I want to see more data on this and how the whole of the system interacts with these alleles and these amino acid polymorphic sites.
In sum, there is now evidence for natural selection on East Asians (and not Africans or Europeans) that favored large brains, particularly gray matter, in East Asians with considerable sexual dimorphism favoring women. Four of the genes tested (MCPH1, ASPM, CDK5RAP2, and WDR62) are regulated by estradiol and contribute to sexual dimorphism in human and non-human primates (Shi et al, 2016). Though it still needs to be tested if this holds true for CASC5.
This is some of the first evidence that I have come across for natural selection on genes that are implicated in brain evolution/structural development between and within populations. It does show the old “Rushton’s Rule of Three“, that is, Mongoloids on top, Caucasians in the middle, and Negroids on bottom, though Caucasians were significantly closer to Africans than Mongoloids in the frequency of these derived alleles. I can see a HBDer going “They must be related to IQ”, I doubt it. They don’t ‘have’ to be related to IQ. It just infers a survival advantage in low light, cold environments and therefore it gets selected for until it reaches a high frequency in that population due to its adaptive value—whether spreading by natural or sexual selection.
The Harmattan season.
By Afrosapiens, 555 words.

Harmattan haze in Niger.
The Harmattan season is a little known feature of the climatic characteristics of the West African subcontinent. Similarly to a temperate climate winter, it occurs between November and March, 5 months during which the region experiences dry, hazy, and colder conditions due to Saharan dust particles brought by the Harmattan trade wind.
Although the Harmattan season is sometimes referred to as a West African winter with temperature commonly dropping to a low 7°C (45°F) during the night and in the morning, typical tropical temperatures ranging from 25°C to 35°C (77°F – 95°C) are experienced during the afternoon. The humidity rate is below 15% and the region experiences no rainfall during the season. More than the drought, the colder temperature and occasional dust storms and wildfires, the dusty Harmattan haze is what makes the West African winter challenging by significantly reducing visibility and causing several health problems such as asthma, meningitis, skin and eye conditions. From an evolutionary standpoint, it is possible that the Harmattan season has caused various anatomical adaptations affecting brain characteristics.

Despite the common hereditarian claim that Sub-Saharan Africans average smaller cranial capacities than Eurasians due to the warmer climates of tropical Africa, the few studies that I’ve come across regarding West Africa paint a significantly different picture. In a 2011 sample of North-Eastern Nigerian adults likely of Kanuri ethnicity, the reported average cranial capacity was 1424cc for males and 1331cc for females, which makes a total average of 1378cc. In a 2013 sample of 527 Igbos aged 14-20 from Anambra State (Southeastern Nigeria), the reported cranial capacities were 1411cc for males and 1443cc for females and a combined average of 1427cc. In another study of Southeastern Nigerians (year 2011), the reported values were closer to those usually claimed with an average of 1310cc among Edos, 1273cc among Igbos and 1256cc among Urhobos.
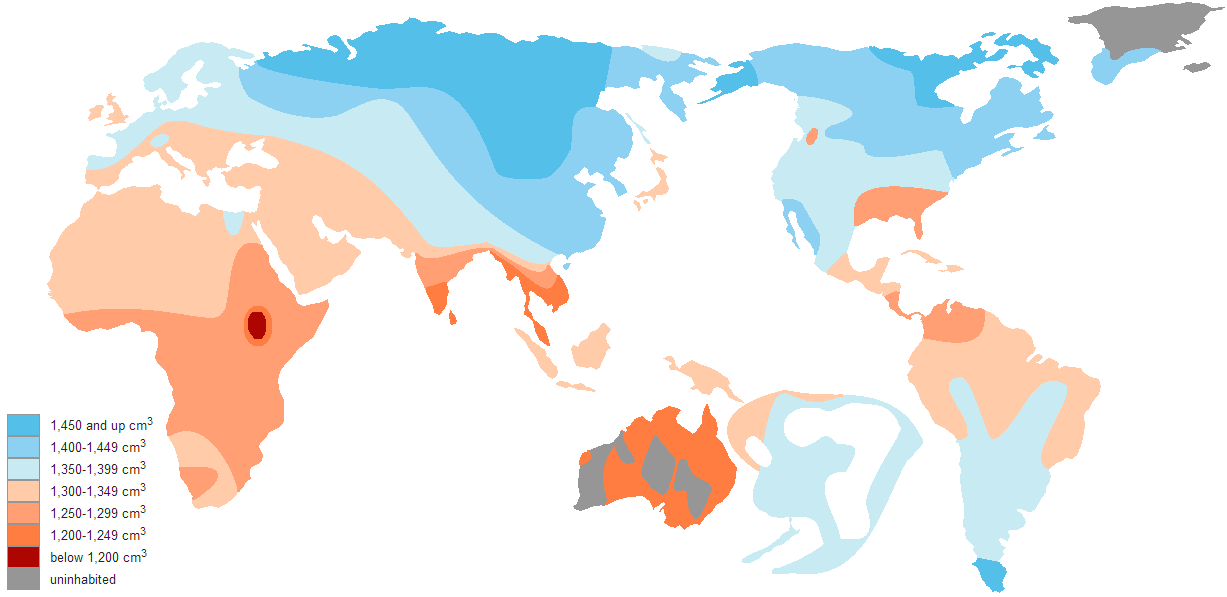
Beals et al.’s (1984) estimated distribution of cranial capacity.
Although these are only a few studies on West African cranial characteristics, they at least have the merit of being recent (less than 10 years old) and drawn from actual measurements on living persons contrary to Beals et al.’s 1984 reference study in which the West African values are inferred from simplistic climatic variables in the absence of actual skulls from the region. I have often shown these high cranial capacity West African samples as a refutation of the cold winter theory of brain size differences. And whereas hereditarian debaters have commonly dismissed them as meaningless exceptions to the rule, there is no scientific rule with unexplainable exceptions.

Harmattan haze in the Ghanaian countryside
In fact, judging from the competing and more generally accepted theory that brain size and eyeballs grow in adaptation to low light environments, the high cranial capacity, especially in Northern Nigerian samples, makes perfect sense if seen as an adaptation to the low visibility caused by the Harmattan haze from November to March. Unfortunately I wasn’t able to find any data on West African eye characteristics, I can only anecdotally mention a higher frequency of epicanthic fold among West Africans relative to other non-Mongoloid populations. I acknowledge that this post is somewhat speculative and based on poor data. Nevertheless, I write it as a warning to all the bloggers and “scholars” making up theories and inferences based on a poor understanding of the complexity of the world’s current and past climatic conditions.

Dakar, Senegal under the Harmattan Haze.
