
IQ and Construct Validity
1550 words
The word ‘construct’ is defined as “an idea or theory containing various conceptual elements, typically one considered to be subjective and not based on empirical evidence.” Whereas the word ‘validity’ is defined as “the quality of being logically or factually sound; soundness or cogency.” Is there construct validity for IQ tests? Are IQ tests tested against an idea or theory containing various conceptual elements? No, they are not.
Cronbach and Meehl (1955) define construct validity, which they state is “involved whenever a test is to be interpreted as a measure of some attribute or quality which is not “operationally defined.”” Though, the construct validity for IQ tests has been fleeting to investigators. Why? Because there is no theory of individual IQ differences to test IQ tests on. It is even stated that “there is no accepted unit of measurement for constructs and even fairly well-known ones, such as IQ, are open to debate.” The ‘fairly well-known ones’ like IQ are ‘open to debate’ because no such validity exists. The only ‘validity’ that exists for IQ tests is correlations with other tests and attempted correlations with job performance, but I will show that that is not construct validity as is classicly defined.
Construct validity can be easily defined as the ability of a test to measure the concept or construct that it is intended to measure. We know two things about IQ tests: 1) they do not test ‘intelligence’ (but they supposedly do a ‘good enough job’ so that it does not matter) and 2) it does not even test the ‘construct’ that it is intended to measure. For example, the math problem ‘1+1’ is construct valid regarding one’s knowledge and application of that math problem. Construct validity can pretty much be summed up as the proof that it is measuring what the test intends…but where is this proof? It is non-existent.
Richardson (1998: 116) writes:
Psychometrists, in the absence of such theoretical description, simply reduce score differences, blindly to the hypothetical construct of ‘natural ability’. The absence of descriptive precision about those constructs has always made validity estimation difficult. Consequently the crucial construct validity is rarely mentioned in test manuals. Instead, test designers have sought other kinds of evidence about the valdity of their tests.
The validity of new tests is sometimes claimed when performances on them correlate with performances on other, previously accepted, and currently used, tests. This is usually called the criterion validity of tests. The Stanford-Binet and the WISC are often used as the ‘standards’ in this respect. Whereas it may be reassuring to know that the new test appears to be measuring the same thing as an old favourite, the assumption here is that (construct) validity has already been demonstrated in the criterion test.
Some may attempt to say that, for instance, biological construct validity for IQ tests may be ‘brain size’, since brain size is correlated with IQ at .4 (meaning 16 percent of the variance in IQ is explained by brain size). However, for this to be true, someone with a larger brain would always have to be ‘more intelligent’ (whatever that means; score higher on an IQ test) than someone with a smaller brain. This is not true, so therefore brain size is not and should not be used as a measure of construct validity. Nisbett et al (2012: 144) address this:
Overall brain size does not plausibly account for differences in aspects of intelligence because all areas of the brain are not equally important for cognitive functioning.
For example, breathalyzer tests are construct valid. There is a .93 correlation (test-retest) between 1 ml/kg bodyweight of ethanol in 20, healthy male subjects. Furthermore, obtaining BAC through gas chromatography of venous blood, the two readings were highly correlated at .94 and .95 (Landauer, 1972). Landauer (1972: 253) writes “the very high accuracy and validity of breath analysis as a correct estimate of the BAL is clearly shown.” Construct validity exists for ad-libitum taste tests of alcohol in the laboratory (Jones et al, 2016).
There is a casual connection between what one breathes into the breathalyzer and his BAC that comes out of the breathalyzer and how much he had to drink. For example, for a male at a bodyweight of 160 pounds, 4 drinks would have him at a BAC of .09, which would make him unfit to drive. (‘One drink’ being 12 oz of beer, 5 oz of wine, or 1.25 oz of 80 proof liquor.) He drinks more, his BAC reading goes up. Someone is more ‘intelligent’ (scores higher on an IQ test), then what? The correlations obtained from so-called ‘more intelligent people’, like glucose consumption, brain evoked potentials, reaction time, nerve conduction velocity, etc have never been shown to determine higher ‘ability’ to score higher on IQ tests. That, too, would not even be construct validation for IQ tests, since there needs to be a measure showing why person A scored higher than person B, which needs to hold one hundred percent of the time.
Another good example of the construct validity of an unseen construct is white blood cell count. White blood cell count was “associated with current smoking status and COPD severity, and a risk factor for poor lung function, and quality of life, especially in non-currently smoking COPD patients. The WBC count can be used, as an easily measurable COPD biomarker” (Koo et al, 2017). In fact, the PRISA II test has white blood cell count in it, which is a construct valid test. Even elevated white blood cell count strongly predicts all-cause and cardiovascular mortality (Johnson et al, 2005). It is also an independent risk factor for coronary artery disease (Twig et al, 2012).
A good example of tests supposedly testing one thing but testing another is found here:
As an example, think about a general knowledge test of basic algebra. If a test is designed to assess knowledge of facts concerning rate, time, distance, and their interrelationship with one another, but test questions are phrased in long and complex reading passages, then perhaps reading skills are inadvertently being measured instead of factual knowledge of basic algebra.
Numerous constructs have validity—but not IQ tests. It is assumed that they test ‘intelligence’ even though an operational definition of intelligence is hard to come by. This is important, as if there cannot be an agreement on what is being tested, how will there be construct validity for said construct in question?
Richardson (2002) writes that Detterman and Sternberg sent out a questionnaire to a group of theorists which was similar to another questionnaire sent out decades earlier to see if there was an agreement on what ‘intelligence’ is. Twenty-five attributes of intelligence were mentioned. Only 3 were mentioned by more than 25 percent of the respondents, with about half mentioning ‘higher level components’, one quarter mentioned ‘executive processes’ while 29 percent mentioned ‘that which is valued by culture’. About one-third of the attributes were mentioned by less than 10 percent of the respondents with 8 percent of them answering that intelligence is ‘the ability to learn’. So if there is hardly any consensus on what IQ tests measure or what ‘intelligence’ is, then construct validity for IQ seems to be very far in the distance, almost unseeable, because we cannot even define the word, nor actually test it with a test that’s not constructed to fit the constructors’ presupposed notions.
Now, explaining the non-existent validity of IQ tests is very simple: IQ tests are purported to measure ‘g’ (whatever that is) and individual differences in test scores supposedly reflect individual differences in ‘g’. However, we cannot say that it is differences in ‘g’ that cause differences in individual test scores since there is no agreed-upon model or description of ‘g’ (Richardson, 2017: 84). Richardson (2017: 84) writes:
In consequence, all claims about the validity of IQ tests have been based on the assumption that other criteria, such as social rank or educational or occupational acheivement, are also, in effect, measures of intelligence. So tests have been constructed to replicate such ranks, as we have seen. Unfortunately, the logic is then reversed to declare that IQ tests must be measures of intelligence, because they predict school acheivement or future occupational level. This is not proper scientific validation so much as a self-fulfilling ordinance.
Construct validity for IQ does not exist (Richardson and Norgate, 2015), unlike construct validity for breathalyzers (Landauer, 1972) or white blood cell count as a disease proxy (Wu et al, 2013; Shah et al, 2017). So, if construct validity is non-existent, then that means that there is no measure for how well IQ tests measure what it’s ‘purported to measure’, i.e., how ‘intelligent’ one is over another because 1) the definition of ‘intelligence’ is ill-defined and 2) IQ tests are not validated against agreed-upon biological models, though some attempts have been made, though the evidence is inconsistent (Richardson and Norgate, 2015). For there to be true validity, evidence cannot be inconsistent; it needs to measure what it purports to measure 100 percent of the time. IQ tests are not calibrated against biological models, but against correlations with other tests that ‘purport’ to measure ‘intelligence’.
(Note: No, I am not saying that everyone is equal in ‘intelligence’ (whatever that is), nor am I stating that everyone has the same exact capacity. As I pointed out last week, just because I point out flaws in tests, it does not mean that I think that people have ‘equal ability’, and my example of an ‘athletic abilities’ test last week is apt to show that pointing out flawed tests does not mean that I deny individual differences in a ‘thing’ (though athletic abilities tests are much better with no assumptions like IQ tests have.))
You Don’t Need Genes to Delineate Race
2100 words
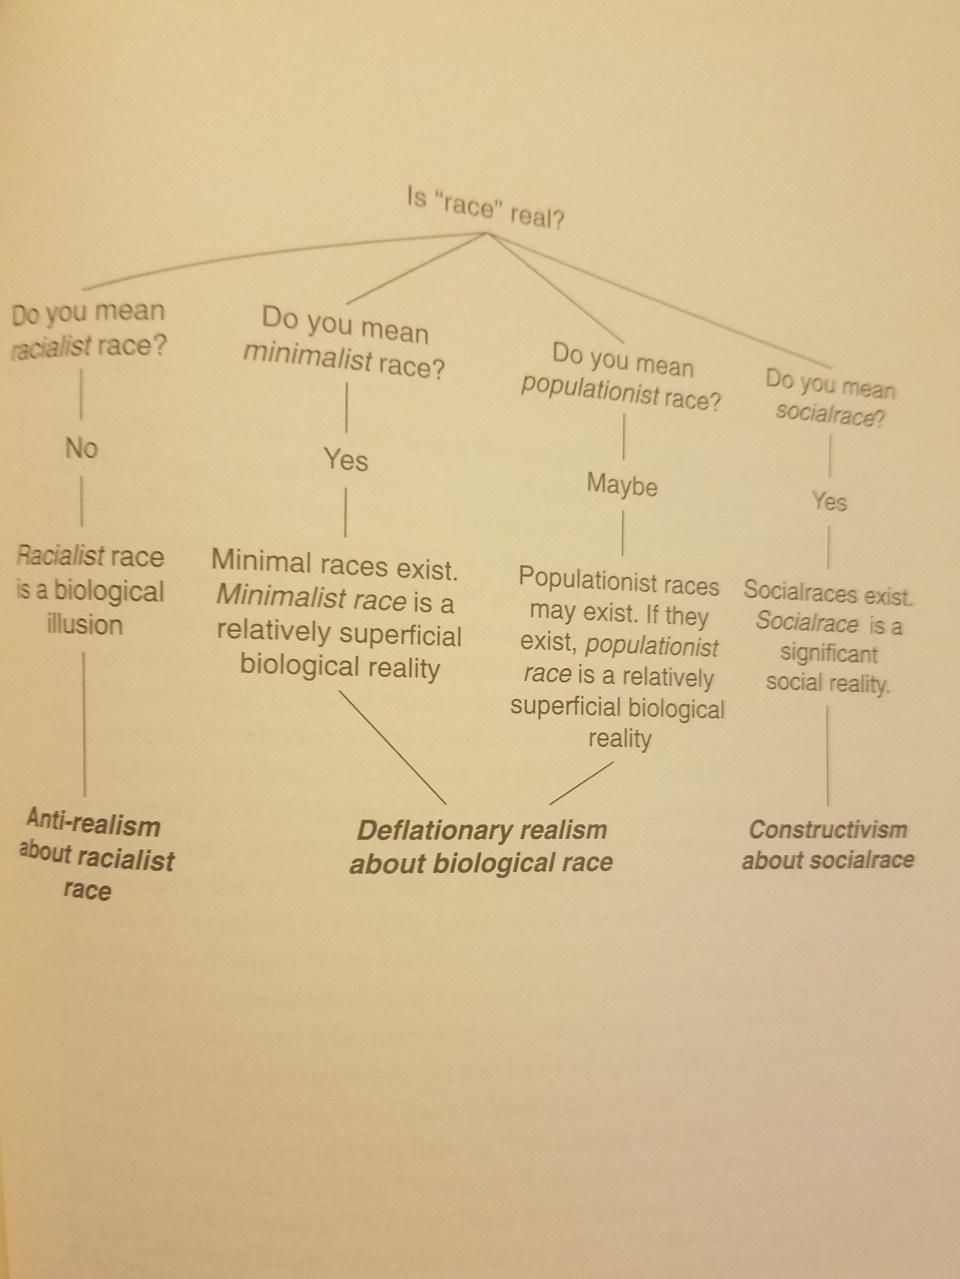
Most race deniers say that race isn’t real because, as Lewontin (1972) and Rosenberg (2002) state, the within-group variation is larger than the between-group variation. Though, you can circumvent this claim by not even looking at genes/allele frequencies between races, you can show that race is real by looking at morphology, phenotype and geographic ancestry. This is one of Michael Hardimon’s race categories, the minimalist concept of race. This concept does not entail anything that we cannot physically ‘see’ with our eyes (e.g., mental and psychological traits are off the table). Using these concepts laid out by Hardimon can and does prove that race is real and useful without even arguing about any potential mental and psychological differences between human races.
Morphology
Morphology is one of the most simple tells for racial classification. Just by looking at average morphology between the races we can use attempt to use this data point as a premise in the argument that races exist.
East Asians are shorter with shorter limbs and have an endomorphic somatype. This is due to evolving in cold climate, as a smaller body and less surface area can be warmer much quicker than a larger body. This is a great example of Allen’s rule: that animals in colder climates will be smaller than animals in warmer climates. Using average morphology, of course, can show how the population in question evolved and where they evolved.
Regarding Europeans, they have an endomorphic somatype as well. This, again, is due to where they evolved. Morphology can tell us a lot about the evolution of a species. Though, East Asians and Europeans have similar morphologies due to evolving in similar climates. Like East Asians, Europeans have a wider pelvis in comparison to Africans, so this is yet another morphological variable we can use to show that race exists.
Finally, the largest group is ‘Africans’ who have the largest phenotypic and genetic diversity on earth. Generally, you can say that they’re tall, have long limbs and a short torso, which is due to evolving in the tropics. Furthermore, and perhaps most important, Africans have narrower pelves than East Asians and Europeans. This character is one of the most important regarding the reality of race because it’s one of the most noticeable, and we do notice in when it comes to sports competition because that certain type of morphology is conducive to athletic success. (Also read my recent article on strength and race and my article on somatype and race for more information on morphologic racial differences.)
Phenotype
Morphology is a part of the phenotype too, obviously, but there is a reason why it’s separated. As is true with morphology, different characters evolved due to cultural evolution (whether or not they adopted farming early) or evolution through natural selection, drift and mutation. Though, of course, favorable mutations in a certain environment will be passed on and eventually become a part of the characteristics of the population in question.
East Asians have the epicanthic fold, which probably evolved to protect the eye from the elements and UV rays on the Mongolian steppes. They also have softer features than Europeans and Africans, but this is not due to lower testosterone as is popularly stated. (Amusingly enough, there is a paper that stated that East Asians have Down Syndrome-like qualities due to their epicanthic folds to bring up one reason.) Even then, what some races find attractive or not can show how and why certain facial phenotypes evolved. To quote Gau et al (2018):
Compared with White women, East Asian women prefer a small, delicate and less robust face, lower position of double eyelid, more obtuse nasofrontal angle, rounder nose tip, smaller tip projection and slightly more protruded mandibular profile.
And they conclude:
The average faces are different from the attractive faces, while attractive faces differ according to race. In other words, the average facial and aesthetic criteria are different. We should use the attractive faces of a race to study that races aesthetic criteria.
We can use studies such as this to discern different facial phenotypes, which, again, proves that race exists.
The climate one’s ancestors evolved in dictates nose shape. In areas where it is extremely dry and also has a lot of heat, a larger mucous area is required to moisten inspired (inhaled) air, which is why a more flat and narrow nose is needed.
Zaidi et al (2017) write:
We find that width of the nares is correlated with temperature and absolute humidity, but not with relative humidity. We conclude that some aspects of nose shape may have indeed been driven by local adaptation to climate.
Though climate, of course, isn’t the only reason for differences in nose shape; sexual selection plays a part too, as seen in the above citation on facial preferences in East Asian and European women.
There are also differences in hirsutism between the races. Racial differences exist regarding upper lip hair, along with within-race differences (Javorsky et al, 2014). The self-reported races of African American, East Asian, Asian Indian, and ‘Hispanic’ predicted facial hair differences in women, but not how light their skin was. The women were from Los Angeles, USA; Rome, Italy; Akita, Japan; and London, England. Indian women had more hair than any other race, while European women had the least. Regarding within-race variation, Italian women had more hair on their upper lip than American and British women. Skin lightness was related to hair on the upper lip. (Also read my article The Evolution of Human Skin Variation for more information on racial differences in skin color.)
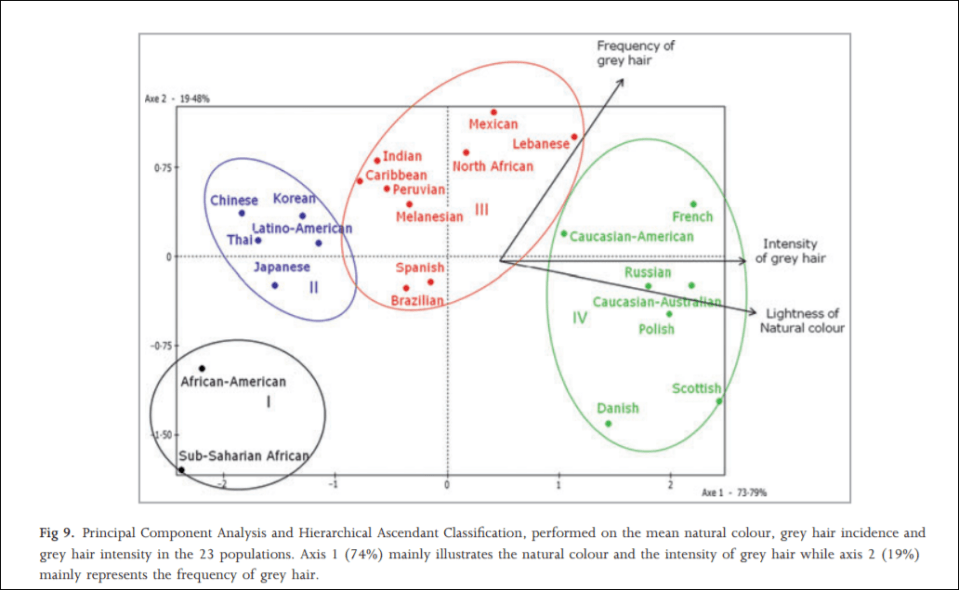
In 2012, an interesting study was carried out on hair greying on a sample population of a large number of the world’s ethnies titled Greying of the human hair: a worldwide survey, revisiting the ‘50’ rule of thumb. The objective of the study was to test the ’50-50-50′ rule; that at age 50, 50 percent of the population has at least 50 percent of their hair grey. Africans and Asians showed fewer grey hairs than whites who showed the most. The results imply that hair greyness varies by ethnicity/geographic origin, which is perfect for the argument laid out in this article. The global range for people over 50 with 50 percent or more of their hair grey was between 6 and 23 percent, far lower than what was originally hypothesized (Panhard, Lozano, and Loussouarn, 2012). They write on page 870:
With regard to the intensity of hair greying, the lowest values were found among African and Asian groups, especially Thai and Chinese, whereas the highest values were in subjects with the blondest hair (Polish, Scottish, Russian, Danish, CaucasianAustralian and French).
…
Altogether, these analyses clearly illustrate that the lowest incidences and intensities of grey hair are found in populations of the darkest hair whereas the highest intensities are found in populations with the lightest hair tones.
Actual hair diversity is much more concentrated in Europeans, however (Frost, 2005). (See Peter Frost’s article Why Do Europeans Have So Many Hair and Eye Colors?) It is largely due to sexual selection, with a few climatic factors thrown in. Dark hair, on the other hand, is a dominant trait, which is found all over the world.
Zhuang et al (2010) found significant differences in facial morphology between the races, writing:
African-Americans have statistically shorter, wider, and shallower noses than Caucasians. Hispanic workers have 14 facial features that are significantly larger than Caucasians, while their nose protrusion, height, and head length are significantly shorter. The other ethnic group was composed primarily of Asian subjects and has statistically different dimensions from Caucasians for 16 anthropometric values.
…
Statistically significant differences in facial anthropometric dimensions (P < 0.05) were noted between males and females, all racial/ethnic groups, and the subjects who were at least 45 years old when compared to workers between 18 and 29 years of age.
Blacks had statistically significant differences in lip and face length when compared to whites (whites had shorted lips than blacks who had longer lips than whites).
Brain size and cranial morphology, too, differs by geographic ancestry which is directly related to the climate where that population evolved (Beals, Smith, and Dodd, 1984). Most every trait that humans have—on average of course—differs by geographic location and the cause of this is evolution in these locations along with being a geographically isolated breeding population.
Geographic ancestry
The final piece to this argument is using where one’s recent ancestors came from. There are five major populations from a few geographic locales: Oceania, the Americas (‘Native Americans), Europe, Africa and East Asia. These geographic locales have peoples that evolved there and underwent different selective pressures due to their environment and their bodies evolved to better suit their environment, and so racial differences in morphology and phenotype occurred so the peoples could survive better in that location. No one part of this argument is more important than any other, though geographic ancestry is the final piece of the puzzle that brings everything together. Because race is correlated with morphology and phenotype, the geographic ancestry dictates what these characteristics look like.
Conclusion
Thus, this is the basic argument:
P1: Differing populations have differing phenotypes, including (but not limited to) facial structure, hair type/color, lip structure, skull size, brain size etc.
P2: Differing populations have differing morphology which, along with this population’s phenotype, evolved in response to climatic demands along with sexual selection.
P3: This population must originate from a distinct geographic location.
C: If all three of the above premises are true, then race—in the minimalist sense—exists and is biologically real.
This argument is extremely simple, and along with the papers cited above in support of the three premises and the ultimate conclusion, it will be extremely hard for race deniers to counter. We can say that P1 is logically sound because geographically isolated populations differ in the above-mentioned criteria. We can say that P2 is logically sound since differing populations have differing morphology (as I have discussed numerous times which leads to racial differences in sporting competition) such as differing trunk lengths, leg lengths, arm lengths and heights which are largely due to evolution in differing climates. We can say that P3 is logically sound because the populations that would satisfy P1 and P2 do come from geographically distinct locations; that is, they have a peculiar ancestry that they only share.
This concept of minimalist race from Michael Hardimon is (his) the racialist concept of race “stripped down to its barest bones” (Hardimon, 2017: 3). The minimalist concept of race, then, does not discuss any differences between populations that cannot be directly discerned with the naked eye. (Note: You can also use the above arguments/data laid out for the populationist concept of race, which, according to Hardimon (2017: 3) is: “A nonracialist (nonessentialist, nonhierarchical) candidate scientific concept that characterizes races as groups of populations belonging to biological lines of descent, distinguished by patterns of phenotypic differences, that trace back to geographically separated and extrinsically reproductively isolated founder populations.)
Minimalist race is biologically sound, grounded in genetics (though I have argued here that you don’t need genetics to define race), and is grounded in biology. Minimalist race is defined as characteristics of the group, not of the individual. Minimalist race are biologically real. Minimalist races exist because, as shown with the data presented in this article, phenotypic and morphologic traits are unevenly distributed throughout the world which then correlates with geographic ancestry. It cannot get any more simpler than that: race exists because differences in phenotype and morphology exist which then corresponds with geographic ancestry.
From Hardimon (2017: 177)\
No sane or logical person would deny the existence of race based on the criteria laid out in this article. We can also make another leap in logic and state that since minimalist races exist and are biologically real then geographic ancestry should be a guide when dealing with medicine and different minimalist races.
It is clear that race exists in the minimal sense; you do not need genes to show that race is real, nor that race has any utility in a medical context. This is important for race deniers to understand: genes are irrelevant when talking about the reality of race; you only need to just use your eyes and you’ll see that certain morphologies and phenotypes are distributed across geographic locations. It is also very easy to get someone to admit that races exist in this minimalist-biological sense. No one denies the existence of Africans, Europeans, ‘Native’ Indians, East Asians and Pacific Islanders. These populations differ in morphology and other physical characters which are unevenly distributed by geographic ancestry, so, therefore: minimialist races exist and are a biological reality.
