
Home » exercise
Category Archives: exercise
Strength and Neuromuscular Coordination
2250 words
PumpkinPerson (PP) has some weird—and uneducated—views regarding strength and coordination, which, of course, implies that he has no understanding of what “coordination” truly is. He seems to have convinced himself that coordination weightlifting does not require coordination (neuromuscular coordination; hereafter NMC—the ability of the central nervous system—CNS—to control muscles). That view is patently ridiculous. In this article, I will explain the logic behind the fact that strength and power exercises, in particular, NEED a high NMC, and without a high NMC, the athlete in question cannot perform to their highest potential.
PP wrote about an “athletic g factor” to attempt to liken it to the “g factor” regarding “intelligence” tests, but I’m not worried about that comparison (IQ is boring to me now). What I am worried about are his outlandish claims regarding what he believes regarding strength and NMC. PP cited Jensen’s Bias in Mental Testing where Jensen cited a correlation matrix in which “all of [the] correlations were positive“, writing that he’s “not sure why some commenters think weight lifting requires coordination when the correlation between strength (hand grip, chinning) and coordination (Pursuit rotor tacking, Mirror star tracing) is zero” (PP; Physical Coordination).
Well, “some commenters” have actual experience in what he is talking about, so, forgive me if I don’t believe the claims that, in my opinion, he pulled out of thin air. Take chin-ups. Imagine a case of someone attempting to chin-up that does not have high NMC. Since they were not coordinated, do you think they would be able to do a controlled rep in order to complete one rep? Or would their body be all over the place, flailing around since they do not have the mind-muscle (MMC) connection required to complete the lift. Now take his other example, hand grip. On its face, one might assume that this requires no NMC. But think about the process of gripping something tightly. If the muscles in the forearm, for example, are not adequately trained, then, in all lifts involving forearm strength (a great majority of which involve at least some type of forearm strength) will not be able to be performed properly, since the individual in question does not have the NMC required to properly do the exercise in question.
PP then says that when he “lift weights, [he doesn’t] feel like [he’s] using coordination.” This proves two things to me: (1) PP does not know how to lift properly, and then (2) follows that he does not know about the MMC.
The MMC is where the mind and the body “meet.” Acetylcholine functions as a neurotransmitter. This neurotransmitter “communicates” with the muscles in the body to cause a contraction. This contraction, then, causes the action of voluntary muscle movement. (I had an A&P professor explain to me that, out of the whole textbook he taught out of, one of the only things in the textbook that we could choose to do was move the body—contract muscles and cause movement). So when acetylcholine is released, it latches onto muscle fibers and causes muscle contractions.
We can put the MMC in this way: imagine doing a movement such as a bicep curl. One is not actively attempting to use the proper levers in order to properly lift the weight. On the other hand, if one is actively thinking about the muscles being used in the movement, then they are using the connection—they are strengthing their MMC and, in turn, developing the proper NMC which is required in order to properly lift weights and get the most returns possible from your time spent lifting.
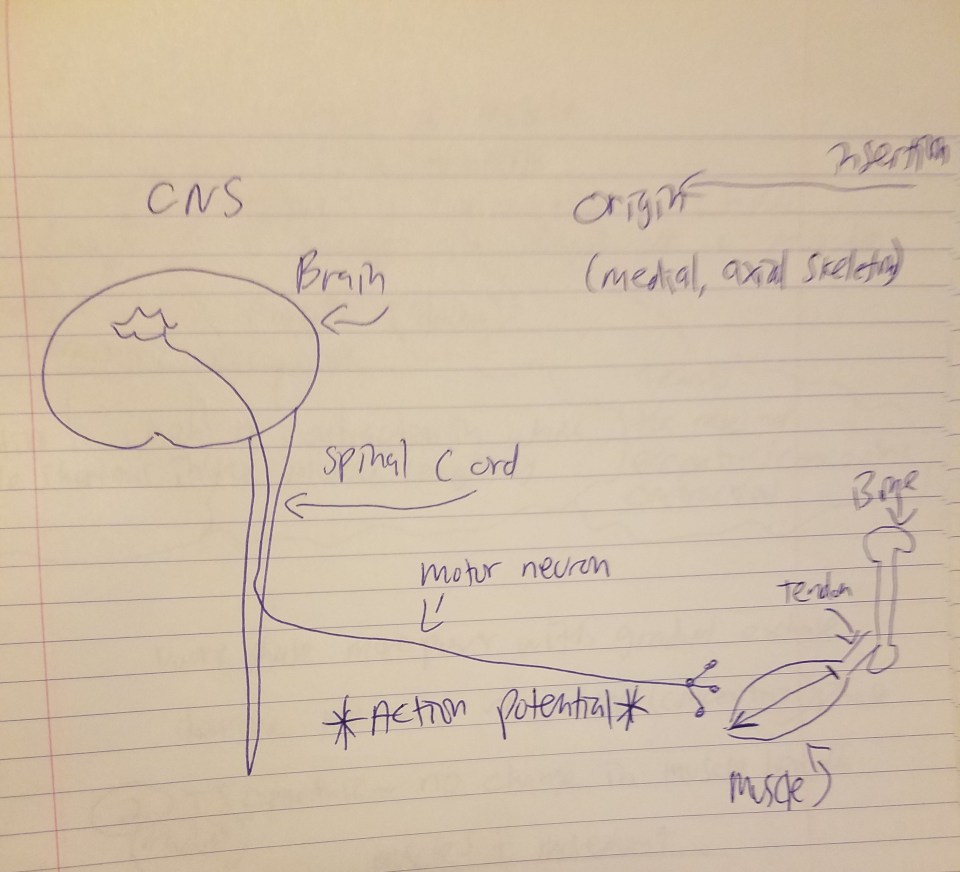
The above diagram I drew is the process by which muscle action occurs. In my recent article on fiber typing and metabolic disease, I explained the process by which muscles contract:
But the skeletal muscle will not contract unless the skeletal muscles are stimulated. The nervous system and the muscular system communicate, which is called neural activiation—defined as the contraction of muscle generated by neural stimulation. We have what are called “motor neurons”—neurons located in the CNS (central nervous system) which can send impulses to muscles to move them. This is done through a special synapse called the neuromuscular junction. A motor neuron that connects with muscle fibers is called a motor unit and the point where the muscle fiber and motor unit meet is callled the neuromuscular junction. It is a small gap between the nerve and muscle fiber called a synapse. Action potentials (electrical impulses) are sent down the axon of the motor neuron from the CNS and when the action potential reaches the end of the axon, hormones called neurotransmitters are then released. Neurotransmitters transport the electrical signal from the nerve to the muscle.
So action potentials (APs) are carried out at the junction between synapses. So, regarding acetylcholine, when it is released, it binds to the synapses (a small space which separates the muscle from the nerve) and it then binds onto the receptors of the muscle fibers. Now we know that, in order for a muscle to contract, the brain sends the chemical message (acetylcholine) across synapses which then initiates movement. So, as can be seen from the diagram above, the MMC refers to the chemo-electric connection between the motor cortex, the cortico-spinal column, peripheral nerves and the neuromuscular junction. A neuromuscular junction is a synapse formed by the contact between a motor neuron and a muscle fiber. This is why beginners in the gym get stronger in the first 8 weeks or so of training—there has not been enough time for muscle to adequately grow in that time span. Thus, when people lift weights correctly, what they are doing is training their NMC—and their mind—to be able to adequately perform these types of actions in a safe, controlled manner.
How is NMC measured? It’s not simple to measure it, and in reality, the most feasible way to “measure it” in real life situations without the use of a lab is to just see one’s progress while they progress through higher and higher weights from their starting weights and they learn to perform the exercise in question safely. But a more empirical measure used in order to measure NMC are electromyography (EMG) tests. In fact, this test is THE MEASURE used to measure NMC, since all of the relevant variables in question (some seen in the above diagram) are tested. EMGs are used for numerous reasons, mostly in order to test for types of motor diseases which affect muscle action. There is also a related measure here: a nerve conduction study. This measures the speed and strength of signals traveling between two synapses, and so, the better one’s nerve conduction is in regard to muscle action, the higher their NMC is and, therefore, the better they will be able to perform any certain lift. So, for example, we can say that one’s NMC increased and the cause was resistance training if their EMG tests increase.
Imagine an Olympic lifter going to snatch 400 pounds. Would any sane person bet that they have low NMC (i.e., a low rate of firing between synapses as measured by an EMG)? A claim such as this would be quite preposterous—individuals like Olympic lifters clearly have trained both their bodies and minds in order to lift to the best of their abilities. And if they did NOT have high NMC (i.e., a higher rate of firing between synapses), then the weight would wobble and ultimately fall, causing the lifter serious injury. But, of course, we do not see that, since strength and NMC are closely related.
I now have some examples of studies which looked into this matter (that thinking about the action one is performing activates the primary muscles used in the movement in question), which will definitely put PP’s claims to rest for good.
Neuromuscular coordination is needed, for example, to be able to “squat lift” correctly (meaning, pick up a load from a squatting start and lift it; Scholz, Millford, and McMillan, 1995). Our understanding of how this occurs has greatly increased in 30 some-odd years since our technology has improved.
Now, take the MMC. We can simply define it as “One focusing on using the muscles in question to perform the lift.” Calatayud et al (2016) studied 18 resistance-trained men on a 1RM (one-rep max) bench press. Each individual in the study participated in 2 sessions: one to determine their 1RM and another experimental session. Calatayud et al (2016) attempted to control for as many factors as possible in order to attempt to see if the baseline changed at all. For example, all measures were made by the same two investigators; all measures were taken in the same facility; all participants participated in the same warm-up mobility drills prior to performing the lift; all participants performed the lift in the exact same manner they performed the two aforementioned sessions (same technique and body position, i.e., suicide grip and powerlifting technique).
They found that (1) higher levels of EMG activity lead to moving more weight; (2) the men could “selectively activate pectoralis and triceps muscles during the
bench press when this exercise is performed at low intensities” (Calatayud et al, 2016), at moderate intensities; (3) that focusing on one muscle (i.e., triceps brachii over pec major) did not hamper activation in one over the other; and (4) a threshold exists between 60-80 percent existed for muscle activation. Thus, experienced resistance-trained men can actively increase activity in certain muscles when cued to focus on those certain muscles.
Snyder and Fry (2012) studied 11 D-III football players on the bench press while recording EMG activity. They found that, when verbal cues were given to focus on the chest muscles, EMG increased by 22 percent, but when verbally cued to focus on the triceps, the pec major returned to baseline (though this does not mean, of course, that performance was hampered), while EMG activity increased by 26 percent. However, in-line with the findings from Calatayud et al (2016), when 80% 1RM were tested, EMG activity in the triceps remained unchanged, implying that there is a threshold.
The results of this study show that trained subjects can alter the participation of muscles in both moderate and higher-intensity multijoint resistance training exercises in response to verbal instructions, because both TB and PM activities were increased selectively in response to 2 different sets of instructions at 50% 1RM and 80% 1RM. This indicates that verbal instructions from trainers, therapists, and coaches are likely to have a measurable effect on muscle involvement, although it is unclear how generalizable this effect might be to all training exercises. Previous research from our laboratory (23) indicated that untrained subjects performing a lat pull-down at 30% max isometric load could respond to verbal instructions to increase back muscle involvement by increasing latissimus dorsi activity while maintaining proper form and similar speed of movement. The subjects in that study increased latissimus dorsi activity by 17.6%, whereas in the current study, verbal instruction resulted in a 22.3% increase from baseline at 50% 1RM for PM and a 25.6% increase for TB. However, antagonist activity was not measured by Snyder and Leech (23), and it was possible that the subjects activated antagonist muscles to offset additional force produced by agonist muscles. This study addressed this possibility, but no changes were seen in antagonist muscle activity with verbal instructions. The question of the effect of higher testing loads was also addressed by this study, and it was found that at 50% 1RM, the subjects were capable of altering muscle participation of both the horizontal adductors and the elbow extensors, but at 80% 1RM, only the horizontal adductors were affected. (Snyder and Fry, 2012)
If the activity of a muscle as measured by EMG is increased, then we can say that, for all intents and purposed, that NMC is high. One who is not familiar with a lift will have low NMC, that is, the firing will be low compared to someone with high NMC. Quite clearly, verbal instruction to focus on certain muscles can better activate them, and, using EMG, we can say that they have high NMC if the firing between synapses is fast.
Rutherford and Jones (1986) write that “It is concluded that a large part of the improvement in the ability to lift weights was due to an increased ability to coordinate other muscle groups involved in the movement such as those used to stabilise the body.” How weird is that… While Kim, Lockhart, and Roberto (2009) in their sample of elderly individuals found that “Strength gain by exercise training plays a role in the improved coordination of other fixator muscles necessary for body support while performing daily tasks such as cooking, gardening, reaching for an object, and walking, and in gaining more coordinated contractions between agonist and antagonist muscle groups leading to greater net force in the imposing movements.” Finally, Dahab and McCambridge (2009) found that strength training in kids improves the number and coordination of active neurons along with the firing rate pattern. This is important because the number and coordination of active neurons along with the rate of firing pattern influences—very strongly—NMC and how coordinated they will be.
In conclusion, it is quite obvious that PP does not know what he is talking about and only writes what sounds good in his head without having an adequate understanding of anatomy and physiology, NMC, MMC, APs and the like. These types of confusions can be cleared up by having an adequate understanding of anatomy and physiology and knowing how and why muscle actions are done, where they begin and where they end. Clearly, the claim that weight lifting requires no coordination is false.
On Individual Variation in Response to Exercise
1500 words
On Twitter, JayMan wrote: “Not talked about much by fitness buffs (a world that’s full of BS anyway): a fair fraction of people respond little to even *negatively* to exercise“. This is the same person that thinks behavior genetics is a science, and that is a field “that’s full of BS anyway”, too. Anyway, the article that JayMan cited was from the website Stronger by Science, titled Hardgainers? What We Know About Non-Responders by Greg Nuckols.
First off, JayMan’s comment that “a fair fraction of people respond … *negatively* to exercise” is, on its face, already false. Most everyone in the study referenced by Nuckols (There Are No Nonresponders to Resistance-Type Training in Older Men and Women; Churchward-Venne et al, 2015) gained strength, but some people’s muscle fibers did not grow, and some apparently shrank (that is, their muscle cross-section area; CSA). But the important thing to note is that ALL gained strength, which implies physiologic adaptation to the stressor placed on the body (something that is overlooked).
Though, even if some people do not respond to certain programs or weight/rep schemes, does not mean that they are “non-responders”. All that needs to be done is to change the program if one “does not respond” to the program created. All exercise programs should be tailored to the individual and their own specific goals. There is no “one-size-fits-all” exercise program, as can be seen from these studies on so-called “hardgainers.”
The best study for this matter, though, is the HERITAGE (HEalth, RIsk factors, exercise, Training, And GEnetics) study, carried out by five universities in Canada and the US, who enlisted 98 two-generation families and then subject each member to five months of the same stationary bike training regimen—three workouts per week with increasing intensity. Each of the 482 individuals in the study was assayed, and so we would also see which genes would play a role in how fit one person would be in comparison to another.
David Epstein, author of The Sports Gene, writes (pg 85):
Despite the fact that every member of the study was on an identical exercise program, all four sites saw a vast and similar spectrum of aerobic capacity improvement, from about 15 percent of participants who showed little or no gain whatsoever after five months of training all the way up to 15 percent of participants who improved dramatically, increasing the amount of oxygen their bodies could use by 50 percent or more.
Amazingly, the amount of improvement that any one person experienced had nothing to do with how good they were to start. In some cases, the poor got relatively poorer (people who started with a low aerobic capacity and improved little); in others, the oxygen rich got richer (people who started with high aerobic capacity and improved rapidly); with all manner of variation in between—exercisers with a high baseline aerobic capacity and little improvement and others with meager starting aerobic capaacity whose bodies transformed drastically.
Though, contrary to JayMan’s claims, “Fortunately, every single HERITAGE subject experienced health benefits from exercise. Even those who did not improve at all in aerobic capacity improved in some other health parameter, like blood pressure, cholesterol, or insulin sensitivity” (Epstein, 2014: 88).
Epstein also writes about another study, undertaken at the University of Alabama-Birmingham’s Core Muscle and Research Laboratory, writing:
Sixty-six people of varying ages were put on a four-month strength training plan—squats, leg press, and leg lifts—all matched for effort level as a percentage of the meximinum they could lift. (A typical set was eleven reps at 75 percent of the maxmimum that could be lifted for a single rep.) At the end of the trainin, the sibjects fell rather neatly into three groups: those whose thigh muscle fibers grew 50 percent in size; those whose fibers grew 25 percent; and those who had no increased in muscle size at all.
[…]
Seventeen weight lifters were “extreme responders” who added muscle furiously; thirty-two were moderate responders, who had decent gains; and seventeen were nonresponders, whose muscle fibers did not grow.* (pg 110)
* “It’s important to keep in mind that the harder the training, the less likely there are to be “nonresponders.” The harder the work, the more likely a subject will get at least some response, even if it is less than her peers” (pg 376).
Those who responded the most to the regimen had the most satellite cells in their quads which were waiting to be activated by training. When one becomes stronger from hypertrophy, the muscle thickness correlates to muscle CSA (Franchi et al, 2018). When one performs a repetition, the muscle fibers break down—this leads to trauma of the cellular proteins in the muscles which must then go under repair. Numerous growth factors influence the growth of skeletal muscle, such as GH (growth hormone), testosterone, protein and carb intake. Skeletal muscle adapts almost immediately after a bout of exercise, but the apparent changes to the muscle (both in the mirror and seeing large gains in strength on any particular movement) will take weeks and months.
There’s one thing about the claims of “exercise nonresponders” that really gets me: everyone responds positively to exercise, even if it’s not the same exact response to another individual doing the same—or different—exercise! I don’t know who made the claim that “people respond the same to any exercise program”, but that’s a claim that hbdchick made, writing “plenty of the “fitness buffs” do [make the claim that everyone would respond the same to the same exercise regimen]. I then asked her, and JayMan, to name three people who made this outrageous claim: but, of course, I got no answer.
Not to mention that Nuckols ended the article writing:
… there were way fewer nonresponders when people were put on personalized training programs instead of one-size-fits-all standardized programs. This study was primarily looking at aerobic fitness, but it also examined strength measures (bench press and leg press 5RM). It found that all the subjects on personalized programs got stronger, while only 64.3% of the subjects on standardized programs got stronger. This gives us more evidence that “nonresponders” in scientific studies aren’t necessarily “true” nonresponders.
Take two people who have similar measures and, say, start at the same weight on one exercise. In 6 months, all else being equal with regard to lifestyle, there will be a difference in strength gained on that particular exercise. However, an increase from t he baseline from when both individuals began, to the 6-month point, shows that they did, indeed, respond to the exercise program at least in some way (see above quotes from Epstein). Thus, the claim that “there are nonresponders to exercise” makes no sense, on the basis that people necessarily respond physiologically to the stressors placed on them, and so, if they do more (and they will) than they did previously from their baseline, then they did adapt to the protocol, implying that they are not “nonresponders” to exercise. It does not matter if Person B does not catch up to Person A on all variables: the fact that there was a difference in each individual from the baseline all the way to 6 months on a specific regimen implies adaptation to the stressors—which implies that there is no such thing “nonresponders”.
JayMan also has views similar to this, which I have responded to last year in the articles Diet and Exercise: Don’t Do It? and Diet and Exercise: Don’t Do It? Part II. Eating well and exercising—although benefits are not the same for each individual (and I do not know who made the claim this was the case)—does ameliorate numerous diseases and can extend lifespan, contrary to the results of certain studies (e.g., the Look AHEAD study; Annuzzi et al 2014).
Claims from people like JayMan who do not know the first thing about dieting and exercise are dangerous—though, all one has to do is have a basic understanding of physiology to understand that the claim “a fair fraction of people respond little to even *negatively* to exercise” is false, since everyone who does something for the first few times will ALWAYS be better in the months after learning the specific movement, implying that there are no nonresponders to exercise.
Of course everyone does not respond the same to exercise regimen A. Other studies found that increasing the frequency, reps, and set scheme lead to changes in the so-called “nonresponders.” Different individuals respond differently to different training programs [be it, strength, conditioning, cardio, plyometrics, balance, and stabilization etc. But it must be stressed that, although not everyone has the same potential for muscle-building/strength-gaining as, say, the IFBB pros or strongmen/powerlifters, everyone can and does benefit from NOT being sedentary, that much is most definitely clear. These studies that show “nonresponders” run people through the same exercise regimen. Anyone with an iota of experience in this industry knows that people do not respond the same to any and every exercise regimen and, so, the program must be tailored to that specific individual. Though, people like JayMan read this stuff and, without understanding what they’re talking about, jump to brash conclusions that are not supported by reality.
Racial Differences in Physical Functioning
1350 words
Assessing physical functioning is important. Such simple tests—such as walk, stand, and sit tests—can predict numerous things. “Testing” defines one’s abilities after being given a set of instructions. Racial differences exist and, of course, both genetic and environmental factors play a part in health disparities between ethnies in America. Minorities report lower levels of physical activity (PA) than whites, this—most often—leads to negative outcomes, but due to their (average) physiology, they can get away with doing “less” than other ethnies. In this article, I will look at studies which talk about racial differences in physical functioning, what it means, and what can be done about it.
Racial differences in physical functioning
Racial differences in self-rated health at similar levels of health exist (Spencer et al, 2009). Does being optimistic or pessimistic about health effect one’s outcomes? Using 2,929 HABC (Health, Aging, and Body Composition) participants, Spencer et al (2009) examined the relationship between self-rated health (SRH) and race, while controlling for demographic, psychosocial and physical health factors. They found that whites were 3.7 times more likely than blacks to report good SRH.
Elderly blacks were more likely to be less educated, reported lower satisfaction with social support, and also had lower scores on a physical battery test than whites. Further, black men and women were less likely to report that walking a quarter mile was “easy”, implying that (1) they have no endurance and (2) weak leg muscles.
Blacks were also more likely to report higher personal mastery:
Participants were asked whether they agreed or disagreed with the following statements: “ I often feel helpless in dealing with the problems of life ” and “ I can do just about anything I really set my mind to do, ” with response categories of disagree strongly, disagree somewhat, agree somewhat, and agree strongly. (Spencer et al, 2009: 90)
Blacks were also more likely to report higher BMI and more chronic health conditions than whites. White men, though, were more likely to report higher global pain, but were older than black men in the sample. When whites and blacks of similar physical functioning were compared, whites were more likely to report higher SRH. Health pessimists were found to be at higher risk of poor health.
Vazquez et al (2018) showed that ‘Hispanics’ were less likely to report having mobility limitations than whites and blacks even after adjustment for age, gender, and education. Blacks, compared to non-‘Hispanic’ whites were more likely to have limitations on activities of daily living (ADL) and instrumental activities of daily living (IADL) For ADL limitations, questions like “Do participant receive help or supervision with personal care such as bathing, dressing, or getting around the house because of an impairment or a physical or mental health problem?” and for IADLs “Does participant receive help or supervision using the telephone, paying bills, taking medications, preparing light meals, doing laundry, or going shopping?” (Vazquez et al, 2018: 4). They also discuss the so-called “Hispanic paradox” (which I discussed), but could not come to a conclusion on the data they acquired. Nonetheless, ‘Hispanic’ participants were less likely to report mobility issues; blacks were more likely than whites to report significant difficulties with normal activities of daily living.
Araujo et al (2010) devised a lower-extremities chair test: how quickly one can stand and sit in a chair; along with a walking test: the time it takes to walk 50 feet. Those who could not complete the chair test were given a score of ‘0’. Overall, the composite physical function (CPF) score for blacks was 3.45, for ‘Hispanics’ it was 3.66, and for whites, it was 4.30. This shows that older whites were stronger—in the devised tests—and that into older age whites are more likely to not need assistance for everyday activities.
This is important because differences in physical functioning between blacks and whites can explain differences in outcomes one year after having a stroke (Roth et al, 2018). This makes sense, knowing what we know about stroke, cognitive ability and exercise into old age.
Shih et al (2005) conclude:
a nationally representative study of the US population, indicate that among older adults with arthritis: (1) racial disparities found in rates of onset of ADL [activities of daily living] limitations are explained by differences in health needs, health behaviors, and economic resources; (2) there are race-specific differences in risk factors for the onset of ADL limitations; and (3) physical limitations are the most important risk factor for onset of ADL limitations in all racial and ethnic groups.
Safo (2012) showed that out of whites, blacks and “Hispanics”, blacks reported the most (low back) pain, worse role functioning score and overall physical functioning score. Lavernia et al (2011) also found that racial/ethnic minorities were more likely to report pain and have lower physical functioning after having a total knee arthroplasty (TKA) and total hip arthroplasty (THA). They found that blacks and ‘Hispanics’ were more likely to report pain, decreased well-being, and have a lower physical functioning score, which was magnified specifically in blacks. Blacks were more likely to report higher levels of pain than whites (Edwards et al, 2001; Campbell and Edwards, 2013), while Kim et al (2017) showed that blacks had lower pain tolerance and higher pain ratings. (Read Pain and Ethnicity by Ronald Wyatt.)
Sarcopenia is the loss of muscle tissue which is a natural part of the aging process. Sarcopenia—and sarcopenic obesity (obesity brought on by muscle loss due to aging)—shows racial/ethnic/gender differences, too. “Hispanics” were the most likely to have sarcopenia and sarcopenic obesity and blacks were least likely to acquire those two maladies (Du et al, 2018). They explain why sarcopenic obesity may be higher in ‘Hispanic’ populations:
One possibility to explain the higher rates of sarcopenia and SO in the Hispanic population could be the higher prevalence of poorly controlled chronic disease, particularly diabetes, and other health conditions.
[…]
We were surprised to find that Hispanic adults had higher rates of sarcopenia and SO [sarcopenic obesity]. One possible explanation could be the disparity in mortality rates among ethnic populations. Populations that have greater survival rates may live longer even with poorer health and thus have greater chance of developing sarcopenia. Alternatively, populations which have lower survival rates may not live long enough to develop sarcopenia and thus may identify with lower prevalence of sarcopenia. This explanation appears to be supported by the results of our study and current mortality statistics; NH Blacks have the highest mortality rate, followed by NH Whites, and lastly Hispanics.
Differences in physical activity could, of course, lead to differences in sarcopenic obesity. Physical activity leads to an increase in testosterone in lifelong sedentary men (Hayes et al, 2017), while those who had high physical activity compared to low physical activity were more likely to have high testosterone, which was not observed between the groups that were on a calorie-restricted diet (Kumagai et al, 2016). Kumagai et al (2018) also showed that vigorous physical exercise leads to increases in testosterone in obese men:
We demonstrated that a 12-week aerobic exercise intervention increased serum total testosterone, free testosterone, and bioavailable testosterone levels in overweight/obese men. We suggest that an increase in vigorous physical activity increased circulating testosterone levels in overweight/obese men.
(Though see Hawkins et al, 2008 who show that only SHGB and DHT increased with no increase in testosterone.)
So, clearly, since exercise can increase testosterone levels in obese subjects, and higher levels of testosterone are associated with lower levels of adipose tissue; since adequate levels of steroid hormones are needed for lower levels of adipose tissue (Mammi et al, 2012), then since exercise increases testosterone and higher levels of testosterone lead to lower levels of adipose tissue, if physical activity is increased, then levels of obesity and sarcopenic obesity should decrease in those populations.
Conclusion
Racial differences in physical functioning exist; these differences in physical functioning that exist have grave consequences for certain events, especially after a stroke. Differences in physical functioning/activity cause differences in sarcopenia/sarcopenic obesity in different ethnies. This can be ameliorated by targeting at-risk groups with certain outreach. This type of research shows how differences in lifestyle between ethnies cause differences in physical activity between ethnies as the years progress.
(Also read Evolving Human Nutrition: Implications for Public Health, specifically Chapter 8 on socioeconomic status and health disparities for more information on how and why differences like this persist between ethnies in America.)
Genotypes, Athletic Performance, and Race
2050 words
Everyone wants to know the keys to athletic success, however, as I have argued in the past, to understand elite athletic performance, we must understand how the system works in concert with everything—especially in the environments the biological system finds itself in. To reduce factors down to genes, or training, or X or Y does not make sense; to look at what makes an elite athlete, the method of reductionism, while it does allow us to identify certain differences between athletes, it does not allow us to appreciate the full-range of how and why elite athletes differ in their sport of choice. One large meta-analysis has been done on the effects of a few genotypes on elite athletic performance, and it shows us what we already know (blacks are more likely to have the genotype associated with power performance—so why are there no black Strongmen or any competitors in the World’s Strongest Man?). A few studies and one meta-analysis exist, attempting to get to the bottom of the genetics of elite athletic performance and, while it of course plays a factor, as I have argued in the past, we must take a systems view of the matter.
One 2013 study found that a functional polymorphism in the angiotensinogen (ATG) region was 2 to 3 times more common in elite power athletes than in (non-athlete) controls and elite endurance athletes (Zarebska et al, 2013). This sample tested was Polish, n = 223, 156 males, 67 females, and then they further broke down their athletic sample into tiers. They tested 100 power athletes (29 100-400 m runners; 22 powerlifters; 20 weightlifters; 14 throwers and 15 jumpers) and 123 endurance athletes (4 tri-athletes; 6 race walkers; 14 road cyclists; 6 15 to 50 m cross-country skiers; 12 marathon runners; 53 rowers; 17 3 to 10 km runners; and 11 800 to 1500 m swimmers).
Zarebska et al (2013) attempted to replicate previous associations found in other studies (Buxens et al, 2009) most notably the association with the M235T polymorphism in the AGT (angiotensinogen) gene. Zarebska et al’s (2013) main finding was that there was a higher representation of elite power athletes with the CC and C alleles of the M235T polymorphism compared with endurance athletes and controls, which suggests that the C allele of the M235T gene “may be associated with a predisposition to power-oriented
events” (Zarebska et al, 2013: 2901).
Elite power athletes were more likely to possess the CC genotype; 40 percent of power athletes had the genotype whereas 13 percent of endurance had it and 18 percent of non-athletes had it. So power athletes were more than three times as likely to have the CC genotype, compared to endurance athletes and twice as likely to have it compared to non-athletes. On the other hand, one copy of the C allele was found in 55 percent of the power athletes whereas, for the endurance athletes and non-athletes, the C allele was found in about 40 percent of individuals. (Further, in the elite anaerobic athlete, explosive power was consistently found to be a difference maker in predicting elite sporting performance; Lorenz et al, 2013.)
Now we come to the more interesting parts: ethnic differences in the M235T polymorphism. Zarebska et al (2013: 2901-2902) write:
The M235T allele distribution varies widely according to the subject’s ethnic origin: the T235 allele is by far the most frequent in Africans (;0.90) and in African-Americans (;0.80). It is also high in the Japanese population (0.65–0.75). The T235 (C4027) allele distribution of the control participants in our study was lower (0.40) but was similar to that reported among Spanish Caucasians (0.41), as were the sports specialties of both the power athletes (throwers, sprinters, and jumpers) and endurance athletes (marathon runners, 3- to 10-km runners, and road cyclists), thus mirroring the aforementioned studies.
Zarebska et al (2013: 2902) conclude that their study—along with the study they replicated—supports the hypothesis that the C allele of the M235T polymorphism in the AGT gene may confer a competitive advantage in power-oriented sports, which is partly mediated through ANGII production in the skeletal muscles. Mechanisms can explain the mediation of ANGII production in skeletal muscles, such as a direct skeletal muscle hypertrophic effect, along with the redistribution of between muscle blood flow between type I (slow twitch) and II fibers (fast twitch), which would then augment power and speed. However, it is interesting to note that Zarebska et al (2013) did not find any differences between “top-elite” level athletes who had won medals in international competitions compared to elite-level athletes who were not medalists.
The big deal about this gene is that the AGT gene is part of the renin-angiotensin system which is partly responsible for blood pressure and body salt regulation (Hall, 1991; Schweda, 2014). There seems to be an ethnic difference in this polymorphism, and, according to Zarebska et al (2013), African Americans and Africans are more likely to have the polymorphisms that are associated with elite power performance.
There is also a meta-analysis on genotyping and elite power athlete performance (Weyerstrab et al, 2017). Weyerstrab et al (2017) meta-analyzed 36 studies which attempted to find associations between genotype and athletic ability. One of the polymorphisms studied was the famous ACTN3. It has been noted that, when conditions are right (i.e., the right morphology), the combined effects of morphology along with the contractile properties of the individual muscle fibers contribute to the enhanced performance of those with the RR ACTN3 genotype (Broos et al, 2016), while Ma et al (2013) also lend credence to the idea that genetics influences sporting performance. This is, in fact, the most-replicated association in regard to elite sporting performance: we know the mechanism behind how muscle fibers contract; we know how the fibers contract and the morphology needed to maximize the effectiveness of said fast twitch fibers (type II fibers). (Blacks have a higher proportion of type II fibers [see Caeser and Henry, 2015 for a review].)
Weyerstrab et al (2017) meta-analyzed 35 articles, finding significant associations with genotype and elite power performance. They found that ten polymorphisms were significantly associated with power athlete states. Their most interesting findings, though, were on race. Weyerstrab et al (2017: 6) write:
Results of this meta-analysis show that US African American carriers of the ACE AG genotype (rs4363) were more than two times more likely to become a power athlete compared to carriers of the ACE preferential genotype for power athlete status (AA) in this population.
“Power athlete” does not necessarily have to mean “strength athlete” as in powerlifters or weightlifters (more on weightlifters below).
Lastly, the AGT M235T polymorphism, while associated with other power movements, was not associated with elite weightlifting performance (Ben-Zaken et al, 2018). As noted above, this polymorphism was observed in other power athletes, and since these movements are largely similar (short, explosive movements), one would rightly reason that this association should hold for weightlifters, too. However, this is not what we find.
Weightlifting, compared to other explosive, power sports, is different. The beginning of the lifts take explosive power, but during the ascent of the lift, the lifter moves the weight slower, which is due to biomechanics and a heavy load. Ben-Zaken et al (2018) studied 47 weightlifters (38 male, 9 female) and 86 controls. Every athlete that was studied competed in national and international meets on a regular basis. Thirty of the weightlifters were also classified as “elite”, which entails participating in and winning national and international competitions such as the Olympics and the European and World Championships).
Ben-Zaken et al (2018) did find that weightlifters had a higher prevalence of the AGT 235T polymorphism when compared to controls, though there was no difference in the prevalence of this polymorphism when elite and national-level competitors were compared, which “[suggests] that this polymorphism cannot determine or predict elite competitive weightlifting performance” (Ben-Zaken et al, 2018: 38). Of course, a favorable genetic profile is important for sporting success, though, despite the higher prevalence of AGT in weightlifters compared to controls, this could not explain the difference between national and elite-level competitors. Other polymorphisms could, of course, contribute to weightlifting success, variables “such as training experience, superior equipment and facilities, adequate nutrition, greater familial support, and motivational factors, are crucial for top-level sports development as well” (Ben-Zaken et al, 2018: 39).
I should also comment on Anatoly Karlin’s new article The (Physical) Strength of Nations. I don’t disagree with his main overall point; I only disagree that grip strength is a good measure of overall strength—even though it does follow the expected patterns. Racial differences in grip strength exist, as I have covered in the past. Furthermore, there are associations between muscle strength and longevity, with stronger men being more likely to live longer, fuller lives (Ruiz et al, 2008; Volkalis, Haille, and Meisinger, 2015; Garcia-Hermosa, et al, 2018) so, of course, strength training can only be seen as a net positive, especially in regard to living a longer and fuller life. Hand grip strength does have a high correlation with overall strength (Wind et al, 2010; Trosclair et al, 2011). While handgrip strength can tell you a whole lot about your overall health (Lee et al, 2016), of course, there is no better proxy than actually doing the lifts/exercises to ascertain one’s level of strength.
There are replicated genetic associations between explosive, powerful athletic performance, along with even the understanding of the causal mechanisms behind the polymorphisms and their carry-over to power sports. We know that if morphology is right and the individual has the RR ACTN3 genotype, that they will exceed in explosive sports. We know the causal pathways of ACTN3 and how it leads to differences in sprinting competitions. It should be worth noting that, while we do know a lot more about the genomics of sports than we did 20, even 10 years ago, current genetic testing has zero predictive power in regard to talent identification (Pitsladis et al, 2013).
So, of course, for parents and coaches who wonder about the athletic potential of their children and students, the best way to gauge whether or not they will excel in athletics is…to have them compete and compare them to other kids. Even if the genetics aspect of elite power performance is fully unlocked one day (which I doubt it will be), the best way to ascertain whether or not one will excel in a sport is to put them to the test and see what happens. We are in our infancy in understanding the genomics of sporting performance, but when we do understand which genotypes are more prevalent in regard to certain sports (and of course the interactions of the genotype with the environment and genes), then we can better understand how and why others are better in certain sports.
The genomics of elite sporting performance is very interesting; however, the answer that reductionists want to see will not appear: genes are difference makers (Sterelny and Griffith, 1999), not causes, and along with a whole slew of other environmental and mental factors (Lippi, Favaloro, and Guidi 2008), along with a favorable genetic profile with sufficient training (and everything else that comes along with it) are needed for the athlete to reach their maximum athletic potential (see Guth and Roth, 2013). Genetic and environmental differences between individuals and groups most definitely explain differences in elite sporting performance, though elucidating what causes what and the mechanisms that cause the studied trait in question will be tough.
Just because group A has gene or gene networks G and they compete in competition C does not mean that gene or gene networks G contribute in full—or in part—to sporting success. The correlations could be coincidental and non-functional in regard to the sport in question. Athletes should be studied in isolation, meaning just studying a specific athlete in a specific discipline to ascertain how, what, and why works for the specific athlete along with taking anthropomorphic measures, seeing how bad they want “it”, and other environmental factors such as nutrition and training. Looking at the body as a system will take us away from privileging one part over another—while we also do understand that they do play a role but not the role that reductionists believe.
These studies, while they attempt to show us how genetic factors cause differences at the elite level in power sports, they will not tell the whole story, because we must look at the whole system, not reduce it down to the sum of its parts (Shenk, 2011: chapter 5). While blacks are more likely to have these polymorphisms that are associated with elite power athlete performance, this does not obviously carry over to strongman and powerlifting competition.
Explaining African Running Success Through a Systems View
2100 words
Last year I bought The Genius in All of Us: New Insights Into Genetics, Talent, and IQ (Shenk, 2010) and while the book is interesting and I agree with a few things he says, he gets it horribly wrong on athleticism and ethnicity. Some of it I may be able to forgive since the book was written in 2010, but he does make some glaring errors. Chapter 6—pages 100-111—is titled Can White Men Jump? Ethnicity, Genes, Culture, and Success.
In the beginning of the chapter, Shenk writes that after the 2008 Beijing Summer Olympics, many articles were written about the Jamaican women who took the top three spots in the 100 and 200m races, with the emergence of Usain Bolt and his record-setting performance. Shenk (2010: 101) writes:
The powerful protein [alpha-actinin-3] is produced by a special gene variant called ACTN3, at least one copy of which is found in 98 percent of Jamaicans—far higher than in many other ethnic populations.
An impressive fact, but no one stopped to do the math. Eighty percent of Americans also had at least one copy of ACTN3—that amounts to 240 million people. Eighty-two percent of Europeans have it as well—that tacks on another 597 million potential sprinters. “There’s simply no clear relationship between the frequency of this variant in a population and its capacity to produce sprinting superstars,” concluded geneticist Daniel MacArthur.
I have written about MacArthur’s thoughts on the ACTN3 variant—that he helped discover, no less—in an article on Jamaicans, Kenyans, and Ethiopians and the explanatory factors in regard to their success in running competitions. Though, the article from MacArthur was written in 2008 and Shenk’s book was written in 2010, considerable advances have been made in this field. It was found that “combined effects of morphological and contractile properties of individual fast muscle fibers attribute to the enhanced performance observed in RR genotypes during explosive contractions” (Broos et al, 2016). Of course when talking about sprinting and morphology, you must think of the somatype. The somatype that is conducive to running success is a tall, lanky body with long limbs, as longer limbs can cover more distance. So European runners don’t have the right somatype, nor are the XX genotype for the ACTN3 variant high in Jamaicans (this genotype is present in ~2 percent of the Jamaican population; Scott et al, 2010). This—among other reasons I have laid out in the past—are why Jamaicans excel in sprinting competitions compared to other ethnic groups.
Shenk (2014: 10) further writes that sports success seem to come in ‘geographic clusters’, and the field of sports geography has been developed to understand it. “What they’ve discovered is that there’s never a single cause for a single cluster,” Shenk writes. “Rather, the success comes from many contributions of climate, media, demographics, politics, training, spirituality, education, economics and folklore. In short, athletic clusters are not genetic, but systemic.” Shenk then discusses the fact that these explanations are not good enough and that some ‘sports geographers’ have transformed themselves into ‘sports geneticists’ and then cites Jon Entine’s 2002 book Taboo: Why Black Athletes Dominate Sports and Why We’re Afraid to Talk About It where Shenk quotes Entine who quotes geneticist and physiologist Claude Bouchard who says that “these biological characteristics are not unique to West or East African blacks. These populations are seen in all populations, including whites” (Shenk, 2010: 102). Of course they’re not unique to one population and I don’t think that anyone has ever claimed that. Though the frequencies of these biological, morphological and physiological characteristics are not distributed evenly amongst populations and this explains how and why certain populations excel in certain sports when compared to others.
Shenk (2010: 102) also quotes Entine (2002), writing: “Entine also acknowledges that we haven’t actually found the actual genes he’s alluding to. “These genes will likely be identified early in the [twenty-first century],” he predicts.” We have ‘found some genes’ that aid in athletic performance, the ACTN3 genotype combined with type II fibers and the right morphology, as mentioned above for one. (Though a systems view—one of holism—makes much more sense here than a reducionist view. You must look at the whole system, not reduce things down, but that’s for another day.) That, in my opnion, is a large driver for ethnic differences in sports like this, because you need certain traits if you want to excel in these types of competitions.
He then discusses the success of the Kenyans in distance running—stating that 90 percent of Kenyan runners come from a small subset of Kenyans called the Kalenjin. He cites a few stories of some Kalenjin who talk about their experiences with no running water in their homes and that they had to “run to the river, to take your shower, run home, change, [run] to school . . . Everything is running” (Keino, a Kalenjin boy, quoted from Shenk, 2010: 104). Of course this is attributed to a multitude of factors, all of which have to work in concert to get the desired effect. For instance, sports psychologists have found that strong cultural achievement and the ability to work hard, compete, outdo others and seek new challenges drives their running dominance.
Shenk (2010: 106-107) then writes:
1.DESPITE APPEARANCES TO THE CONTRARY, RACIAL AND ETHNIC GROUPS ARE NOT GENETICALLY DISCRETE.
Skin color is a great deceiver; actual genetic differences between ethnic and geographic groups are very, very limited. All human beings are descended from the same African ancestors … [blah blah blah] … By no stretch of the imagination, then, does any ethnicity or region have an exclusive lock on a particular body type or secret high-performance gene. Body shapes, muscle fiber types, etc., are actually quite varied and scattered, and true athletic potential is widespread and plentiful.
Of course, I don’t think I have ever read anyone who denies this. However, as I’ve noted too many times to count, certain body types and muscle fiber distributions are more likely to be found in certain populations due to where their ancestors evolved recently, and so the fact that ‘actual genetic differences between ethnic and geographic groups are very, very, limited’ does not mean much when talking about dominance by a few populations in elite sporting competition. It just so happens to be the case that the somatypes and muscle fiber distributions that are conducive to running success are more likely to be found in populations of West and East African descent. This is an undeniable fact. (Also note how these ‘appearances to the contrary’ show how race is real.)
2.GENES DON’T DIRECTLY CAUSE TRAITS; THEY ONLY INFLUENCE THE SYSTEM.
Consistent with other lessons of GxE [Genes x Environment], the surprising finding of the $3 billion Human Genome Project is that only in rare instances do specific gene variants directly cause specific traits or diseases. …
As the search for athletic genes continues, therefore, the overwhelming evidence suggests that researchers will instead locate genes prone to certain types of interactions: gene variant A in combination with gene variant B, provoked into expression by X amount of training + Y altitude + Z will to win + a hundred other life variables (coaching, injuries, etc.), will produce some specific result R. What this means, of course, What this means, of course, is that we need to dispense rhetorically with thick firewall between biology (nature) and training (nurture). The reality of GxE assures that each persons genes interacts with his climate, altitude, culture, meals, language, customs and spirituality—everything—to produce unique lifestyle trajectories. Genes play a critical role, but as dynamic instruments, not a fixed blueprint. A seven- or fourteen- or twenty-eight-year-old is not that way merely because of genetic instruction. (Shenk, 2010: 107)
Nothing really wrong here. He is correct, which is why you need to look at the whole biological system, which also includes the culture, climate, environment and so on that the biological, developmental system finds itself in. However, Shenk then gets it wrong again writing that Jamaicans are a ‘quite heterogenous genetic group’ due to being a transport between North and South America. He states—correctly—that Jamaicans ancestry is about equal to that of African-Americans, but the individual variation in ancestry varies by “46.8 to 97.0 percent” (Shenk, 2010: 108).
Shenk gets a lot wrong here. For example. African-American and Jamaicans—despite both being descended from slave populations—have differing maternal ancestry which somehow influences athletic success. Deason (2017) found that 1) modern Jamaicans are descended from slaves and, who had considerable selective pressure on the population; 2) maternal ancestry could either influence sports success or be a false positive; 3) maternal lineages were different in Jamaicans and African-Americans, implying that the same maternal lineage is not distributed evenly between both sprinting populations; 4) some evidence exists that the genetic histories of Jamaicans and African-Americans are different based on their maternal haplotypes; 5) low SES and low access to healthcare—classic indicators of high African ancestry—were not directly linked to elite athletic success; 6) comparisons of the genomes of African-Americans and Jamaicans did not significantly differ since the estimated number of generations since admixture occurred, which implies that controls were not more likely to have more recent European ancestry than athletes; and 7) the regions of the genome that influence sprinting performance may be different in both populations. This is the best evidence to date against Shenk’s simplistic notions of the genetics between Jamaicans and African-Americans.
Differences in fast twitch fibers between Europeans and West Africans explain a large amount of the variance between Europeans and West African descendants in regard to sprinting success, while those with more symmetrical knees and ankles tend to run faster in the 100m dash (Trivers et al, 2014). This would also imply that Jamaicans have more symmetry in their knees and ankles than Europeans, though I am not aware of data that makes this comparison.
Shenk finally discusses the psycho-social-cultural aspects behind the phenomenon, stating that Roger Bannister, the first person to break the four minute mile, stated that while “biology sets limits to performance, it is the mind that plainly determines how close individuals come to those absolute limits” (Shenk, 2010: 110-111). Numerous psychological factors do, indeed, need to combine in order for the individual in question to excel in sports—along with the requisite anatomical/physiological/morphological traits too. Sasaki and Sekiya note that “changes in physiological arousal and movement velocuty induced by mild psychological pressure played a significant role in the sprint performance.” (See also Bali, 2015.)
Lippi, Favaloro, and Guidi, (2008) note how “An advantageous physical genotype is not enough to build a top-class athlete, a champion capable of breaking Olympic records, if endurance elite performances (maximal rate of oxygen uptake, economy of movement, lactate/ventilatory threshold and, potentially, oxygen uptake kinetics) (Williams & Folland, 2008) are not supported by a strong mental background.” I have argued this for months, even if the beneficial somatype is there in the athlete in question, if he/she does not have the will to win they will not succeed in their goals. Psychosocial factors, of course, matter just as much as the physical but all of these factors work in concert to get the outcomes that occur in these sports.
Attempting to pinpoint one or a few traits—while it may help us to understand better physilogic and anatomic processes—tells us nothing about the entire system. This is why, for instance, the whole athletes system needs to be looked at—call it the ‘systems view of the athlete’, where all of these aforementioned variables work in concert to express elite athletic performance, with no one variable being higher than another as an explanatory factor in sports success. Though Shenk gets a few things right (like his point on genes not causing traits on their own, they just influence the system, and I’d take it a step further to note that genes are passive in their relationship to the physiological system as a whole and are only activated by the system as needed, not being ’causes’ on their own; Noble, 2008), he’s largely misguided on how certain aspects of Jamaican ancestry and morphology help propel them to running success in comparison to other ethnies.
When explaining elite athletic performance in certain areas of sports, you must take a view of the whole system, with each known variable influencing the next in the chain, if you want to explain why certain ethnies or racial groups do better in a given sport than other groups. A systems view is the only view to take when comparing populations in different athletic competitions. So the influence of culture, psychology, social effects, morphology, ancestry, anatomy, physiology, muscle fibers, etc all work in concert to produce elite athletic phenotypes that then excel in these sports, and reducing this down to certain variables—while it may help us understand some of the inner mechanics—it does nothing to help advance the hows and whys of elite success in sports competition when comparing different populations.
Black-White Differences in Physiology
2050 words
Black-white differences in physiology can tell a lot about how the two groups have evolved over time. On traits like resting metabolic rate (RMR), basal metabolic rate (BMR), adiposity, heart rate, Vo2 max, etc. These differences in physiological variables between groups, then, explain part of the reason why there are different outcomes in terms of life quality/mortality between the two groups.
Right away, by looking at the average black and average white, you can see that there are differences in somatype. So if there are differences in somatype, then there must be differences in physiological variables, and so, this may be a part of the cause of, say, differing obesity rates between black and white women (Albu et al, 1997) and even PCOS (Wang and Alvero, 2013).
Resting metabolic rate
Resting metabolic rate is your body’s metabolism at rest, and is the largest component of the daily energy budget in modern human societies (Speakman and Selman, 2003). So if two groups, on average, differ in RMR, then one with the lower RMR may have a higher risk of obesity than the group with the higher RMR. And this is what we see.
Black women do, without a shadow of a doubt, have a lower BMR, lower PAEE (physical activity energy expenditure) and TDEE (total daily expenditure) (Gannon, DiPietro, and Poehlman, 2000). Knowing this, then it is not surprising to learn that black women are also the most obese demographic in the United States. This could partly explain why black women have such a hard time losing weight. Metabolic differences between ethnic groups in America—despite living in similar environments—show that a genetic component is responsible for this.
There are even predictors of obesity in post-menopausal black and white women (Nicklas et al, 1999). They controlled for age, body weight and body composition (variables that would influence the results—no one tell me that “They shouldn’t have controlled for those because it’s a racial confound!”) and found that despite having a similar waist-to-hip ratio (WHR) and subcutaneous fat area, black women had lower visceral fat than white women, while fasting glucose, insulin levels, and resting blood pressure did not differ between the groups. White women also had a higher Vo2 max, which remained when lean mass was controlled for. White women could also oxidize fat at a higher rate than black women (15.4 g/day, which is 17% higher than black women). When this is expressed as percent of total kcal burned in a resting state, white women burned more fat than black women (50% vs 43%). I will cover the cause for this later in the article (one physiologic variable is a large cause of these differences).
We even see this in black American men with more African ancestry—they’re less likely to be obese (Klimentidis et al 2016). This, too, goes back to metabolic rate. Black American men have lower levels of body fat than white men (Vickery et al, 1988; Wagner and Heyward, 2000). All in all, there are specific genetic variants and physiologic effects, which cause West African men to have lower central (abdominal) adiposity than European men and black women who live in the same environment as black men—implying that genetic and physiologic differences between the sexes are the cause for this disparity. Whatever the case may be, it’s interesting and more studies need to be taken out so we can see how whatever gene variants are *identified* as protecting against central adiposity work in concert with the system to produce the protective effect. Black American men have lower body fat, therefore they would have, in theory, a higher metabolic rate and be less likely to be obese—while black women have the reverse compared to white women—a lower metabolic rate.
Skeletal muscle fiber
Skeletal muscle fibers are the how and why of black domination in explosive sports. This is something I’ve covered in depth. Type II fibers contract faster than type I. This has important implications for certain diseases that black men are more susceptible to. Though the continuous contraction of the fibers during physical activity leads to a higher disease susceptibility in black men—but not white men (Tanner et al, 2001). If you’re aware of fiber type differences between the races (Ama et al, 1986; Entine, 2000; Caeser and Henry, 2015); though see Kerr (2010’s) article The Myth of Racial Superiority in Sports for another view. That will be covered here in the future.
Nevertheless, fiber typing explains racial differences in sports, with somatype being another important variable in explaining racial disparities in sports. Two main variables that work in concert are the somatype (pretty much body measurements, length) and the fiber type. This explains why blacks dominate baseball and football; this explains why ‘white men can’t jump and black men can’t swim’. Physiological variables—not only ‘motivation’ or whatever else people who deny these innate differences say—largely explain why there are huge disparities in these sports. Physiology is important to our understanding of how and why certain groups dominate certain sports.
This is further compounded by differing African ethnies excelling in different running sports depending on where their ancestors evolved. Kenyans have an abundance of type I fibers whereas West Africans have an abundance of type II fibers. (Genetically speaking, ‘Jamaicans’ don’t exist; genetic testing shows them to come from a few different West African countries.) Lower body symmetry—knees and ankles—show that they’re more symmetrical than age-matched controls (Trivers et al, 2014). This also goes to show that you can’t teach speed (Lombardo and Deander, 2014). Though, of course, training and the will to want to do your best matter as well—you just cannot excel in these competitions without first and foremost having the right physiologic and genetic make-up.
Further, although it’s only one gene variant, ACTN3 and ACE explain a substantial percentage of sprint time variance, which could be the difference between breaking a world record and making a final (Papadimitriou et al, 2016). So, clearly, certain genetic variants matter more than others—and the two best studied are ACTN3 and ACE. Some authors, though, may deny the contribution of ACTN3 to elite athletic performance—like one researcher who has written numerous papers on ACTN3, Daniel MacArthur. However, elite sprinters are more likely to carry the RR ACTN3 genotype compared to the XX ACTN3 genotype, and the RR ACTN3 genotype—when combined with type II fibers and morphology—lead to increased athletic performance (Broos et al, 2016). It’s also worth noting that 2 percent of Jamaicans carry the XX ACTN3 genotype (Scott et al, 2010), so this is another well-studied variable that lends to superior running performance in Jamaicans.
In regards to Kenyans, of course when you are talking about genetic reasons for performance, some people don’t like it. Some may say that certain countries dominate in X, and that for instance, North Africa is starting to churn out elite athletes, should we begin looking for genetic advantages that they possess (Hamilton, 2000)? Though people like Hamilton are a minority view in this field, I have read a few papers that there is no evidence that Kenyans possess a pulmonary system that infers a physiologic advantage over whites (Larsen and Sheel, 2015).
People like these three authors, however, are in the minority here and there is a robust amount of research that attests to East African running dominance being genetic/physiologic in nature—though you can’t discredit SES and other motivating variables (Tucker, Onywera, and Santos-Concejero, 2015). Of course, a complex interaction between SES, genes, and environment are the cause of the success of the Kalenjin people of Kenya, because they live and train in such high altitudes (Larsen, 2003), though the venerable Bengt Saltin states that the higher Vo2 max in Kenyan boys is due to higher physical activity during childhood (Saltin et al, 1995).
Blood pressure
The last variable I will focus on (I will cover more in the future) is blood pressure. It’s well known that blacks have higher blood pressure than whites—with black women having a higher BP than all groups—which then leads to other health implications. Some reasons for the cause are high sodium intake in blacks (Jones and Hall, 2006); salt (Lackland, 2014; blacks had a similar sensitivity than whites, but had a higher blood pressure increase); while race and ethnicity was a single independent predictor of hypertension (Holmes et al, 2013). Put simply, when it comes to BP, ethnicity matters (Lane and Lip, 2001).
While genetic factors are important in showing how and why certain ethnies have higher BP than others, social factors are arguably more important (Williams, 1992). He cites stress, socioecologic stress, social support, coping patterns, health behavior, sodium, calcium, and potassium consumption, alcohol consumption, and obesity. SES factors, of course, lead to higher rates of obesity (Sobal and Stunkard, 1989; Franklin et al, 2015). So, of course, environmental/social factors have an effect on BP—no matter if the discrimination or whatnot is imagined by the one who is supposedly discriminated against, this still causes physiologic changes in the body which then lead to higher rates of BP in certain populations.
Poverty does affect a whole slew of variables, but what I’m worried about here is its effect on blood pressure. People who are in poverty can only afford certain foods, which would then cause certain physiologic variables to increase, exacerbating the problem (Gupta, de Wit, and McKeown, 2007). Whereas diets high in protein predicted lower BP in adults (Beundia et al, 2015). So this is good evidence that the diets of blacks in America do increase BP, since they eat high amounts of salt, low protein and high carb diets.
Still, others argue that differences in BP between blacks and whites may not be explained by ancestry, but by differences in education, rather than genetic factors (Non, Gravlee, and Mulligan, 2012). Their study suggests that educating black Americans on the dangers and preventative measures of high BP will reduce BP disparities between the races. This is in-line with Williams (1992) in that the social environment is the cause for the higher rates of BP. One hypothesis explored to explain why this effect with education was greater in blacks than whites was that BP-related factors, such as stress, poverty and racial discrimination (remember, even if no racial discrimination occurs, any so-called discrimination is in the eye of the beholder so that will contribute to a rise in physiologic variables) and maybe social isolation may be causes for this phenomenon. Future studies also must show how higher education causes lower BP, or if it only serves as other markers for the social environment. Nevertheless, this is an important study in our understanding of how and why the races differ in BP and it will go far to increase our understanding of this malady.
Conclusion
This is not an exhaustive list—I could continue writing about other variables—but these three are some of the most important as they are a cause for higher mortality rates in America. Understanding the hows and whys of these variables will have us better equipped to help those who suffer from diseases brought on by these differences in physiological factors.
The cause for some of these physiologic differences come down to evolution, but still others may come down to the immediate obesogenic environment (Lake and Townshend, 2006) which is compounded by lower SES. Since high carbs diets increase BP, this explains part of the reason why blacks have higher BP, along with social and genetic factors. Muscle fiber typing is set by the second trimester, and no change is seen after age 6 (Bell, 1980). Resting metabolic rate gap differences between black and white women can be closed, but not completely, if black women were to engage in exercise that use their higher amounts of type II muscle fibers (Tanner et al, 2001). This research is important to understand differences in racial mortality; because when we understand them then we can begin to theorize on how and why we see these disparities.
Physiologic differences between the races are interesting, they’re easily measurable and they explain both disparities in sports and mortality by different diseases. Once we study these variables more, we will be better able to help people with these variables—race be dammed. Race is a predictor here, only because race is correlated with other variables that lead to negative health outcomes. So once we understand how and why these differences occur, then we can help others with similar problems—no matter their race.
Racial Differences in Physical Activity and Acquisition of Coronary Artery Calcification
1200 words
Last week a study was published stating that white men who exercised 3 times the recommendation of 1.5 hours (450 minutes, 7.5 hours) had a higher chance of getting coronary artery calcification (CAC), which is the accumulation of plaque and calcium in the arteries of the heart. You, of course see news headlines such as: “Physically active white men at high risk for plaque buildup in arteries“; “White Men Who Exercise Every Day Have 86 Per Cent Higher Risk of Heart Disease Than Black Men, Study Claims“; “Excessive Exercise May Harm The Heart, Study Suggests “; “Excessive exercise increases risk of arterial plaque buildup in white men“; (and my personal favorite headline about this study): “You can exercise yourself to death, says new study“. People just passing by and reading the title (like most do) may then conclude that “they’re saying not to exercise because of CAC.” No, this is not what they are saying at all.
The Coronary Artery Risk Development in Young Adults (CARDIA) study is one of the most important studies in the study of coronary heart disease that have been undertaken. It is a sample of men and women, about equal numbers of each race, from Birmingham, Alabama; Chicago, Illinois; Minneapolis, Minnesota; and Oakland, California. The study began in 1985-86 and there were follow-up examinations at “1987-1988 (Year 2), 1990-1991 (Year 5), 1992-1993 (Year 7), 1995-1996 (Year 10), 2000-2001 (Year 15), 2005-2006 (Year 20), 2010-2011 (Year 25), and 2015-2016 (Year 30).” The CARDIA website writes:
Data have also been collected on physical measurements such as weight and body composition as well as lifestyle factors such as dietary and exercise patterns, substance use (tobacco and alcohol), behavioral and psychological variables, medical and family history, and other chemistries (e.g., insulin).
So there is a goldmine of information to be gleaned from this data. The study that is getting press in the news uses data from this cohort.
The study
The study is titled 25-Year Physical Activity Trajectories and Development of Subclinical Coronary Artery Disease as Measured by Coronary Artery Calcium by Laddu et al (2017). They studied three cohorts by the amount of time they exercised per week: below requirement, at requirements, or above requirements. It is recommended to exercise at least 150 minutes per week.
There were 3,175 men and women who participated in the CARDIA study between 1985 and 2011 who had CAC data available for 25 years. About 47.4 percent of the sample was black, with 56.6 being women. The cohort “consisted of 18.9% black men, 24.6% white men, 28.6% black women, and 28.0% white women” (Laddu et al, 2017).
Of the three activity levels they studies (below 150 minutes, 150 minutes, and over 150 minutes), they observed that white men who exercised 3 times the weekly recommendation (150 minutes(3)= 450 minutes=7.5 hours) had a higher chance of developing CAC. It’s worth noting that exercise time was self-reported (which is the only way I can see how something like this would work, are you supposed to follow people with a camera every day to see how long they engage in physical activity?).
In regards to the physical activity measurement, Laddu et al (2017) write:
At each of the 8 examinations, self-reported leisure-time PA was ascertained by the interviewer-administered CARDIA Physical Activity History Questionnaire.17 Participants were asked about the frequency of participation in 13 specific categories (8 vigorous intensity and 5 moderate intensity) of recreational sports, exercise, home maintenance, and occupational activities during the previous 12 months. Intensity for each activity was expressed as metabolic equivalents (METs), in which 1 MET is defined as the energy expended at rest, which is approximately equivalent to an oxygen consumption of 3.5 mL per 1 kg of body weight per minute.18Vigorous activities (≥6 METs) included running or jogging; racquet sports; biking; swimming; exercise or dance class; job lifting, carrying, or digging; shoveling or lifting during leisure; and strenuous sports. Moderate-intensity activities (3-5 METs) included nonstrenuous sports, walking and hiking, golfing and bowling, home exercises or calisthenics, and home maintenance or gardening.19 Each activity was scored according to whether it was performed for 1 hour or longer during any 1 month during the past year, the number of months it was performed at that level, and the number of months the activity was performed frequently. Each activity was then assigned an intensity score, ranging from 3 to 8 METs, and a duration threshold (ranging from 2-5 hours per week), above which participation was considered to be frequent.20
This is a good metric; though I would like to see a study that looks at just gym-going activity and death, time spent in the gym strength training/moderate to intense cardio. Nevertheless, white men who reported more physical activity had a higher chance of acquiring CAC. Though I can see people’s recall being hazy, people over/under reporting, etc etc.
White men who exercised 7.5 hours per week were 27 percent more likely to get CAC, whereas blacks who exercised that much were at no greater risk to acquire CAC when compared to whites (7.5 hours of exercise compared to less than 2.5 hours per week). Black women who exercised less than the recommendations had a higher chance of acquiring CAC. The researchers couldn’t ascertain why white men who exercised three times the recommendations had such a higher chance of acquiring CAC by the time they reached middle age, but Dr. Jamal Rana says “however this plaque buildup may well be of the more stable kind, and thus less likely to rupture and causes heart attack, which was not evaluated in this study.” The head author, Dr. Deepika Laddu also reiterated: “it does not suggest that anyone should stop exercising.” So people who just read these click bait headlines who say “They’re telling whites not to exercise!”, you’re wrong and you should read papers and not news articles.
This is the perfect example of people reading click baity, fear-mongering headlines and running with it. I saw some people saying “They’re telling us not to exercise!” No. If you were to read the paper and any serious news articles on the matter, you’d see that they do not recommend that people do not exercise. Now the question is, why do whites who exercise more than 7.5 hours per week have a higher chance of acquiring heart disease? I can think of a few explanations (though they are not satisfactory): 1) genes: which genes? Why? How do they interact with the body over time to lead to arterial calcification?; 2) dietary habits: I’d like to know what their diet was like and see their macro composition, carbohydrates, not saturated fat, causes heart disease (Siri-Tirino et al, 2010; de Souza et al, 2015) so that may be a huge contributing factor.
Nevertheless, this is yet another physiological race difference. Oddly enough, black men are more likely than white men to have hypertension (Hicken et al, 2013).
Even though black men, on average, have higher rates of hypertension than white men, white men who are physically active for 7.5 had a higher chance of acquiring CAC than those who exercised less than 2.5 hours per week. This effect wasn’t seen in black men who had physical activity at that level, which, of course, implies that differences in genes and SES underlie this difference. I await more papers into this matter into the mechanisms of how and why this occurs and will ruminate on this myself in the future. No, this study does not tell white men not to exercise.
Weight Loss and the Microbiome
1450 words
Last month I argued that there was more to weight loss than CI/CO. One of the culprits is a virus called Ad-36. Obese people are more likely to have Ad-36 antibodies in comparison to lean people, which implies that they have/had the virus and could be a part of the underlying cause of obesity. However, a paper was recently published that your stool can predict whether or not you can lose weight. This is due to how certain bacteria in the gut respond to different macronutrients ingested into the body.
ScienceDaily published an article a few days ago titled Your stools reveal whether you can lose weight. In the article, they describe the diets of the cohort, which followed 31 people, some followed the New Nordic Diet (NND), while others followed the Average Danish Diet (ADD) (Hjorth et al, 2017; I can’t find this study!! I’ll definitely edit this article after I read the full paper when it is available). So 31 people ate the NDD for 26 weeks, and lost 3.5 kg (7.72 pounds for those of us who use freedom numbers) while those who ate the ADD lost an average of 1.7 kg (3.75 pounds for those of us who use freedom numbers). So there was a 1.8 kg difference in pounds lost between the two diets. Why?
Here’s the thing: when people were divided by their microbiota, those who had a higher proportion of Prevotella to Bacteriodoites lost 3.5 more kg (7.72 pounds) in 26 weeks when they ate the NND in comparison to the ADD. Those who had a lower proportion of Prevotella to Bacteriodoites lost no additional weight on the NND. Overall, they say, about 50 percent of the population would benefit from the NND, while the rest of the population should diet and exercise until new measures are found.
The New Danish Diet is composed of grains, fruits, and vegetables. The diet worked for one-half of the population, but not for the other. The researchers state that people should try other diets and to exercise for weight loss while they study other measures. This is important to note: the same diet did not induce weight loss in a population; the culprit here is the individual microbiome.
Now that those Bacteroidotes have come up again, this quote from Allana Collen’s 2014 book 10% Human: How Your Body’s Microbes Hold the Key to Health and Happiness:
But before we get too excited about the potential for a cure for obesity, we need to know how it all works. What are these microbes doing that make us fat? Just as before, the microbiotas in Turnbaugh’s obese mice contained more Firmicutes and fewer Bacteroidetes, and they somehow seemed to enable the mice to extract more energy from their food. This detail undermines one of the core tenets of the obesity equation. Counting ‘calories-in’ is not as simple as keeping track of what a person eats. More accurately, it is the energy content of what a person absorbs. Turnbaugh calculated that the mice with the obese microbiota were collecting 2 per cent more calories from their food. For every 100 calories the lean mice extracted, the obese mice squeezed out 102.
Not much, perhaps, but over the course of a year or more, it adds up. Let’s take a woman of average height. 5 foot 4 inches, who weights 62 kg (9st 11 lb) and a healthy Body Mass Index (BMI: weight (kg) /(height (m)^2) of 23.5. She consumes 2000 calories per day, but with an ‘obese’ microbiota, her extra 2 per cent calorie extraction adds 40 more calories each day. Without expending extra energy, those further 40 calories per day should translate, in theory at least, to a 1.9 kg weight gain over a year. In ten years, that’s 19 kg, taking her weight to 81 kg (12 st 11 lb) and her BMI to an obese 30.7. All because of just 2 percent extra calories extracted from her food by her gut bacteria.
This corresponds with the NND/ADD study on weight loss… This proves that there is more than the simplistic CI/CO to weight loss, and that an individual’s microbiome/physiology definitely does matter in regards to weight loss. Clearly, to understand the population-wide problem of obesity we must understand the intricate relationship between the microbiome/brain/gut/body relationship and how it interacts with what we eat. Because evidence is mounting that the individual’s microbiome houses the key to weight loss/gain.
Exercise does not induce weight loss. A brand new RCT (randomized controlled trial) showed that in a cohort of children who were made to do HIIT (high-intensity interval training) did show better cardiorespiratory fitness, but there were no concomitant reductions in adiposity and bio blood markers (Dias et al, 2017). What this tells me is that people should exercise for health and that ‘high’ that comes along with it; if people exercise for weight loss they will be highly disappointed. Note, I am NOT saying to not exericse, I’m only saying to not have any unrealistic expectations that cardio will induce it, it won’t!
Bjornara et al (2016) showed that, when the NND was compared to the ADD, there was better adherence to the NND when compared to the ADD. Poulskin et al (2015) showed that the NND provided higher satisfaction, and body weight reduction with higher compliance with the NND and with physical activity (I disagree there, see above).
This study is important for our understanding of weight loss for the population as a whole. More recent evidence has shown that our microbiome and body clock work together to ‘pack on the pounds‘. This recent study found that the microbiome “regulate[s] lipid (fat) uptake and storage by hacking into and changing the function of the circadian clocks in the cells that line the gut.” The individual microbiome could induce weight gain, especially when they consume a Western diet, which of course is full of fat and sugar. One of the most important things they noticed is that mice without a microbiome fared much better on a high-fat diet.
The microbiome ‘talks’ to the gut lining. Germ-free mice were genetically unable to make NFIL3 in the cell lining of the gut. So germ-free mice lack a microbiome and lower than average production of NFIL3, meaning they take up and store fewer lipids than those with a microbiome.
So the main point about this study is the circadian rhythm. The body’s circadian clock recognizes the day/night system, which of course are linked to feeding times, which turn the body’s metabolism on and off. Cells are not directly exposed to light, but they capture light cues from visual and nervous systems, which then regulates gene expression. The gut’s circadian clock then regulates the expression of NFIL3 and the lipid metabolic machinery which is controlled NFIL3. So this study shows how the microbiome interacts with and impacts metabolism. This could also, as the authors state, explain how and why people who work nights and have shift-work disorder and the concurrent metabolic syndromes that come along with it.
In regards to the microbiome and weight loss, it is poorly understood at the moment (Conlon and Bird, 2015), though a recent systematic review showed that restrictive diets and bariatric surgery “reduce microbial abundance and promote changes in microbial composition that could have long-term detrimental effects on the colon.” They further state that “prebiotics might restore a healthy microbiome and reduce body fat“(Segenfrado et al, 2017). Wolf and Lorenz (2012) show that using “good” probiotic bacteria may induce changes in the obese phenotype. Bik (2015) states that learning more about the microbiome, dysbiosis (Carding et al, 2015), and how the microbiome interacts with our metabolism, brain, and physiology, then we can better treat those with obesity due to the dysbiosis of the microbiome. Clark et al (2012) show how the mechanisms behind the microbiota and obesity.
Weight loss is, clearly, more than CI/CO, and once we understand other mechanisms of weight loss/gain/regulation then we can better treat people with these metabolic syndromes that weirdly are all linked to each other. Diets affect the diversity of the microbiome, the diversity of the microbiome already there though, may need other macro/micro splits in order to show differing weight loss, in the case of the NND and ADD study reviewed above. Changes in weight do change the diversity of the microbiome of an individual, however, the heritable component of the microbiome may mean that some people need to eat different foods compared to others who have a different microbiome. Over time, new studies will show how and why the macro/micronutrient content matters for weight loss/gain.
Clearly, reducing the complex physiological process of weight gain/loss to numbers and ignoring the physiological process and how the microbiome induces weight gain/loss and works together with our other body’s cells. As the science grows here we will have a much greater understanding of our body’s weight loss mechanisms. Once we do that, then we can better help people with this disease.
Diet and Exercise: Don’t Do It?
1800 words
On Twitter, JayMan linked to a video about a time traveling dietician who travels back to the 70s to give nutritional advice to a couple. He kept going back on what he said, re eggs and cholesterol, Paleo diet, etc. Then at the end of the video, the ‘time traveling dietician’ says “It turns out it’s genetic. It doesn’t matter whether you exercise or what you eat.”
I then asked JayMan if he was advising people to not diet or exercise—and if he was doing so—what credentials does he have to give such advice? “Appeal to authority!” So if some random guy gave me legal advice and I asked his credentials, is that an appeal to authority? Similarly, if someone is trying to give me medical advice, is asking where he got his medical license an appeal to authority? The thing is, people have specialties for a reason. I wouldn’t take diet and exercise advice from some anon blogger with no credentials, just like I wouldn’t take legal advice from a biologist. Anyway, I’ll review some studies on exercise, dieting, and sitting in regards to all-cause mortality.
Sitting and all-cause mortality
Listening to such advice—like not dieting or exercising—will lower your quality of life and life expectancy. The longer you sit, the more likely you are to have rolled shoulders among other postural imbalances. One of the biggest reasons that sitting is related to all-cause mortality (Chau et al, 2013; Biddle et al, 2016). So listening to this shitty advice to ‘not exercise’ will lead an individual to having a lower QoL and lower life expectancy.
Sitting is associated with all-cause mortality because if, say, one is sitting at a desk for 8 hours per day then goes home and sits for the rest of the day, circulation will not get not get to the lower extremities. Furthermore, even mild-to-moderate exercise attenuates the situation (Chau et al, 2013). Further, reducing sedentary behavior (and of course, watching less TV) can possibly raise life expectancy in the US (Katzmarzyk and Lee, 2012). They found that cutting daily sitting time to less than three hours can increase life expectancy by two years (and, of course, quality of life). There is a large body of research on sitting and all-cause mortality (Stamatakis et al, 2013). It’s also worth noting that too much sitting decreases life expectancy—even with exercise. So JayMan’s (unprofessional) advice will lead to someone having a shitty life quality and lower life expectancy.
Dieting, and all-cause mortality
This is a bit trickier. I know that dieting for weight loss doesn’t work (Aamodt, 2016; Fung, 2016)—that is, traditional dieting (high-carb diets). The traditional advice is to eat high-carb, low-fat and moderate protein—this is due to what occurred in the 70s—the demonization of fat and the championing of carbs. This, clearly, is wrong. This has led to the obesity epidemic and the cause is our evolutionary novel environments. The main reason is that we have constructed environments for ourselves that are novel, and thus we’ve not had enough time to adapt to what we eat/how we live our new lives in our modernized world.
Indeed, even hunter-gathers don’t have our disease rates that we have—having low to no cases of our diseases of civilization (see Taubes, 2007 for a review). Why is this? It’s because they are physically active and they do not eat the same processed carbohydrates that we in first-world societies do.
In regards to exercise and all-cause mortality, people who exercise more often have a lower chance of dying from all causes than more sedentary people (Oja et al, 2016; O’Donovan et al, 2017). So it’s becoming clear that JayMan is just talking out out his ass here. I’d love to hear any MD say to a patient “Don’t diet, don’t exercise. Don’t eat well. It doesn’t work.” Because that MD will be a shill for Big Food.
Further, when I say ‘diet’, I don’t mean eating below the BMR. Your ‘diet’ is what you eat, and by changing your diet, you’re changing to healthier habits and eating higher-quality foods. People like JayMan make it seem like you should eat whatever you want and not to exercise. Following this advice, however, will lead to deleterious consequences.
It DOES matter what you put into your body; it DOES matter if you exercise or not. If you do not, you will have a lower life expectancy than who does exercise and eats well.
On a side note, I know that dieting does not work for weight loss. Traditional dieting, that is. Dr. Jason Fung, world-renowned obesity, diabetes and intermittent fasting expert, has people lose and keep their weight off. He actually understands what causes obesity—insulin. Higher insulin levels are also tied to the obesity pathway through lack of glucagon receptors (Lee et al, 2014). Why is this important? First, we have to understand what insulin does in the body. Once you understand what insulin does in the body then you will see why JayMan is wrong.
Insulin inhibits the breakdown of fat in the adipose tissue by inhibiting the lipase that hydrolyzes (the chemical breakdown of a compound due to a reaction with water) the fat out of the cell. Since insulin facilitates the entry of glucose into the cell, when this occurs, the glucose is synthesized into glycerol. Along with the fatty acids in the liver, they both are synthesized into triglycerides in the liver. Due to these mechanisms, insulin is directly involved with the shuttling of more fat into the adipocyte. Since insulin has this effect on fat metabolism in the body, it has a fat-sparing effect. Insulin drives most cells to prefer carbohydrates for energy. Putting this all together, insulin indirectly stimulates the accumulation of fat into the adipose tissue.
Does this physiologic process sound that you can ‘eat whatever you want’? Or does it tell you that you should lower your carb intake as to not induce blood glucose spikes which lead to an increase in insulin? Over time, these constant blood glucose/insulin spikes lead to insulin resistance which has the body produce more insulin due to the insulin resistance resulting in a vicious cycle.
So, it seems that in order to have a higher QoL and life expectancy, one must consume processed carbs very sparingly.
These behaviors of over consuming processed carbohydrates come down to the environments we have constructed for ourselves—obesogenic environments. An obesogenic environment “refers to an environment that helps, or contributes to,
obesity” (Powell, Spears, and Rebori, 2010).
Our current obesogenic environment also contributes to dementia and cognitive impairment. What makes environments ‘obesogenic’ “is the increased presence of food cues and the increased consumption of a diet which compromises our ability to resist those cues” (Martin and Davidson, 2015). So if our obesogenic environments change, then we should see a reduction in the number of overweight/obese people.
Diet is very important for Type II diabetics. For instance, TII diabetics can manage, and even reverse, their disease with a low-carb ketogenic diet (LCKD) lowering their hBA1c, having a better lipid profile, cardiac benefits, weight loss etc (Westman et al, 2008; Azar, Beydoun, and Albadri, 2016; Noakes and Windt, 2016; Saslow et al, 2017). I wonder if JayMan would tell TII diabetics not to diet or exercise…. That’d be a recipe for disaster. TII diabetics need to keep their insulin down and eating an LCKD will do that; taking JayMan’s ‘advice’ not to diet or exercise will quickly lead to more weight gain, an exacerbation of problems and, eventually, death due to complications from not correctly managing the disease. JayMan needs to learn the literature and understand these papers to truly understand why he is wrong.
Exercise and all-cause mortality
The relationship between vigorous exercise and all-cause mortality is well studied. Gebel et al (2015) conclude that “Independent of the total amount of physical activity, engaging in some vigorous activity was protective against all-cause mortality. This finding applied to both sexes, all age categories, people with different weight status, and people with or without cardiometabolic disease.” Reduced exercise capacity also causes higher all-cause mortality rates (McAuley et al, 2016).
Unfit thin people had two times higher mortality rate than normal weight fit people. Further, overweight and obese fit people had similar mortality rates when compared to normal weight fit people (Barry et al, 2013). Clearly, physical activity needs to be heightened if one wants to live a longer, higher quality life. This runs completely opposite of what JayMan is implying.
Exercise into old age is also related to higher cognition and lower mortality rate in when compared to individuals who do not exercise. Exercise also protects against cognitive degeneration in the elderly (Bherer, Erikson and Lie-Ambrose, 2013; Carvalho et al, 2014; Paillard, 2015). If you want to keep your cognition into old age and live longer, it seems like your best bet is to exercise at a young age in order to stave off cognitive degeneration.
Strength and mortality
Finally, one last thing I need to touch on is strength and mortality. Strength is, obviously, increased through exercise. Stronger men live longer—and are protected from more disease such as cancer—than weaker men, even when controlling for cardiorespiratory fitness and other confounds (Ruiz et al, 2008).
As I have covered in the past, differences in grip strength account for differences in mortality in men—which also has a racial component (Araujo et al, 2010; Volkalis, Halle, and Meisinger, 2015). The stronger you are, the less chance you have of acquiring cancer and other maladies. Does the advice of ‘don’t exercise’ sound good now? It doesn’t, and I don’t know why anyone would seriously imply that dieting and exercise doesn’t work.
Conclusion
Dieting (meaning eating a higher quality diet, not attempting to lose weight) and exercise do work to increase life expectancy. The advice of “don’t do anything, it’s genetic” makes no sense at all after one sees the amount of literature there is on eating mindfully and exercising. I know that exercise does not induce weight loss, but it does contribute to living longer and staving off disease.
People should stay in their lane and leave things to the professionals—the people who are actually working with individuals every day and know and understand what they are going through. The canard of ‘eat whatever, don’t exercise, it’s genetic’ is very dangerous, especially today when obesity rates are skyrocketing. JayMan needs to learn the literature and how and why exercise and eating right leads to a higher quality of life and life expectancy. Thankfully, people like JayMan who say not to diet or exercise have no pull in the real world.
Clearly, to live longer, eat right, don’t sit for too long (because even if you exercise, sitting too long will lower your life expectancy) and exercise into old age and your chance of acquiring a whole slew of deleterious diseases will be lessened.
The West’s Sperm Decline: Is It True?
2200 words
Another day, another slew of articles full of fear mongering. This one is on sperm decline in the West. Is it true? I have recently covered on this blog that as of July 17th, 2017, the testosterone range for men decreased (more on that when I get access to the paper). I have also covered the obesity epidemic a bit, and that also factors in to lowered testosterone and, of course, low spermatoza count. Due to these environmental factors, we can logically deduce that sperm counts have fallen as well. However, as I will cover, it may not be so cut and dry due to analyzing numerous studies with different counting methodologies among numerous other confounds that will be addressed below. First I will cover the physiology of sperm production and what may cause decreases in production. Next, I will cover the new study that is being passed around. Finally, I will talk about why you should worry about this.
Physiology of sperm production
The accumulation of testosterone by ABP leads to the onset and rising rate of sperm production. So if testosterone production ceases or decreases, then subsequent decreases in sperm count and spermatogenesis should follow. If this change is drastic, infertility will soon follow. The process of sperm production is called spermatogenesis. It occurs in the seminiforous tubules and involves three main events: 1) remodeling relatively large germ cells into smaller mobile cells with flagella, 2) reducing the chromosome number by half, and 3) shuffling the genes so that each chromosome in the sperm carries novel gene combinations that differ from the parents. This is what ensures that a child will differ from their parents but still, at the same time, will be similar to them. The process by which this occurs is called meiosis, in which four daughter cells split which subsequently differentiate sperm (Saladin, 2010: 1063).
After the conclusion of meiosis I, each chromosome is still double stranded, except each daughter cell only has 23 chromosomes becoming a haploid while at the end of meiosis II, there are four haploid cells with 23 single-stranded chromosomes. Fertilization then combined the 23 chromosomes from the father and mother, which “reestablishes the diploid number of 46 chromosomes in the zygote“(Saladin, 2010: 1063-1064).
Spermatogonia divide by mitosis and then enlarge to become primary spermatocyte. The cell is then protected from the immune system since it is going to become genetically different from the rest of the cells in the body. Since the cells are guarded from the body’s immune system, the main spermatocyte undergoes meiosis I, giving rise to equal size haploid and genetically unique secondary spermatocytes. Then, each secondary spermatocyte undergoes meiosis II dividing into two spermatids with a total of four spermatogoniom. Lastly, the spermatozoa undergo no further division but undergoes spermiogenesis in which it differentiates into a single spermatozoon (Saladin, 2010: 1065-1066). Young men produce about 300,000 sperm per minute, about 400 million per day.
Sperm decrease?
The new study was published on July 25, 2017, in the journal Human Reproduction Update titled Temporal trends in sperm count: a systematic review and meta-regression analysis. Levine et al (2017) used 185 studies (n=42,935) and showed a sperm count (SC) decline of .75 percent per year, coming out to a 28.5 percent decrease between 1975 and 2011. Similar declines were seen in total sperm count (TSC) while 156 estimates of serum volume showed little change.
Figure 2a shows the mean sperm concentration between the years 1973 and 2011. Figure 2b shows the mean total sperm count between those same years.
Figure 3a shows sperm concentration for the West (North America, Australia, Europe and New Zealand) vs Other (South America, Asia, and Africa), adjusted for potential confounders such as BMI, smoking etc. Figure 3b shows total sperm count by fertility and the West and Other. You can see that Fertile Other had a sharp increase, but the increase may be due to limited statistical power and a lack of studies of unselected men from those countries before 1985. There is a sharp increase for Other, however and so the data does not support as sharp of a decline as observed in Western countries.
If this is true, why is this happening? Factors that decrease spermatogenesis include (but are not limited to): obesity, smoking, exposure to traffic exhaust fumes, and combustion products. Though there is no data (except animal models) that lend credence to the idea that pesticides, food additives, etc decrease spermatogenesis (Sharpe, 2010). Other factors are known to cause lower SC which includes maternal smoking, alcohol, stress, endocrine disruptors, persistent and nonpersistent chemicals, and, perhaps most importantly today, the use of mobile phones and the wireless Internet (Virtanen, Jorgansen, and Toparri, 2017). Radiation exposure due to constant mobile phone use may cause DNA fragmentation and decreased sperm mobility (Gorpinchenko et al, 2014). Clearly, most of this decrease can largely be ameliorated. Exercise, eating right, and not smoking seem to be the most immediate changes that can and will contribute to an increase in SC in Western men. This will also increase testosterone levels. The cause is largely immobility due to the comfortable lifestyles that we in the West have. So by becoming more active and putting down smartphones, we can then begin to reverse this downward trend.
Saladin (2010: 1067) also states that pollution has deleterious effects on reproduction—and by proxy, sperm production. He states that the evidence is mounting that we are showing declining fertility due to “anatomical abnormalities” in water, meat, vegetables, breast milk and the uterus. He brings up that sperm production decreased in 15,000 men in 1990, decreasing from 113 million/ml in 1940 to 66 million/ml in 1990. Sperm production decreased more, he says, since “the average volume of semen per ejaculate has dropped 19% over this period” (Saladin, 2010: 1067).
Saladin (2010: 1067) further writes:
The pollutants implicated in this trend include a wide array of common herbicides, inseciticides, industrial chemicals, and breakdown products of materials ranging from plastics to dishwashing detergents. Some authorities think these chemicals act by mimicking estrogens by blocking the action of testosterone by binding to its receptors. Other scientists, however, question the data and feel the issue may be overstated. While the debate continues, the U.S. Environmental Protection Agency is screening thousands of industrial chemicals for endocrine effects.
Is it really true?
As seen above, the EPA is investigating whether thousands of industrial chemicals of effects on our endocrine system. If this is true, it occurs due to the binding of these chemicals to androgen receptors, blocking the production of testosterone and thusly sperm production. However, some commentators have contested the results of studies that purport to show a decrease in SC in men over the decades.
Sherins and Delbes are critical of such studies. They rightly state that most of these studies have numerous confounds such as:
1) lack of standardized counting measures, 2) bias introduced by using different counting methodologies, 3) inadequate within-individual semen sampling in the analysis, 4) failure to account for variable abstinence intervals and ejaculatory frequency, 5) failure to assess total sperm output rather than concentration, 6) failure to assess semen parameteres other than the number of sperm, 7) failure to account for age of subject, 8) subject selection bias among comparitive studies, 9) inappropriate statistical analysis, 10) ignoring major geographic differences in sperm counts, and 11) the causal equating of male ferility with sperm count per se.
Levine et al (2017) write:
We controlled for a pre-determined set of potential confounders: fertility group, geographic group, age, abstinence time, whether semen collection and counting methods were reported, number of samples per man and indicators for exclusion criteria (Supplementary Table S1).
So they covered points 1, 2, 4, 5, 6, 7, 8, 9, and 10. This study is very robust. Levine et al (2017) replicate numerous other studies showing that sperm count has decreased in Western men (Centola et al, 2015; Senputa et al, 2017; Virtanen, Jorgensen, and Toparri, 2017). Men Southern Spain show normal levels (Fernandez et al, 2010), while Southern Spanish University students showed a decrease (Mendiola et al, 2013). The same SC decrease has been noted in Brazil in the last ten years (Borges Jr. et al, 2015).
However, te Velde and Bonde (2013) in their paper Misconceptions about falling sperm counts and fertility in Europe contest the results of studies that argue that SC has decreased within the last 50 years stating that, for instance in Denmark, the median values remained between 40-45 million sperm per ml in the 15 years analyzed. They also state that declining birth rates can be explained by cultural and social factors, such as contraception, the female emancipation, and the second demographic transition. Clearly, ferility rates are correlated with the human development index (HDI) meaning that more developed countries have a lower birth rate in comparison to less developed countries. I believe that part of the reason why we in the West have lower birth rates is because there are too many things to for us to do to occupy our time, time that could be used to have children, like going to school to pursue Masters degrees and PhDs, to just wanting more ‘me time’.
Te Velde and Bonde (2013) conclude:
‘Whether the sperm concentration and human fecundity have declined during the past 50 years is a question we will probably never be able to answer’. This statement by Olsen and Rachootin in 200348 still holds for sperm concentration despite the report in 1992. In the meantime, we know that the results of oft-repeated studies from Copenhagen and Malmö do not indicate any notable change in sperm count during the last 10–15 years. Moreover, none of the available evidence points to a decline in couple fecundity during the last 30–40 years, including Denmark.28 Moreover, birth rates and TFRs instead of declining are on the increase in many EU countries, including the spectacular rise in Denmark.34
Echoing the same sentiments, Cocuzza and Esteves (2014) conclude “that there is no enough evidence to confirm a worldwide decline in sperm counts or other semen parameters. Also, there is no scientific truth of a causative role for endocrine disruptors in the temporal decline of sperm production as observed in some studies. We conjecture that a definite conclusion would only be achieved if good quality collaborative long-term research was carried out, including aspects such as semen quality, reproductive hormones, and xenobiotics, as well as a strict definition of fecundity.” Merzenich, Zeeb, and Blettner (2010) also caution that “The observed time trend in semen quality might be an artefact, since the methodological differences between studies might be time dependent as well. Intensive research will be necessary in both clinical and epidemiological domains. More studies are needed with strict methodological standards that investigate semen quality obtained from large samples of healthy men representative for the normal male population.”
Clearly, this debate is long and ongoing, and I doubt that even Levine et al (2017) will be good enough for some researchers.
Conclusion
There are various papers for and against a decrease in sperm production in the West, just like with testosterone. However, there are ways we can deduce that SC has fallen in the West, since we have definitive data that testosterone levels have decreased. This, then, would lead to a decrease in sperm production and then fecundity and number of children conceived by couples. Of course, sociocultural factors are involved, as well as immediate environmental ones that are immediately changeable. Even if there is no scientific consensus on industrial chemicals and effects on the endocrine system, you should stay away from those too. One major reason for the decrease in sperm production—if the decrease is true—is increased mobile phone usage. Mobile phone usage has increased and so this would lower SC over time.
Whether or not the decrease in SC is true or not, every man should take steps to lead a healthier lifestyle without their cell phone. Because if this decrease is true (and Other doesn’t show a decrease as well) then it would be due to the effects of our First World societies, which would mean that we need to change how we live our lives to get back on the right track. Clearly, we must change our diets and our lifestyles. I’ve written numerous articles about how testosterone is strongly mediated by the environment, and that testosterone production in men has decreased since Western men have been, in a way, feminized and not been as dominant. This can and does decrease testosterone production which would, in turn, decrease sperm production and decrease fertility rates.
Nevertheless, taking steps to leading a healthier lifestyle will ameliorate a ton of the problems that we have in the West, which are mainly due to low birth rates, and by ameliorating these problems, the quality of life will the increase in the West. I am skeptical of the decrease due to what was brought up above, but nevertheless I assume that it is true and I hope my readers do too—if only to get some fire under you to lead a healthier lifestyle if you do not do so already as to prevent these problems before they occur and lead to serious deleterious health consequences.
(I am undecided leaning towards yes. There are too many behaviors linked to lower SC which Western men partake in. There are numerous confounds which may have not been controlled for, however knowing the main reasons why men have lower sperm count and the increased prevalence in these behaviors, we can logically deduce that sperm count has fallen too. Look to the testosterone decrease, that causes both low sperm count and lower fertility.)
