
Home » Race Realism (Page 24)
Category Archives: Race Realism
r/K Selection Theory: A Response to Rushton
3300 words
by RaceRealist and Afrosapiens
Introduction
Jean Phillipe Rushton (1943-2012) was a British-born Canadian psychologist known for his theories on genetically determined racial differences in cognition and behavior between Africans, Europeans, and East Asians. While marginal among experts, Rushton’s theories are still widely accepted amongst the proponents of eugenics and racialism. This article will focus on Rushton’s Differential K-theory which tries to apply the r/K selection model to racial differences in behavioral traits. To be fair, Rushton wasn’t the only one to use r/K selection as an explanation for psychological differences within humanity. For instance, some have associated the continuum with left-wing vs. right-wing ideologies. And although ecologists (the specialists of ecosystems) find applying r/K selection to humans inappropriate, the behavioral sciences have identified life-history patterns that roughly correspond to the colloquial fast vs. slow life differences in life history. For that reason, Rushton may have accidentally discussed variables and trends that are largely acknowledged by experts but his theory lies on a misunderstanding of core principles of the r/K model as well as using flawed (or non-existent) data.
Agents of selection
To begin, confusion about the modes of selection in an ecological context needs to be cleared up. There are classes of natural selection in ecological theory to be discussed: r-selection where the agent of selection acts in a density-independent way; K-selection where the agent of selection acts in a density-dependent way; and alpha selection which is selection for competitive ability (territoriality, aggression). Typical agents of K-selection include food shortage, endemic and infectious disease, and predation. Typical agents of r-selection temperature extremes, droughts, and natural disasters. Typical agents of alpha-selection are limited resources that can be collected or guarded, examples being shelter and food (Anderson, 1991).
As you can see, the third mode of selection in ecological theory is alpha-selection—which Rushton failed to bring up as a mode of selection to explain racial differences in behavior. He didn’t explain his reasoning as to why he did not include it—especially since alpha-selection is selection for competitive ability. One may wonder why Rushton never integrated alpha-selection into his theory—either he was ignorant to the reality of alpha-selection or it could occur in numerous ecosystems—whether temperate/cold or tropical. The non-application of alpha-selection throws his theory into disarray and should have one questioning Rushton’s use of ecological theory in application to human races.
The Misuse of r/K Theory
Ecoregions
Rushton’s model starts with the erroneous assumption that the populations he describes as humanities three main races qualify as ecological populations. When studying the adaptive strategies of organisms, ecologists only consider species within their evolutionary niche—that is, the location that the adaptation was hypothesized to have occurred. When it comes to humans, this can only be done by studying populations in their ancestral environments. For this reason, Africans, Europeans, Amerindians—any population that is not currently in their ancestral environments—are not suitable populations to study in an evolutionary ecological context. The three populations no longer inhabit the environment that the selection was hypothesized to have occurred, so any conclusions based on observing modern-day populations must be viewed with extreme caution (Anderson, 1991). Even in the Old World, constant gene flow between ecoregions, as well as alterations of the environment due to agriculture and then industrialization, make such a study virtually impossible as it would require ecologists to study only hunter-gatherers that have received no admixture from other areas.
Rushton’s next misuse of the theory is not discussing density-dependence and density-independence and how they relate to agents of selection and the r/K model. K-selection works in a density-dependent way while r-selection works in a density-independent way. Thusly, K-selection is expected to favor genotypes that persist at high densities (increasing K) whereas r-selection favors genotypes that increase more quickly at low densities (increasing r) (Anderson, 1991). Rushton also failed to speak about alpha-selection. Alpha-selection selection for competitive abilities and, like with K-selection, occurs at high population densities, but could also occur with low population densities. Alpha-selection, instead of favoring genotypes that increase at high densities “it favours genotypes that, owing to their negative effects on others, often reduce the growth rate and the maximum population size” (Anderson, 1991: 52).
The r/K continuum
The r/K continuum—proposed by Pianka (1970)—has been misused over the decades (Boyce, 1984) and that is where Rushton got the continuum and applied it to human racial differences. Different agents of r-selection produce different selection pressures, as does K-selection. However, where Rushton—and most who cite him—go wrong is completely disregarding the agents of selection, along with perhaps the most critical part, reversing r and K in application to human races (if it were applicable to human races, that is), which will be covered below.
Dobzhansky (1950: 221) notes that “Tropical environments provide more evolutionary challenges than do the environments of temperate and cold lands.” It is erroneously assumed that living in colder temperatures is somehow ‘harder’ than it is in Africa. People believe that since food is ‘readily available’, that it must be ‘harder’ to find food in the temperate/Arctic environments so, therefore, selection for high intelligence occurred in Eurasians while Africans have lower intelligence since it’s so ‘easy’ to live in Africa, as well as other tropical environments.
Africans, furthermore, have been in roughly the same environment since the OoA migration occurred (the Ice Age ‘ended’ about 11,700 ya, although we are still in an Ice Age since the planets caps still have ice), and so any assumptions about it being ‘harder’ for the ancestors of Eurasians to survive and pass on their genes is a baseless assumption. Tropical environments that provide more evolutionary challenges than temperate and cold lands whereas the migration that occurred Out of Africa introduced humans to novel environments. As described above, endemic disease is an agent of K-selection whereas migration to novel environments are agents of r-selection. Thus, cold temperatures would be an agent of r-selection, not K-selection as is commonly believed, whereas endemic disease would be an agent of K-selection.
Even though intelligence nor rule-following were not included on the list of variables that Pianka (1970) noted on his r/K continuum, Rushton chose to include the variables anyway, even though selection for intelligence and rule-following can occur due to agents of r- or K-selection (Anderson, 1991: 55; Graves, 2002: 134-144). Pianka (1970) never gave experimental rationalization as to why he placed the traits he did on his continuum (Graves, 2002: 135). This is one critical point that makes his theory unacceptable in application to racial differences in behavior. By Rushton’s own interpretation of the r/K model, Africans would be selected for intelligence while Eurasians would be selected to breed more since novel environments (i.e., colder temperatures) are agents of r-selection, not K. Using the terms r- and K-selection to describe the traits of an organism is inappropriate; Rushton’s application of r/K theory to the traits of the three races, while ignoring that r/K describes a mode of natural selection “indicates circular reasoning rather than support for Rushton’s hypothesis” (Anderson, 1991: 59).
Reznick et al, (2002: 1518) write: “The distinguishing feature of the r- and K-selection paradigm was the focus on density-dependent selection as the important agent of selection on organisms’ life histories. This paradigm was challenged as it became clear that other factors, such as age-specific mortality, could provide a more mechanistic causative link between an environment and an optimal life history (Wilbur et al. 1974, Stearns 1976, 1977). The r- and K-selection paradigm was replaced by new paradigm that focused on age-specific mortality (Stearns 1976, Charlesworth 1980).” r/K selection theory was dropped for the much stronger life-history approach (Graves, 2002)—which uses some elements of r and K, but otherwise those terms are no longer used since other factors are more important as agents of selection, rather than density dependence and independence as was commonly thought.
Simple models?
One of the main reasons that Rushton’s r/K continuum gets pushed is because it’s a ‘simple model’ that so ‘parsimoniously’ explains racial differences. (e.g., cold winters supposedly take more intelligence to survive in and supposedly are an agent of K-selection.) But ecological systems are never simple; there are numerous interactions between the physical environment and the biological system which interact in complex ways.
Rushton’s use of this ‘simple model’—the r/K continuum—and its application to human races are wrong because 1) the three races described are not local populations; 2) the r/K continuum as described by Pianka (1970) is a poor representation of multidimensional ecological processes; and 3) cold weather is normally an agent of r-selection while endemic disease in Africa—as described by Rushton—is an agent of K-selection. Simple models are not always best—especially for organisms as complex as humans—so attempting to reduce complex biological and environmental interactions into a linear continuum is mistaken (Boyce, 1984). The simpler the ecological model, the more complex ecological sophistication is needed to understand and apply said model. So, although Rushton prefers simple models, in this context it is not apt, as complex biological systems interacting with their environments should not be reduced to a ‘simple model’.
Applying r/K to human races
If the r/K model were applicable to humans, then Caucasoids and Mongoloids would be r-selected while Negroids would be K-selected. Endemic and infectious disease—stated by Rushton to be an r-selected pressure—is actually a K-selected pressure. So Negroids would have been subjected to K-selected pressures (disease) and r-selected pressures (drought). Conversely, for Mongoloids, they migrated into colder temperatures which act in a density-independent way—hence, cold winters (temperature extremes) are an agent of r-selection.
Pianka’s (1970) r/K continuum “confuses the underlying pattern of life history variation with density-dependence, a process potentially involved to explain the pattern” (Gaillard et al, 2016). Furthermore, one cannot make assumptions about an organism’s traits and the selection pressures that caused them without studying said organism in their natural habitat. This seems to be impossible since one would need to study non-admixed hunter-gatherer populations that have received no outside contact.
Gonadotropin levels, testosterone, prostate cancer and r/K theory
Numerous attempts have been made to validate Rushton’s r/K theory. One notable paper by Lynn (1990) attempts to integrate gonadotropin levels and testosterone into Rushton’s r/K continuum. Lynn cites studies showing that blacks have higher testosterone than whites who have higher testosterone than Asians. He then implicates higher levels of both testosterone and gonadotropin levels as the cause for the higher incidence of prostate cancer (PCa) in black Americans.
Lynn (1990) asserts that by having fewer children and showing more care, this is shifting to a K strategy. So, according to Lynn, the best way to achieve this would be a reduction in testosterone. However, there is a fault in his argument.
The study he uses for his assertion is Ross et al (1986). He states that the two groups were both “matched for possible environmental factors which might affect testosterone levels” (Lynn, 1990: 1204). However, this is an erroneous assumption. Ross et al (1986) did control for relevant variables, but made two huge errors. They did not control for waist circumference (WC), and, perhaps most importantly, did not assay the subjects in the morning as close to 8 am as possible.
Testosterone levels are highest at 8 am and lowest at 8 pm. When doing a study like this—especially one to identify a cause of a disease with a high mortality rate—all possible confounds must be identified then controlled for—especially confounds that fluctuate with age. The cohort was assayed between the hours of 10 am and 3 pm. Since testosterone assay time was all over the place for both groups, you cannot draw evolutionary hypotheses from the results. Further, the cohort was a sample of 50 black and white college students—a small sample and a non-representative population. So it’s safe to disregard this hypothesis, on the knowledge that blacks don’t have significantly higher testosterone levels than whites.
Another correlate that is used to show that blacks have higher levels of testosterone is the higher rate of crime they commit. However, physical aggression has a low correlation with testosterone (Archer, 1991; Book et al, 2001) and thusly cannot be the cause of crime. Furthermore, the .14 correlation that Book et al, 2001 found was found to be high. Archer, Graham-Kevan, and Lowe (2005) show that even the .14 correlation between testosterone and aggression is high in a reanalysis of Book et al (2001) since they included 15 studies that should have been omitted. The correlation was then reduced by almost half to .08.
Other theories have been developed to attempt to explain the racial crime gap which centers around testosterone (Ellis, 2017), however, the theory has large flaws which the author rightly notes. Exposure to high levels of testosterone in vitro supposedly causes a low 2d/4d ratio and blacks apparently have the lowest (Manning, 2008). Though, larger analyses show that Asians—mainly the Chinese—have a lower digit ratio compared to other ethnicities (Lippa, 2003; Manning et al, 2007).
Testosterone also does not cause PCa (Stattin et al, 2003; Michaud, Billups, and Partin, 2015). The more likely culprit is diet. Less exposure to sunlight along with low vitamin D intake (Harris, 2006; Rostand, 2010) is a large cause for the prostate cancer discrepancy between the races since low vitamin D is linked to aggressive prostate cancer.
Even then, if there were, say, a 19 percent difference in testosterone between white and black Americans as asserted by Rushton and Lynn, it wouldn’t account for the higher rates of crime, nor higher acquisition and mortality from PCa. If their three claims are false (higher levels testosterone in African-Americans, larger penis size, and high levels of testosterone causing PCa), and they are, then this obliterates Rushton’s and Lynn’s theory.
Differential K Theory has, as noted above, has also been associated with a larger penis for black males in comparison to white males who have larger penises than Asian males (Lynn, 2012), which is not true, there is no reliable data and the data that does exist points to no evidence for the assertion. Lynn, (2012) also used data from a website with unverified and nonexistent sources. In a 2015 presentation, Edward Dutton cites studies showing that, again, Negroids have higher levels of testosterone than Caucasoids who have higher levels of testosterone than Mongoloids. Nevertheless, the claims by Dutton have been rebutted by Scott McGreal who showed that population differences in androgen levels don’t mean anything and that they fail to validate the claims of Lynn and Rushton on racial differences in penis size.
r/K selection theory as an attempt at reviving the scala naturae
Finally, to get to the heart of the matter, Rushton’s erroneous attempt to apply r/K selection theory to the human races is an attempt at reviving the scala naturae concept proposed by Aristotle (Hodos, 2009). The scala naturae organizes living and non-living organisms on a scale from ‘highest’ to ‘lowest’. However, these assumptions are erroneous and have no place in evolutionary biology (Gould, 1996). Rushton (1997: 293) attempted to apply r/K selection theory to human populations to try to revive the concept of the scala naturae, as can be clear by reading the very end of Race, Evolution, and Behavior.
This, of course, goes back to Rushton’s erroneous application of r/K selection theory to human races. He (and others) wrongly assert that Mongoloids are more K-selected than Africans who are more r-selected while Caucasians are in the middle—it also being asserted that K organisms, supposedly Mongoloids, “are the most K evolved” (Lynn, 2012). However, if r/K selection theory were applicable to humans, Mongoloids would be r and Africans would be K. Rushton further attempts to provide evidence for this ‘evolutionary progress’ by citing Dale Russel (1983; 1989) and his thought experiment troodon that he imagines would have eventually have gained human-like bipedalism and a large brain. Nevertheless, Rushton himself doesn’t say that it was only one dinosaur that would have supposedly had human-like intelligence and mobility, Reptile brains, however, lie outside of mammalian design (Hopson, 1977: 443; Gould, 1989: 318), and so, Russel’s theory is falsified.
This use of r/K selection theory as an attempt at bringing back the scala naturae may seem like an intuitive concept; some races/animals may seem more ‘advanced’ or ‘complex’ than others. However, since Rushton’s application of r/K selection theory is not correctly applied (nor does it apply to humans) and any of the claims that Rushton—or anyone else—makes while invoking the theory can be disregarded since he misused r and K selection.
In an attempt to “[restore] the concept of “progress” to its proper place in evolutionary biology,” Rushton (2004) proposed that g—the general factor of intelligence—sits atop a matrix of correlated traits that he proposes to show why evolution is synonymous with ‘progress’, including how and why K evolved organisms are so-called ‘more highly K evolved’—which is a sly attempt to revive the concept of scala naturae. Rushton’s (2004) paper is largely copy and pasted from his 1997 afterword in Race, Evolution, and Behavior—especially the part about ‘progress in evolution’ (which has been addressed in depth).
As can be seen, Ruston attempted to revive the scala naturae by giving it a new name, along with the misuse of ecological theory to make it seem like evolution is synonymous with progress and that K organisms are ‘more evolved’, makes no sense in the context of how ecological theory is (or was) applied to organisms. Rushton’s theory is correct, if and only if he applied r and K correctly to human races. Rushton did not apply r/K selection theory correctly to human races, so Rushton’s claims and any that follow from them are, on their face, immediately wrong. The claims by Rushton et al showing evolution to be ‘progressive’ have been shown to be demonstrably false since evolution is local change, not ‘progress’ (Gould, 1989; 1996).
Conclusion
Rushton’s r/K selection theory has enamored many since he proposed it in 1985. He was relentlessly attacked in the media for his proposals about black penis size, testosterone, brain size, sexual frequency, etc. However, the explanation for said racial differences in behavior—his r/K selection theory—has been summarily rebutted for misapplying ecological theory and not understanding evolution (Anderson, 1991; Graves, 2002). Even ignoring his racial comparisons, his application of the theory would still be unacceptable as he didn’t recognize agents of selection nor alpha selection.
Rushton is wrong because
(i) he misapplied r/K selection in application to human races (Africans would be K, Mongoloids would be r; rule-following and intelligence can be selected for in either environment/with any of the agents of r- or K-selection),
(ii) he arbitrarily designated Africans as r and Mongoloids as K due to current demographic trends (the true application of r and K is described above, which Rushton showed no understanding of),
(iii) the races do not differ in levels of testosterone nor penis size,
(iv) testosterone does not cause prostate cancer nor does it cause crime, so even if there was a large difference between blacks and whites, it would not explain higher rates of PCa in blacks, nor would it explain higher rates of crime,
(v) the scala naturae is a long-dead concept no longer in use by evolutionary biologists, along with its cousin ‘evolutionary progress’, while r/K selection is the attempt at reviving both,
(vi) human races are not local populations; since human races are not local populations then his application of r/K selection to humans is erroneous.
Rushton was informed numerous times he wrongly applied ecological theory to human populations. Yes, E.O. Wilson did say that if Rushton had noticed variation in any other animal that ‘no one would have batted an eye’, however, that does not say a word about Rushton’s incorrect application of r/K selection to human races. No race of humans is more ‘highly evolved’ than another.
Anyone who uses Rushton’s theory as an explanation for observed data is using incorrect/misapplied theory meaning that, therefore, by proxy, their theory is wrong. Rushton’s r/K theory is wrong, and people need to stop invoking it as an explanation for racial differences in behavior, politics, religion, and any other variable they can think of. If Rushton’s application of the theory is wrong, then it logically follows that anything based off of his theory is wrong as well.
The ENA Theory: On Testosterone and Aggressive Behavior by Race/Ethnicity
3250 words
A commenter by the name of bbloggz alerted me to a new paper by Lee Ellis published this year titled Race/ethnicity and criminal behavior: Neurohormonal influences in which Ellis (2017) proposed his theory of ENA (evolutionary neuroandrogenic theory) and applied it to racial/ethnic differences in crime. On the face, his theory is solid and it has great explanatory power for the differences in crime rates between men and women, however, there are numerous holes in the application of the theory in regards to racial/ethnic differences in crime.
In part I, he talks about racial differences in crime. No one denies that, so on to part II.
In part II he talks about environmental causes for the racial discrepancies, that include economic racial disparities, racism and societal discrimination and subordination, a subculture of violence (I’ve been entertaining the honor culture hypothesis for a few months; Mazur (2016) drives a hard argument showing that similarly aged blacks with some college had lower levels of testosterone than blacks with less than high school education which fits the hypothesis of honor culture. Though Ellis’ ENA theory may account for this, I will address this below). However, if the environment that increases testosterone is ameliorated (i.e., honor culture environments), then there should be a subsequent decrease in testosterone and crime, although I do believe that testosterone has an extremely weak association with crime, nowhere near high enough to account for racial differences in crime, the culture of honor could explain a good amount of the crime gap between blacks and whites.
Ellis also speaks about the general stress/strain explanation, stating that blacks have higher rates of self-esteem and Asians the lowest, with that mirroring their crime rates. This could be seen as yet another case for the culture of honor in that blacks with a high self-esteem would feel the need to protect their ‘name’ or whatever the case may be and feel the need for physical altercation based on their culture.
In part III, Ellis then describes his ENA theory, which I don’t disagree with on its face as it’s a great theory with good explanatory power but there are some pretty large holes that he rightly addresses. He states that, as I have argued in the past, females selected men for higher rates of testosterone and that high rates of testosterone masculinize the brain, changing it from its ‘default feminine state’ and that the more androgens the brain is exposed to, the more likely it is for that individual to commit crime.
Strength
Ellis cites a study by Goodpaster et al (2006) in which he measured the races on the isokinetic dynamometry, pretty much a leg extension. However, one huge confound is that participants who did not return for follow-up were more likely to be black, obese and had more chronic disease (something that I have noted before in an article on racial grip strength). I really hate these study designs, but alas, it’s the best we have to go off of and there are a lot of holes in them that must be addressed. Though I applaud the researchers’ use of the DXA scan (regular readers may recall my criticisms on using calipers to assess body fat in the bench press study, which was highly flawed itself; Boyce et al, 2014) to assess body fat as it is the gold standard in the field.
Ellis (2017: 40) writes: “as brain exposure to testosterone surges at puberty, the prenatally-programmed motivation to strive for resources, status, and mating opportunities will begin to fully activate.” This is true on the face, however as I have noted the correlation between physical aggression and testosterone although positive is low at .14 (Archer, 1991; Book et al, 2001). Testosterone, as I have extensively documented, does cause social dominance and confidence which do not lead to aggression. However, when other factors are coupled with high testosterone (as noted by Mazur, 2016), high rates of crime may occur and this may explain why blacks commit crime; a mix of low IQ, high testosterone and low educational achievement making a life of crime ‘the smart way’ to live seeing as, as Ellis points out, and that intelligent individuals find legal ways to get resources while less intelligent individuals use illegal ways.
ENA theory may explain racial differences in crime
In part IV he attempts to show how his ENA theory may explain racial differences in crime—with testosterone sitting at the top of his pyramid. However, there are numerous erroneous assumptions and he does rightly point out that more research needs to be done on most of these variables and does not draw any conclusions that are not warranted based on the data he does cite. He cites one study in which testosterone levels were measured in the amniotic fluid of the fetus. The sample was 59 percent white and due to this, the researchers lumped blacks, ‘Hispanics’ and Native Americans together which showed no significant difference in prenatal testosterone levels (Martel and Roberts, 2014).
Umbilical cord and testosterone exposure
Ellis then talks about testosterone in the umbilical cord, and if the babe is exposed to higher levels of testosterone in vitro, then this should account for racial/ethnic differences in crime. However, the study he cited (Argus-Collins et al, 2012) showed no difference in testosterone in the umbilical cord while Rohrmann et al (2009) found no difference in testosterone between blacks and whites but found higher rates of SHBG (sex hormone-binding globulin) which binds to testosterone and makes it unable to leave the blood which largely makes testosterone unable to affect organ development. Thusly, if the finding of higher levels of SHBG in black babes is true, then they would be exposed to less androgenic hormones such as testosterone which, again, goes against the ENA theory.
He also cites two more studies showing that Asian babes have higher levels of umbilical cord testosterone than whites (Chinese babes were tested) (Lagiou et al, 2011; Troisi et al, 2008). This, again, goes against his theory as he rightly noted.
Circulating testosterone
Next he talks about circulating differences in testosterone between blacks and whites. He rightly notes that testosterone must be assayed in the morning within an hour after waking as that’s when levels will be highest, yet cites Ross et al (1986) where assay times were all over the place and thusly testosterone cannot be said to be higher in blacks and whites based on that study and should be discarded when talking about racial differences in testosterone due to assay time being between 10 am and 3 pm. He also cites his study on testosterone differences (Eliss and Nyborg, 1993), but, however, just as Ross et al (1986) did not have a control for WC (waist circumference) Ellis and Nyborg (1993) did not either, so just like the other study that gets cited to show that there is a racial difference in testosterone, they are pretty hugely flawed and should not be used in discussion when discussing racial differences in testosterone. Why do I not see these types of critiques for Ross et al (1986) in major papers? It troubles me…
He also seems to complain that Lopez et al (2013) controlled for physical activity (which increases testosterone) and percent body fat (which, at high levels, decreases testosterone). These variables, as I have noted, need to be controlled for. Testosterone varies and fluctuated by age; WC and BMI vary and fluctuate by age. So how does it make sense to control for one variable that has hormone levels fluctuate by age and not another? Ellis also cites studies showing that older East Asian men had higher levels of testosterone (Wu et al, 1995). Nevertheless, there is no consensus; some studies show Chinese babes have higher levels of testosterone than whites and some studies show that whites babes have higher levels of testosterone than Chinese babes. Indeed, this meta-analysis by Ethnicmuse shows that Asians have the highest levels, followed by Africans then Europeans, so this needs to be explained to save the theory that testosterone is the cause of black overrepresentation of violence (as well as what I showed that testosterone is important for vital functioning and is not the boogeyman the media makes it out to be).
Bone density and crime
Nevertheless, the next variable Ellis talks about is bone density and its relationship to crime. Some studies find that blacks are taller than whites while other show no difference. Whites are also substantially taller than Asian males. Blacks have greater bone density than the other three races, but according to Ellis, this measure has not been shown to have a relationship to crime as of yet.
Penis size, race and crime
Now on to penis size. In two articles, I have shown that there is no evidence for the assertion that blacks have larger penises than whites. However, states that penis length was associated with higher levels of testosterone in Egyptian babes. He states that self-reported penis size correlates with self-reports of violent delinquency (Ellis and Das, 2012). Ellis’ main citations for the claim that blacks have larger penises than other races comes from Nobile (1982), the Kinsey report, and Rushton and Boagert (1987) (see here for a critique of Rushton and Boagert, 1987), though he does cite a study stating that blacks had a longer penis than whites (blacks averaging 5.77 inches while whites averaged 5.53 inches). An HBDer may go “Ahah! Evidence for Rushton’s theory!”, yet they should note that the difference is not statistically significant; just because there is a small difference in one study also doesn’t mean anything for the totality of evidence on penis size and race—that there is no statistical difference!
He then cites Lynn’s (2013) paper which was based on an Internet survey and thus, self-reports are over-measured. He also cites Templer’s (2002) book Is Size Important?, which, of course, is on my list of books to read. Nevertheless, the ‘evidence’ that blacks average larger penises than whites is extremely dubious, it’s pretty conclusive that the races don’t differ in penis size. For further reading, read The Pseudoscience of Race Differences in Penis Size, and read all of Ethnicmuses’ posts on penis size here. It’s conclusive that there is no statistical difference—if that—and any studies showing a difference are horribly flawed.
2d/4d ratio and race
Then he talks about 2d/4d ratio, which supposedly signifies higher levels of androgen exposure in vitro (Manning et al, 2008) however these results have been challenged and have not been replicated (Koehler, Simmons, and Rhodes, 2004; Yan et al, 2008, Medland et al, 2010). Even then, Ellis states that in a large analysis of 250,000 respondents, Asians had the lowest 2d/4d ratio, which if the hypothesis of in vitro hormones affecting digit length is to be believed, they have higher levels of testosterone than whites (the other samples had small ns, around 100).
Prostate-specific antigens, race, and prostate cancer
He then talks about PSA (prostate-specific antigen) rates between the races. Blacks are two times more likely to get prostate cancer, which has been blamed on testosterone. However, I’ve compiled good evidence that the difference comes down to the environment, i.e., diet. Even then, there is no evidence that testosterone causes prostate cancer as seen in two large meta-analyses (Stattin et al, 2003; Michaud, Billups, and Partin, 2015). Even then, rates of PCa (prostate cancer) are on the rise in East Asia (Kimura, 2012; Chen et al, 2015; Zhu et al, 2015) which is due to the introduction of our Western diet. I will cover the increases in PCa rates in East Asia in a future article.
CAG repeats
He then reviews the evidence of CAG repeats. There is, however, no evidence that the number of CAG repeats influences sensitivity to testosterone. However, intra-racially, lower amounts of CAG repeats are associated with higher spermatozoa counts—but blacks don’t have higher levels of spermatozoa (Mendiola et al, 2011; Redmon et al, 2013). Blacks do have shorter CAG repeats, and this is consistent with the racial crime gap of blacks > whites > Asians. However, looking at the whole of the evidence, there is no good reason to assume that this has an effect on racial crime rates.
Intelligence and education
Next he talks about racial differences in intelligence and education, which have been well-established. Blacks did have higher rates of learning disabilities than whites who had higher levels of learning disabilities then Asians in a few studies, but other studies show whites and South Asians having different rates, for instance. He then talks about brain size and criminality, stating that the head size of males convicted for violent crimes did not differ from males who committed non-violent crimes (Ikaheimo et al, 2007). I won’t bore anyone with talking about what we know already: that the races differ in average brain size. However, a link between brain size and criminality—to the best of my knowledge—has yet to been discovered. IQ is implicated in crime, so I do assume that brain size is as well (no matter if the correlation is .24 or not; Pietschnig et al, 2015).
Prenatal androgen exposure
Now to wrap things up, the races don’t differ in prenatal androgen exposure, which is critical to the ENA theory; there is a small difference in the umbilical cord favoring blacks, and apparently, that predicts a high rate of crime. However, as noted, blacks have higher levels of SHBG at birth which inhibits the production of testosterone on the organs. Differences in post-pubertal testosterone are small/nonexistent and one should not talk about them when talking about differences in crime or disease acquisition such as PCa. DHT only shows a weak positive correlation with aggression—the same as testosterone (Christiansen and Winkler, 1992; however other studies show that DHT is negatively correlated with measures of physical aggression; Christiansen and Krussmann, 1987; further, DHT is not so evil after all).
Summing it all up
Blacks are not stronger than whites, indeed evidence from the races’ differing somatype, grip strength and leverages all have to do with muscular strength. Furthermore, the study that Ellis cites as ‘proof’ that blacks are stronger than whites is on one measure; an isokinetic dynamometry machine which is pretty much a leg extension. In true tests of strength, whites blow blacks away, which is seen in all major professional competitions all around the world. Blacks do have denser bones which is due to androgen production in vitro, but as of yet, there has been no research done into bone density and criminality.
The races don’t differ on penis size—and if they do it’s by tenths of an inch which is not statisitcally significant and I won’t waste my time addressing it. It seems that most HBDers will see a racial difference of .01 and say “SEE! Rushton’s Rule!” even when it’s just that, a small non-significant difference in said variable. That’s something I’ve encountered a lot in the past and it’s, frankly, a waste of time to converse about things that are not statistically significant. I’ve also rebutted the theory on 2d/4d ration as well. Finally, Asians had a similar level of androgen levels compared to blacks, with whites having the least amount. Along with a hole in the theory for racial differences in androgen causing crime, it’s yet another hole in the theory for racial differences in androgens causing racial differences in penis size and prostate cancer.
On intelligence scores, no one denies that blacks have scored about 1 SD lower than whites for 100 years, no one denies that blacks have a lower educational attainment. In regards to learning disabilities, blacks seem to have the highest rates, followed by Native Americans, than non-Hispanic whites, East Asians and the lowest rates found in South Asians. He states only one study links brain size to criminal behavior and it showed a significant inverse relationship with crime but not other types of offenses.
This is a really good article and I like the theory, but it’s full of huge holes. Most of the variables described by Ellis have been shown to not vary at all or much between the races (re: penis size, testosterone, strength [whites are stronger] prostate cancer caused mainly by diet, 2d/4d ratio [no evidence of it showing a digit ratio difference], and bone density not being studied). Nevertheless, a few of his statements do await testing so I await future studies on the matter. He says that androgen exposure ‘differs by race and ethnicity’, yet the totality of evidence shows ‘not really’ so that cannot be the cause of higher amounts of crime. Ellis talks about a lot of correlates with testosterone, but they do not pass the smell test. Most of it has been rebutted. In fact, one of the central tenets of the ENA theory is that the races should differ in 2d/4d ratio due to exposure of differing levels of the hormone in vitro. Alas, the evidence to date has not shown this—it has in fact shown the opposite.
ENA theory is good in thought, but it really leaves a lot to be desired in regards to explaining racial differences in crime. More research needs to be looked into in regards to intelligence and education and its effect on crime. We can say that low IQ people are more likely to drop out of school and that is why education is related to crime. However, in Mazur (2016) shows that blacks matched for age had lower levels of testosterone if they had some college under their belt. This seems to point in the direction of the ENA theory, however then all of the above problems with the theory still need to be explained away—and they can’t! Furthermore, one of the nails in the coffin should be this: East Asian males are found to have higher levels of testosterone than white males, often enough, and East Asian males actually have the lowest rate of crime in the worle!
This seems to point in the direction of the ENA theory, however then all of the above problems with the theory still need to be explained away—and they can’t! Furthermore, one of the nails in the coffin should be this: East Asian males are found to have higher levels of testosterone than white males, often enough, and East Asian males actually have some of the lowest rate of crime in the world (Rushton, 1995)! So this is something that needs to be explained if it is to be shown that testosterone facilitates aggression and therefore, crime.
Conclusion
I’ve shown—extensively—that there is a low positive correlation between testosterone and physical aggression, why testosterone does not cause crime, and have definitively shown that, by showing how flawed the other studies are that purport to show blacks have higher testosterone levels than whites, along with citing large-scale meta-analyses, that whites and blacks either do not differ or the differences is small to explain any so-called differences in disease acquisition or crime. One final statement on the CAG repeats, they are effect by obesity, men who had shorter CAG repeats were more likely to be overweight, which would skew readings (Gustafsen, Wen, and Koppanati, 2003). So depending on the study—and in most of the studies I cite whites have a higher BMI than blacks—BMI and WC should be controlled for due to the depression of testosterone.
It’s pretty conclusive that testosterone itself does not cause crime. Most of the examples cited by Ellis have been definitively refuted, and his other claims lack evidence at the moment. Even then, his theory rests on the 2d/4d ratio and how blacks may have a lower 2d/4d ratio than whites. However, I’ve shown that there is no significant relationship between 2d/4d ratio and traits mediated by testosterone (Kohler, Simmons, and Rhodes, 2004) so that should be enough to put the theory to bed for good.
Why Testosterone Does Not Cause Crime
1900 words
Edit: (The correlation between aggression and testosterone isn’t .14 as Book et al (2001) state; the true correlation is .08 (Archer, Graham-Kevan and Davies, 2005) So it’s even lower than I thought. This is one of the many reasons why testosterone does not cause crime. It’s just feminist bullshit and fear mongering from people who do not understand the hormone and what it does in the body. The misconceptions come from Rushton’s r/K selection bullshit which has been summarily refuted.)
Recently, I’ve written at length on racial differences in testosterone and how the correlation between testosterone and physical aggression is .14. Pitifully low to account for the cause of crime and any overall differences in racial crime (that will be touched on at length in the future). Tonight I will show, yet again, why testosterone does not cause crime by looking at what times most crimes are committed by both adults and children under the age of 18. This will definitively put the ‘testosterone causes crime’ myth to bed for good.
Before I get into the time of day that most crimes are committed, I must talk about the production of testosterone in the body. There are no ‘genes for’ testosterone (although men who had three certain alleles had a 6.5 fold higher risk of having low testosterone; Ohlsson et al, 2011, I am unaware of there being a variation by race; over 10,000 Caucasian men were studied). There is, however, an indirect control of testosterone synthesis by DNA. DNA regulates the production of testosterone by coding for enzymes that convert cholesterol to testosterone (testosterone is a cholesterol-based hormone).
There are five simple steps to the production of testosterone: 1) DNA codes for mRNA; 2) mRNA codes for the synthesis of an enzyme in the cytoplasm; 3) luteinizing hormone stimulates the production of another messenger in the cell when testosterone is needed; 4) this second messenger activates the enzyme; 5) the enzyme then converts cholesterol to testosterone (Leydig cells produce testosterone in the presence of luteinizing hormone). That’s how testosterone is produced in the body. It is indirectly controlled by DNA.

Above is a graph from the Office of Juvenile Justice and Delinquency Prevention which shows the time of day that most crimes are committed. Notice how crime goes up as the time of day goes on and since kids are at school, they’re more likely to fight. This then peaks at 3 pm when kids are getting out of school.
Now look at rates of crime for adults. At its peak of 10 pm, it’s vastly lower than that of people under the age of 18, which is important to keep in mind. You can see how at 8 am that rates of crime are low for adults and high for kids, right when they would be entering school so there would be a lot of other kids around and the chance for violence goes up. Keep the times of 8 am (kids when they enter school), 12 pm (when most kids go on lunch) and 3 pm (when most kids get out of school) along with the hours of 12 pm to 8 pm for adults (when 74 percent of crimes are committed by adults).
- In general, the number of violent crimes committed by adults increases hourly from 6 a.m. through the afternoon and evening hours, peaks at 10 p.m., and then drops to a low point at 6 a.m. In contrast, violent crimes by juveniles peak in the afternoon between 3 p.m. and 4 p.m., the hour at the end of the school day.
- Nearly one-third (29%) of all violent crime committed by juvenile offenders occurs between 3 p.m. and 7 p.m. In comparison, 26% of all violent committed by adult offenders occurs between 8 p.m. and 12 p.m.
So since testosterone varies by day and levels are highest at 8 am and lowest at 8 pm (Brambilla et al, 2009; however testing men aged 45 years of age and older is fine before 2 pm due to a blunted circadian rhythm; Long, Nguyen, and Stevermer, 2015), then how could testosterone account for why men commit most of their crimes at night and why the crime that children commit spikes when they go to school, go to lunch and get out of school? The answer is that it doesn’t because testosterone does not cause crime. What testosterone does cause, however, are feelings of confidence and dominance, which does not—surprisingly—lead to increased aggression and assault on others (Booth et al, 2006).
What testosterone does cause, however, is social dominance and success, not physical aggression and maladjustment (Shcaal et al, 1996). The effects of environment are also more notable on testosterone than are genetics at 5 months of age (Carmaschi et al, 2010). Furthermore, aggressive behavior is first noticed in infancy and reaches its peak before school age (Tremblay et al, 2004; Cote et al, 2006). Though testosterone does seem to have an effect on aggression in preschool boys, however genetic and environmental causality has not been established (Sanchez-Martin et al, 2000).
Nevertheless, the meta-analyses I cited last week show that testosterone has an extremely low correlation of .14, so other factors must be at play. However, Sanchez-Martin et al (2000:778-779) also note that “Tremblay et al (1998) suggested that associations between testosterone titer and physical aggression are likely to be observed in contexts where such attack leads to social dominance. This may be true of the preschool boys in the present study. The data generated in the present study generally support Scerbo and Kolko (1994), who studied older children (7 to 14 years of age). They found a significant relationship between testosterone levels and aggression (as assessed by clinical staff).”
It’s interesting to note that in the case of Scerbo and Kolko (1994) that after controlling for age and size, testosterone correlated with aggression when rated by staff but not parents or teachers. ‘Staff’ refers to clinic staff at a facility where the children were assessed for hyperactivity disorders. Of course, the staff would rate higher levels of aggression compared to parents of teachers—people who are around the children every day—since they would want a higher chance for diagnosis for certain drugs to ‘cure’ the hyperactivity, but I digress. Testosterone does not induce aggression in children, but it does induce social dominance and confidence which does not lead to aggression (Rowe et al, 2004; Booth et al, 2006).
There was also little difference in testosterone between socially dominant prisoners and aggressive prisoners (Ehrenkraz, Bliss, and Sheard, 1974). Furthermore, the testosterone increase leading to pubertal development in boys is not associated with increased aggression (Tremblay et al, 1998; Booth et al, 2006: 171). Indeed, increased body size is a marker for physical aggression in children, and I doubt these children have high muscle mass so, I assume, they have high levels of body fat and thusly lower levels of testosterone than they would have if they were leaner. Yet another strike against the ‘testosterone causes crime/physical aggression’ hypothesis.
Indeed, this has some implications for the honor culture hypothesis of why low-income blacks have higher levels of testosterone than similarly aged blacks with some college (Mazur, 2016). The patterns for crime as shown by the OOJDP shows that crime rises as the day progresses from the morning until its peak at 3 pm for children and then sharply declines while for adults it peaks at 10 pm.
Testosterone does increase when a challenge is issued; when one man feels his reputation is threatened, the propensity for violence is increased, but this was most notably seen in Southern men (Cohen et al, 1996). So the same would be said for this ‘culture of honor’ found in low-income black neighborhoods, the so-called ‘code of the street’ as stated by Anderson (1994: 88): “Moreover, if a person is assaulted, it is important, not only in the eyes of his opponent but in the eyes of his “running buddies,” for him to avenge himself. Otherwise, he risks being “tried” (challenged) or “moved on” by any number of others. To maintain his honor, he must show he is not someone to be “messed with” or “dissed.””
This culture of honor is found all over the world, including Brazil where homicide can be explained by the need to maintain honor and can be understood by taking into account cultural factors; biological, psychological and socioeconomic factors do not explain murder in Northeast Brazil as well as honor and culture (de Souza et al, 2015). People in honor cultures also have a higher chance of self-harm (Osterman and Brown, 2011) as well as a higher chance of committing violence in school (Brown, Osterman, and Barnes, 2009).
Testosterone does not cause crime; it does not cause aggression. Increases in testosterone before, during and after events are a physiologic process to prime the body for competition. As cited above, dominant behavior does not necessarily lead to violence in most cases, which may be surprising for some. Indeed, honor and culture may explain a nice amount of the homicide and violence rate in the South. Since testosterone is highest at 8 am and lowest at 8 pm and the rates of crime committed by adults and children are vastly different than the diurnal variance in the day, then testosterone does not cause crime and its increase is not associated with crime, but social dominance and confidence which does not lead to crime.
Hopefully—if anyone still believes testosterone to be the boogeyman its made out to be—I’ve put those misconceptions to rest. Racial differences in testosterone cannot be the cause of racial differences in crime—because there is either no statistical difference in testosterone between the races or the difference is non-existent. Testosterone is clearly a beneficial hormone—as I have extensively documented. Misunderstandings of the hormone are abound—especially in the HBD sphere—only due to literally a few paragraphs in a book (Rushton, 1997) and one study that showed blacks have higher testosterone than whites which was the cause of their higher rates of prostate cancer (Ross et al, 1986). The study is hard to find so I had to buy access to it. I will cover this in the future, but I discovered that they assayed the subjects when it was convenient for them—between the hours of 10 am and 3 pm—which is unacceptable. You cannot gauge racial differences in testosterone from a small study (n=50) and a non-representative sample (college students). For these reasons, the study should be thrown in the trash—especially when formulating evolutionary hypotheses.
Testosterone is one of the most important hormones for vital functioning. By knowing how it is processed in the body and that there are no ‘genes for’ testosterone (‘low testosterone genes’ notwithstanding) along with how testosterone has a low relationship with physical aggression one should not be scared of having high levels, on the contrary, one should be scared of having low levels. I have once again proven my case that testosterone is not related to violence in showing the diurnal variation in testosterone levels in adults, as well as the time of day that crimes are committed by both adults and children. High testosterone means high confidence and high dominance—and those two traits have a lot to do with masculinity—which do not lead to violence.
I know why testosterone does not cause crime—because I have an understanding of the hormone, how its produced in the body and what its effects on the body are. The most important thing to note here, is that even if blacks had 15 percent higher testosterone than whites, it still wouldn’t explain higher rates of crime or disease such as prostate cancer. So those who try so hard to prove that blacks have higher levels of the hormone do so in vain, because even if they did it wouldn’t mean anything for any theories they may have. The myth of testosterone causing aggression and crime need to be put to bed for good.
Testosterone and Aggressive Behavior
1200 words
Testosterone gets a bad rep. People assume that if one has higher testosterone than average, that they will be a savage, bloodthirsty beast with an insatiable thirst for blood. This, however, is not the case. I’ve documented how testosterone is vital for male functioning, and how higher levels don’t lead to maladies such as prostate cancer. Testosterone is feared for no reason at all. The reason that people are scared of it is that of the anecdotal reports that individual A had higher testosterone when he committed crime B so, therefore, anyone who commits a crime has higher testosterone and that is the ultimate—not proximate—cause of crime. This is erroneous. There is a positive—albeit extremely low—correlation between physical aggression and violence at .14. That’s it. Furthermore, most of these claims of higher levels of testosterone causing violence is extrapolated from animal studies to humans.
Testosterone has been shown to lead to violent and aggressive behavior, largely only in animal studies (Archer, 1991; Book et al, 2001). For years, the relationship between the two variables was thought to be causal, i.e., high levels of testosterone cause violent crimes, which has been called into question over recent years. This is due to how the environment can raise testosterone levels. I have documented how these environmental factors can raise testosterone—and after these events, testosterone stays elevated.
Largely, animal studies are used to infer that high levels of testosterone in and of themselves lead to higher rates of aggression and therefore crime. However, two important meta-analyses show this is not necessarily the case (Archer, 1991; Book et al, 2001). Book et al, 2001 showed that two variables were important in seeing the relationship between aggression and crime—the time of day that the assay was taken and the age of the participant. This effect was seen to be largest in, not unexpectedly, males aged 13-20 (Book et al, 2001: 594). So since age confounds the relationship between aggression and testosterone in males, that is a variable that must also be controlled for (which, in the meta-analyses and other papers I cite on black and white testosterone is controlled for).
More interestingly, Book et al (2001) showed that the nature of the measure of aggression (self-reported or behavioral) did not have any effect on the relationship between testosterone and aggression. Since there is no difference between the two measures, then a pencil-and-paper test is a good enough index of measure of aggression, comparable to observing the behavior of the individual studied.
Archer (1991) also showed the same low—but positive—correlations between aggression and testosterone. Of course, as I’ve extensively documented since there is a positive relationship between the two variables does not necessarily mean that high-testosterone men commit more crime—since the outcome of certain situations can increase and decrease testosterone, no causal factors have been detangled. Book et al (2001) confirmed Archer’s (1991) finding that the correlation between violent and aggressive behavior was positive and low at .14.
Valois et al (2017) showed there was a relationship between emotional self-efficacy (ESE) and aggressive and violent behaviors in a statewide sample of high school children in South Carolina (n=3,386). Their results suggested that there was a relationship between carrying a weapon to school within the past 30 days along with being injured with a club, knife or gun in the past 12 months was significantly associated with ESE for specific race and sex groups.
Black girls who reported a low ESE reported carrying a weapon to school 30 days prior to the survey were 3.22 times more than black girls with a high ESE who did not report carrying a weapon to school within the past 30 days prior to the questionnaire. For black boys with low ESE, they were 3.07 times more likely to carry a weapon to school within the past 30 days in comparison to black boys with high ESE who did not carry a weapon to school in the past 30 days. White girls who reported low ESE had the highest chance of bringing a weapon to school in comparison to white girls with low ESE—they were 5.87 times more likely to carry a weapon to school 30 days prior to the survey. Finally, white boys with low ESE were slightly more than 2 times more likely than white boys with high ESE to carry a weapon to school 30 days prior to the survey.
Low ESE in white and black girls is associated with carrying a weapon to school, whereas low ESE for white and black boys is associated with being threatened. Further, their results suggested that carrying a weapon to school was associated with low ESE in black and white girls suggesting that low ESE is both situation-specific and specific to the female sex. The mediator between these things is low ESE—it is different for both black boys and black girls, and when it occurs different courses of action are taken, whether it’s through bringing a weapon to school or being threatened. What this tells me is that black and white boys with low ESE are more likely to be threatened because they are perceived to be more meek, while black and white girls with low ESE that get provoked at school are more likely to bring weapons. So it seems that girls bring weapons when provoked and boys fight.
The two meta-analyses reviewed above show that there is a low positive (.14) correlation between testosterone and aggression (Archer, 1991; Book et al, 2001). Thusly, high levels of testosterone on their own are not sufficient enough to explain high levels of aggression/violence. Further, there are race- and sex-specific differences when one is threatened at high school with black and white boys being more likely to report being threatened more (which implies a higher rate of physical fighting) while black and white girls when threatened brought weapons to school. These race- and sex-specific differences in the course of action taken when they are physically threatened needs to be looked into more.
I’d like to see the difference in testosterone levels for a matched sample of black and white boys from two neighboring districts with different murder rates as a proxy for the amount of violence in the area. I’d bet that the places with a higher murder rate would have children 1) report more violence and instances of bringing weapons to school and 2) report more harm from these encounters—especially if they have low ESE as seen in Valois (2017) and 3) the children in the high schools along with the residents of the area would have higher testosterone than the place with less violence. I would expect these differences to be magnified in the direction of Valois (2017) in that areas with higher murder rates would have black and white girls report bringing weapons to school when threatened whereas black and white boys would report more physical violence.
High testosterone itself is not sufficient enough to explain violence as the correlation is extremely low at .14. Testosterone levels fluctuate depending on the time of day (Brambilla et al, 2009; Long, Nguyen, and Stevermer, 2015) to the time of year (Stanton, Mullette-Gillman, and Huettel, 2011; Demur, Uslu, and Arslun, 2016). How the genders/races react differently when threatened in adolescence is interesting and deserves further study.
Race, Testosterone, and Prostate Cancer
1900 words
I have explicitly shown how the ‘black men have more T’ canard is false. I have provided sufficient evidence for this claim. People claim to be unbiased—like PumpkinPerson—and say they’re only ‘looking for the truth’. However, it’s clear that in all of my conversations with him on the matter, he’s reaching for anything that affirms his worldview when he is shown evidence to the contrary of his beliefs (Nyhan and Reifler, 2012). It’s so very easy to notice this. I will provide yet more robust data on the black/white testosterone ‘gap’ while also critiquing some other studies that didn’t control for some pretty important variables. The gist is: after controlling for the most important variables, (waist circumference, BMI) the ‘testosterone difference’ all but disappears—and I don’t think people will argue for .0068 ng/ml higher testosterone cause things like prostate cancer and higher rates of crime.
Gapstur et al (2002) studied 5,115 individuals from aged 18-30 who completed baseline examinations at one of four locations from 1985-86: Birmingham, Alabama; Chicago, Illinois; Minneapolis, Minnesota; and Oakland, California. Then, 4 follow-ups were completed (Year 2: 1987-88; year 5: 1990-91; year 7: 1992-93; and year 10: 1995-96).
The number of blacks who completed the baseline information was 1157 whereas for whites it was 1171. They measured waist circumference (WC) at the minimal abdominal girth. Whether or not one took medication was self-reported, so Gapstur et al (2002) separated medications into two categories: regulation or interfering with binding likely, or interfering with binding unlikely/impossible.
Now, before I discuss the results of Gapstur et al (2002) I must talk about why they controlled for BMI (body mass index) and WC along with age. Since the obesity rate differs by race/ethnicity, along with obesity frequently changing with age, all three of the variables need to be controlled for to get a clearer picture of what circulating testosterone looks like—on average—between blacks and whites. White men are slightly more likely than black men to be obese/overweight in America (being African-American seems to be a protector against obesity; African American men with more African ancestry are less likely to be obese), however the sample used by Gapstur et al (2002) had blacks who had a higher WC and BMI than whites.
At year 2, there was no significant difference in total serum testosterone between the races with or without adjustment for age, BMI and WC. The only part in this analysis that blacks had higher testosterone levels than whites was at year ten, with black ‘enjoying’ .0063 ng/ml higher levels than whites. Furthermore, there was no significant difference in testosterone between blacks and whites after adjustment for age. Only adjusting for BMI, blacks had substantially higher levels of testosterone (.21 ng/ml) however after including WC and the changes in WC between blacks and whites (blacks had a greater change over the study) this difference all but disappeared. The age-associated changes in testosterone between blacks and whites were similar after adjusting for waist circumference and BMI. Also, after adjusting for the relevant confounds, free testosterone did not differ between blacks and whites.
Measures of body size (i.e., BMI and WC) must be controlled for when comparing race/ethny since levels of obesity vary amongst them as well as obesity constantly changing with age. Furthermore, testosterone increased for both groups between the ages of 20-21 to 22-23 (blacks had a higher T level by .7 ng/ml at age 20-21), with the two groups diverging at age 22-23 with blacks having higher levels of total testosterone by .1 ng/ml.
The average ages for the cohort were 28.4 and 28.8 for blacks and whites respectfully. Thus, blacks (theoretically) had a slight advantage due to the age confound, which had to be controlled for. The unadjusted mean total testosterone, SHGB, and free testosterone were not statistically significant at any point in the study except at year 10 where blacks had slightly higher levels at 5.8 ng/ml compared to whites’ 5.69 ng/ml. The difference in year 2 (when testosterone levels raised for both groups) was a difference of 5.8 and 5.75 for blacks and whites respectfully. Free testosterone did not differ at all from years 2, 7, and 10 (.17 compared to .17 in year 2; .16 to .15 in year 7; and .16 to .15 in year 10; blacks and whites respectfully).
Levels of testosterone were also found to be lower in 12-13-year-old blacks compared to whites (Lopez et al, 2013). In this study, Mexican Americans had higher T levels, while after adjustments for confounds, blacks and whites did not differ. They conclude that testosterone levels were not higher in black compared to white adolescents. Black men have higher levels of estradiol than white men, not testosterone (Roerrmann et al, 2007; Lopez et al, 2013). These studies are done to see the relationship between PCa (prostate cancer) and certain hormones. These and other studies have shown that the black-white difference isn’t large (Richard et al, 1992; Roerrmann et al, 2007; Lopez et al, 2013; Richard et al, 2014) and that prostate cancer is not caused by abnormally high testosterone levels (Stattin et al, 2003; Michaud, Billups, and Partins, 2015).
Ross et al (1986) did not have a measure of central adiposity (WC), thusly the results were confounded. Further, the other study Rushton cited in Race, Evolution, and Behavior is and Nyborg (1992) on discharged army veterans stating a difference of 3 percent, Ellis and Nyborg did not control for WC nor BMI. As seen in the Gapstur et al (2002) study, WC is an extremely important variable to control for as decreases in testosterone are high when central adiposity is high (Wang et al, 2011) so if we are trying to compare two ethnies on one variable such as testosterone, all of the above variables MUST be controlled for, and if they are not then they can be safely disregarded.
The non-inclusion of a measure of WC is the most likely cause of the different results found in Gapstur et al (2002). If you don’t control for WC, then you cannot get an actual and reliable testosterone reading since the results will be confounded. Anyone who says otherwise that the aforementioned variables do not need to be controlled for literally have no idea what they’re talking about.
Lastly, a few more things must be addressed. In PumpkinPerson’s most recent article “Racial differences in testosterone“, he seems to now disavow testosterone as a useful measure since it can fluctuate due to winning sports games, to marriage, to anticipating confrontation, to being in a relationship, to honor culture. Now his thing is exposure to androgens (testosterone) in the womb. Supposedly, blacks have the lowest digit ratio, and low digit ratios signify higher levels of testosterone in vitro (Manning et al, 2004). However, the relationship is far from proven (Koehler, Simmons, and Rhodes, 2004; Yan et al, 2008, Medland et al, 2010) with these results, leaning towards no. Koheler, Simmons, and Rhodes (2004) failed to find any significant correlation between 2d/4d ratio and traits mediated by testosterone. So this is another claim that’s been put to bed as well.
There is a lot of bullshit to sift through out there; some things may seem simple at face value, but if you dig into it, it’s much more likely to be more complex than what it looks to be on the surface. This one singular variable (testosterone) is one of them. It does not differ between the races; exposure to androgens in the womb doesn’t affect digit ratio; high testosterone does not cause prostate cancer, but low testosterone does (Morgentaler, Brunning, and DeWolf, 1996) ; you can literally inject exogenous testosterone into a man with PCa and not effect this malady (Eisenberg, 2015; Boyle et al, 2016)
I hope this is the last time I have to say this: testosterone does not differ between blacks and whites. Testosterone is not the cause of differences in mortality rate in regards to PCa. (Diet is the much more likely factor) People still regurgitate Rushton’s bullshit from REB; Ross et al (1986) still gets cited to this day, when there are much more robust studies and samples that controlled for the relevant confounds that Ross et al (1986) did not control for. This is why that study is garbage and should not be looked at when assessing testosterone differences between the races. Much larger and robust samples show that there is no testosterone difference when the WC is controlled for.
Testosterone is not higher in black Americans; the data shows either an extremely negligible difference or no difference, not the huge 13 and 21 percent difference in free and total testosterone in black Americans in Ross et al (1986).
For the last time, and say it with me: testosterone does NOT differ by race, 2d:4d ratio is NOT influenced by androgens in vitro, and testosterone does NOT influence PCa rates. Testosterone is an extremely important hormone for vital functioning, so whoever believes the myths of the high testosterone savage and LIKES having low testosterone, have fun with a slew of maladies later in life.
References
Boyle, P., Koechlin, A., Bota, M., Donofrio, A., Zaridze, D. G., Perrin, P., . . . Boniol, M. (2016). Endogenous and exogenous testosterone and the risk of prostate cancer and increased prostate-specific antigen (PSA) level: a meta-analysis. BJU International,118(5), 731-741. doi:10.1111/bju.13417
Dobs, A., & Morgentaler, A. (2008). Does Testosterone Therapy Increase the Risk of Prostate Cancer? Endocrine Practice,14(7), 904-911. doi:10.4158/ep.14.7.904
Eisenberg, M. L. (2015). Testosterone Replacement Therapy and Prostate Cancer Incidence. The World Journal of Men’s Health, 33(3), 125–129. http://doi.org/10.5534/wjmh.2015.33.3.125
Gapstur, S. M., Kopp, P., Gann, P. H., Chiu, B. C., Colangelo, L. A., & Liu, K. (2006). Changes in BMI modulate age-associated changes in sex hormone binding globulin and total testosterone, but not bioavailable testosterone in young adult men: the CARDIA Male Hormone Study. International Journal of Obesity. doi:10.1038/sj.ijo.0803465
Koehler, N., Simmons, L. W., & Rhodes, G. (2004). How well does second-to-fourth-digit ratio in hands correlate with other indications of masculinity in males? Proceedings of the Royal Society B: Biological Sciences,271(Suppl_5). doi:10.1098/rsbl.2004.0163
Lopez, D. S., Peskoe, S. B., Joshu, C. E., Dobs, A., Feinleib, M., Kanarek, N., . . . Platz, E. A. (2013). Racial/ethnic differences in serum sex steroid hormone concentrations in US adolescent males. Cancer Causes & Control,24(4), 817-826. doi:10.1007/s10552-013-0154-8
Michaud, J. E., Billups, K. L., & Partin, A. W. (2015). Testosterone and prostate cancer: an evidence-based review of pathogenesis and oncologic risk. Therapeutic Advances in Urology,7(6), 378-387. doi:10.1177/1756287215597633
Medland, S. E., Zayats, T., Glaser, B., Nyholt, D. R., Gordon, S. D., Wright, M. J., . . . Evans, D. M. (2010). A Variant in LIN28B Is Associated with 2D:4D Finger-Length Ratio, a Putative Retrospective Biomarker of Prenatal Testosterone Exposure. The American Journal of Human Genetics,86(4), 519-525. doi:10.1016/j.ajhg.2010.02.017
Manning, J., Stewart, A., Bundred, P., & Trivers, R. (2004). Sex and ethnic differences in 2nd to 4th digit ratio of children. Early Human Development,80(2), 161-168. doi:10.1016/j.earlhumdev.2004.06.004
Morgentaler, A., Brunning, C. O., 3rd, & DeWolf, W. C. (1996). Occult Prostate Cancer in Men With Low Serum Testosterone Levels. JAMA: The Journal of the American Medical Association,276(23), 1904. doi:10.1001/jama.1996.03540230054035
Nyhan, B., & Reifler, J. (2010). When Corrections Fail: The Persistence of Political Misperceptions. Political Behavior,32(2), 303-330. doi:10.1007/s11109-010-9112-2
Richard, A., Rohrmann, S., Zhang, L., Eichholzer, M., Basaria, S., Selvin, E., . . . Platz, E. A. (2014). Racial variation in sex steroid hormone concentration in black and white men: a meta-analysis. Andrology,2(3), 428-435. doi:10.1111/j.2047-2927.2014.00206.x
Rohrmann, S., Nelson, W. G., Rifai, N., Brown, T. R., Dobs, A., Kanarek, N., . . . Platz, E. A. (2007). Serum Estrogen, But Not Testosterone, Levels Differ between Black and White Men in a Nationally Representative Sample of Americans. The Journal of Clinical Endocrinology & Metabolism,92(7), 2519-2525. doi:10.1210/jc.2007-0028
Wang, C., Jackson, G., Jones, T. H., Matsumoto, A. M., Nehra, A., Perelman, M. A., … Cunningham, G. (2011). Low Testosterone Associated With Obesity and the Metabolic Syndrome Contributes to Sexual Dysfunction and Cardiovascular Disease Risk in Men With Type 2 Diabetes. Diabetes Care, 34(7), 1669–1675. http://doi.org/10.2337/dc10-2339
Yan RHY, Malisch JL, Hannon RM, Hurd PL, Garland T Jr (2008) Selective Breeding for a Behavioral Trait Changes Digit Ratio. PLoS ONE 3(9): e3216. https://doi.org/10.1371/journal.pone.0003216
Dinosaurs, Brains, and ‘Progressive’ Evolution: Part II
1700 words
In part I, I showed how Dale Russel’s contention that the troodon would have evolved into a bipedal ‘dinosauroid’ with human locomotion and a human-sized brain was pure fantasy. I ordered the book of his that Rushton cited in his book Race, Evolution, and Behavior and I finally received it last week. When I read the relevant parts, I yawned because it’s the same old stuff that I’ve covered here on this blog numerous times. Since literally the only relevant part in the book about the troodon is the final 7 pages, that’s what I will cover today—along with a few more lines of evidence that large brains lie outside reptilian design (Gould, 1989).
First off, all of Rushton’s contentions in the final pages of his book (Rushton, 1997) need to be rebutted. Rushton (1997: 294) writes that dinosaur brains were ‘progressing’ in size for 140 million years, but neither of Russel’s writings that I have (Russel 1983; 1989) have the statement in them.
In the book Up From Dragons: The Evolution of Human Intelligence neuroscientist, evolutionary psychologist John Skoyles and science writer Dorian Sagan—the son of Carl Sagan—speak briefly about reptilian intelligence and why they wouldn’t have reached our levels of intellect:
But cold-bloodedness is a dead-end for the great story of this book—the evolution of intelligence. Certainly reptiles could evolve huge sizes, as they did over vast sweeps of Earth as dinosaurs. But they never could have evolved our quick-witted and smart brains. Being tied to the sun restricts their behavior: Instead of being free and active, searching and understanding the world, they spend too much time avoiding getting too hot or too cold. (Skoyles and Sagan, 2002: 12)
Hopson (1977: 443) writes:
I would argue, as does Feduccia (44), that the mammalian/avian levels of activity claimed by Bakker for dinosaurs should be correlated with a great increase in motor and sensory control and this should be reflected in increased brain size. Such an increase is not indicated by most dinosaur endocasts.
Most importantly, if some dinosaurs DID have bird-sized brains, the above contention would still hold. Hopson concludes that, except for coelurosaurs “the range of behaviors that existed in dinosaurs, as inferred from trackways and skeletal morphology, may not have lain much outside the observed range in ectothermic crocodilians” (Hopson, 1977: 444).
Since the conjecture/’thought experiment’ of the troodon was rebutted last week, it’s pretty conclusive that large brains lie outside of reptilian design; they need to spend so much time avoiding getting too hot or cold—as well as hunt and eat—so exploring the world and learning was not possible for them—along with the fact that they didn’t have a primate morphology and thus didn’t have the ability to fully manipulate their environment as we do which would further select for larger brains. However, as Hopson (1977) notes, animals with higher metabolic rates had larger brains; coelurosaurs had high metabolic rates and the largest dinosaur brains (Russel, 1983; 1989)—but that doesn’t mean they would have eventually evolved human-like intelligence, bipedalism or brain size and to say otherwise is fantasy.
Furthermore, there is large variation in encephalization and encephalization is not universal in mammals (Shultz and Dunbar, 2010).
Here is the thing about brain size increases: it is a local level trend. A local level trend is a trend that occurs within one or a few related species. This is exactly what characterized brain evolution; there is large variation depending on what the environment calls for (Boddy et al, 2012; Montgomery et al, 2012; see also island gigantism; Bromham and Cardillo, 2007; Welch, 2009; and also see the deep sea rule; Mcclain, Boyer, and Rosenberg, 2006). So these local trends differ by species—even one population split by, say, 50 miles of water will speciate and become evolve a completely different phenotype due to the environment of time. That is evolution by natural selection; local change, not any inherent or intrinsic ‘progress’ (Gould, 1996).
The same local level trend occurs with parasites. Now think about parasites. The get selected for ‘complexity’ or a decrease in ‘complexity’ depending on what occurs in their host. Now, looking at it from this perspective, the body is the host’s environment while the earth is ours; so my example for an environmental change would be, as usual, the asteroid impact hitting the earth blocking out the sun and decreasing high-quality food all throughout the earth. Surely I don’t need to tell you what would occur…
Russel (1989) writes:
Examples of evolutionary changes that occured at ever-increasing speeds include the initial diversification of animals in the sea 650 and 550 million years ago, the attainment of tree stature in land plants between 410 and 360 million years ago, and the diversification of mammals between 200 million years ago and the present. Changes like this have resulted in increased organismal complexity, which, in combination with a general increase in number of species, has made the biosphere of the modern Earth so much richer than it was several hundred million years ago. It is reasonable to suppose that animals living in a complex environment might find it advantageous to possess complex nervous systems in order to have access to a greater variety of responses. Indeed, the largest proportion of brain weight in an animal has also increased at an ever-increasing rate across geological time. The brain has become evidently larger in animals as diverse as insects, mollusks, and backboned creatures. Relative brain size can be taken as an indication of biotic interactions.
He references time periods that correspond with decimations (mass extinctions). Decimations lead to diversification. Think back to the Cambrian Explosion. During the Cambrian Explosion, many more lifeforms existed than can be currently classified. Therefore, according to the decimation and diversification model, greater diversity of life existed in the past. When decimations (defined as a reduction in the anatomical forms of life from mass extinction) occur, the niches that become extinct quickly become filled.
The time periods that Russel references are when mass extinctions occurred. This is how diversification occurs. What allowed for this ‘organismal complexity’ and increase in the number of species (though body plans are limited due to the Burgess Decimation) is due to the decimations. Decimation and diversification proves that evolution is not progressive.
A ‘trend’ in biology is directional change in a group stat using the mean, median or mode. Any existence of a trend from the mean (‘progress’) tells us nothing about the underlying mechanisms behind it.
To wrap this all up, even if a trend in X were to be discovered, it still wouldn’t tell us a thing about the underlying mechanisms causing it, nor will it tell us about any increasing tendency.
The analogy of the drunkard’s walk (Gould, 1996) is why ‘progress’ doesn’t make sense. Further, niche construction matters as well. When organisms construct their own niches, change occurs based on those niche constructions. Milk-drinking 8kya in Europe and African farmers diverting water for their crops having mosquitoes come by and gaining a resistance to malaria are two examples of niche construction (Laland et al, 2009). That’s another barrier to progress!
In sum, Dale Russel says nothing I’ve not heard before in regards to ‘progressive’ evolution. He only describes ever-increasing ‘complexity’ which is due to decimations and further diversification by organisms to fill empty niches. Any type of ‘progress’ would have been stymied by mass extinctions.
Further, the fact that species can consciously—in a way—guide their own evolution through the manipulation of the environment once again shows how evolution doesn’t mean progress—it literally only means local change and any type of local change, no matter to what type of environment, will cause concurrent increases/decreases on whichever relevant traits that will give the organism the best chance for survival in that environment.
This is why evolution is not progressive; and even if scientists were to identify one thing, still, a causal mechanism won’t be able to be inferred. Ruseel (1989) describes right and left walls of complexity—nothing more. Dinosaurs didn’t have the body plans to have our brain size, bipedalism and intelligence, nor did they have the right type of blood, nor did they have the time to search and learn about the world due to being constrained to their cold-blooded system—being a slave to the sun, always attempting to avoid overheating or getting too cold (Skoyles and Sagan, 2002). The so-called ‘dinosauroid’ is an impossibility and implies a teleological lean to evolution—as if our morphology (or something similar from an unrelated organism) will always evolve if we replay the tape of life again (Gould, 1989; 1996). This is what Russel is pretty much arguing, and he is 100 percent wrong as noted above.
References
Bromham, L., & Cardillo, M. (2007). Primates follow the ‘island rule’: implications for interpreting Homo floresiensis. Biology Letters,3(4), 398-400. doi:10.1098/rsbl.2007.0113
Boddy, A. M., Mcgowen, M. R., Sherwood, C. C., Grossman, L. I., Goodman, M., & Wildman, D. E. (2012). Comparative analysis of encephalization in mammals reveals relaxed constraints on anthropoid primate and cetacean brain scaling. Journal of Evolutionary Biology,25(5), 981-994. doi:10.1111/j.1420-9101.2012.02491.x
Gould, S. J. (1989). Wonderful life: the Burgess Shale and the nature of history. New York: Norton.
Gould, S. J. (1996). Full House: The Spread of Excellence from Plato to Darwin. New York: Harmony Books.
Hopson, J. A. (1977). Relative Brain Size and Behavior in Archosaurian Reptiles. Annual Review of Ecology and Systematics,8(1), 429-448. doi:10.1146/annurev.es.08.110177.002241
Laland, K. N., Odling-Smee, J., Feldman, M. W., & Kendal, J. (2009). Conceptual Barriers to Progress Within Evolutionary Biology. Foundations of Science, 14(3), 195–216. http://doi.org/10.1007/s10699-008-9153-8
Mcclain, C. R., Boyer, A. G., & Rosenberg, G. (2006). The island rule and the evolution of body size in the deep sea. Journal of Biogeography,33(9), 1578-1584. doi:10.1111/j.1365-2699.2006.01545.x
Montgomery, S. H., Capellini, I., Barton, R. A., & Mundy, N. I. (2010). Reconstructing the ups and downs of primate brain evolution: implications for adaptive hypotheses and Homo floresiensis. BMC Biology,8(1), 9. doi:10.1186/1741-7007-8-9
Russell, D. A. (1983). Exponential evolution: Implications for intelligent extraterrestrial life. Advances in Space Research,3(9), 95-103. doi:10.1016/0273-1177(83)90045-5
Russell, D. A. (1989). An Odyssey in Time: The Dinosaurs of North America. Minocqua, WI: Published by NorthWord Press in association with National Museum of Natural Sciences.
Rushton J P (1997). Race, Evolution, and Behavior. A Life History Perspective (Transaction, New Brunswick, London).
Shultz, S., & Dunbar, R. (2010). Encephalization is not a universal macroevolutionary phenomenon in mammals but is associated with sociality. Proceedings of the National Academy of Sciences,107(50), 21582-21586. doi:10.1073/pnas.1005246107
Skoyles, J. R., & Sagan, D. (2002). Up From Dragons: The Evolution of Human Intelligence. New York: McGraw-Hill.
Welch, J. J. (2009). Testing the island rule: primates as a case study. Proceedings of the Royal Society B: Biological Sciences,276(1657), 675-682. doi:10.1098/rspb.2008.1180
The Evolution of Racial Pelvis Variation
1850 words
It’s well-known that blacks have narrower hips than whites (Rushton, 1997; Handa et al, 2008). These pelvic differences then account for part of the variation in elite sporting events such as sprinting and jumping (Entine, 2000). These pelvic differences are the result of climatic variation and sexual selection.
The evolution of the pelvis is due to bipedalism. We are bipeds because of our S-shaped spine, which helps us to cope with differing loads. The human pelvis had to evolve in two ways—to make birthing babies easier and to become more efficient for bipedal walking. Termed the ‘obstetric dilemma’, it has implications for osteoarthritis in both men and women (Hogervorst, Heinse, and de Vos, 2009). Having a more efficient bipedal gait meant the body could allocate energy to other parts of the body—mainly our growing brains/neuronal count. Over time, the brain grew while the pelvis had to shrink for more efficient bipedalism. The pelvis also got narrower in our evolution, being wider in Australopithicenes, while becoming more narrow when erectus appeared—which is the first instance of a humanlike pelvis in the fossil record—which increased how far we could travel as well as reduce our energy expenditure (Lieberman, et al, 2006). Further discussion can be found in my article Man the Athlete.
So we began evolving a narrower pelvis in comparison to our ancestors because it was more efficient for heat dissipation. Smaller trunks are more efficient for heat dissipation (Lieberman, 2015), whereas wider trunks are more efficient for thermoregulation in colder climes (Weaver and Hublin, 2008; Weaver, 2009; Gruss and Schmidt, 2015). Now, simply applying this logic to Eurasians and Africans (I am grouping East Asians and Europeans together since they were a single breeding population up until about 23,000-6,500ya), we can see one reason why that population has wider pelves than Africans.
When anatomically modern humans (AMH) left Africa between 50-100kya, human skeletal morphology was just like modern-day Africans’ today. When Man migrated into northerly climes, however, a wider pelvis was needed to retain heat in colder climes (Gruss and Schmidt, 2015). So, along with a wider pelvis evolving due to climatic demands on the body, as we migrated north the human brain expanded due to the climate of the area, along with expanding the pelvis to better thermoregulate (which a bigger brain also does in northerly climes). I did argue two months back (and added to Skoyles’ (1999) theory) that brain size increased for expertise capacity and not IQ since Arctic people needed more tools, as well as tools that were more complex, in comparison to peoples who evolved in a hotter climate. So selection then occurred for larger brains and pelvis due to the demand for thermoregulation and bigger brains—which then led to earlier births and more helpless babes, which higher levels of intelligence were then needed to care for them (Piantadosi and Kidd, 2016). The helplessness of infants predicts the intelligence of adults in the primate genera (Piantadosi and Kidd, 2016), so I will assume that this holds within primate species as well (I am not able to locate a citation that this doesn’t hold within the primate genera; if I am in error, please provide a citation). Since African children are born earlier and more mature than Eurasian children who are born slightly later and more helpless/less developed, this is one reason why Eurasians have higher levels of intelligence than Africans (which is independent of any direct effects of climate I may add!).
So since Eurasians needed a larger brains to make more tools in the Arctic/colder climes, their brains needed to expand in size for increased expertise capacity, which would then have further selected for wider pelves in Eurasian women. Climatic variation caused the wider hips/bigger brains in Eurasians, which then allowed the evolution of larger brains in comparison to those who remained in Africa.
Finally, the obstetric dilemma has been recently called into question; there is evidence that a wider pelvis does not increase locomotor costs in humans (Warrener et al, 2015), a treadmill tracked their gait, as well as the motion of their pelvis. This study is used as evidence that the obstetric dilemma is wrong—they argue that there is no trade-off between narrower hips in men and wider hips in women. However, as the authors point out, all subjects in the study walked/ran at the same speed. Let’s say that the speed was heightened; do you think the women/men with wider pelves would have had the same locomotor costs as the men/women with narrower pelves? The answer is, obviously, no.
The pelvis of all of the races of Man has evolved the way they are due to environmental/climatic demands. A wider pelvis is better for thermoregulation in colder climates, while a narrower pelvis/body is more efficient for heat loss (Gruss and Schmidt, 2015).
Thus, we can look at the evolution of brain size/pelvic size in a few ways: 1) The amount of tools/complexity of the tools in the area that led to a need for an increase in brain size for more ‘chunks’ (Gobet and Simon, 1998), which then—along with colder climates—selected for larger brains and a wider body/pelvis which made birthing babes with large heads/brains easier along with helping to conserve heat due to the wider body (Gruss and Schmidt, 2015); 2) Since people in higher altitudes needed a high amount of expertise to survive, further selection for bigger brains, wider pelves occurred because of this; 3) Africans have smaller pelves in comparison to Eurasians because they evolved in hotter climes and didn’t have the amount of tools that peoples in more northerly climes did—which also increased brain size; 4) putting this all together, we can say that because Africans live in hotter climates, they need narrow pelves in order to lose body heat; Eurasians, after they migrated into more northerly climes, needed a wider body/pelvis in order to retain heat. When Man migrated north, he needed the ability to become an expert in, say, tool-making and thus needed a bigger brain for more informational chunks (Simon and Gobet, 1998; Skoyles, 1999). Due to this, Eurasians have wider pelves since they needed larger brains for a higher expertise capacity (Skoyles, 1999).
When Man migrated north, he needed the ability to become an expert in, say, tool-making and thus needed a bigger brain for more informational chunks (Simon and Gobet, 1998; Skoyles, 1999). Due to this, Eurasians have wider pelves than Africans; so they can birth larger-brained children. The width of the female pelvis, too, was shaped by sexual selection (Lassek and Gaulin, 2009). Therefore, the evolution of the modern pelvis in human populations comes down to climatic variation, which, in turn, affects how large of a brain the babe is able to have. Climate constrains brain size in either ‘direction’, big or small. We don’t even need to look at the variation within modern Homo sapiens to see the pattern in pelvic size we do today; because the pelvic differences noted among Man definitely were in effect millions of years ago, with hominids in colder climates having wider pelves while hominids in warmer climates had narrower pelves.
Along with everything above, the evolution of the human pelvis has a few implications for the human races today. Some recent studies have shown that there is no obstetric dilemma at all, with birth complications being caused by babies with higher weights than in our ancestral past, due to environmental mismatches causing higher-weight babies (Warrener et al, 2015; Betti, 2017), which was also beneficial for the evolution of our large brains (Cunnane and Crawford, 2003) with the largest amount of cortical neurons in the animal kingdom. However, marked differences in locomotion would be seen in people who had wide pelves compared to narrow pelves; which is what we see in elite running competitions: the elite runners have narrower pelves. So wider pelves don’t impede normal bipedal walking, but it does impede being able to efficiently run, as evidenced in participants of elite sprinting and marathon competitions. Looking at champion athletes and studying their locomotion (along with other traits as I’ve covered here) you can see that those with narrower pelves win more competitions than those with wider pelves (and happen to have different muscle fiber competition, fat distribution/percent, and morphology).
Racial differences in the pelvis explain the reasons behind why a certain race dominates in certain elite competitions; it largely comes down to skeletal morphology. These skeletal differences have evolutionary underpinnings, with the same pelvic differences seen in hominins that evolved in colder/warmer climates in the past. These pelvic differences (along with body fat percentage/distribution, musculoskeletal morphology, muscle fiber type, lean mass percentage, lower Vo2 max, poorer running economy, a larger Q-angle [4.6 degrees greater than men], etc) are why women are less efficient runners. People with wider hips are more likely to have be endomorphic while people with narrower hips are more likely to be ecto and meso. Not surprisingly, people from northerly climes consistently win WSM competitions whereas East and West Africans dominate bodybuilding and sprinting/marathons due to having a narrower pelvis and other advantageous morphological traits that lead to success in the sport. Nevertheless, pelvic differences between the races largely come down to differences in climate, which was also seen in ancient hominins. These pelvic differences further lead to racial differences in elite sporting competition.
References
Betti, L. (2017). Human Variation in Pelvic Shape and the Effects of Climate and Past Population History. The Anatomical Record,300(4), 687-697. doi:10.1002/ar.23542
Cunnane, S. C., & Crawford, M. A. (2003). Survival of the fattest: fat babies were the key to evolution of the large human brain. Comparative Biochemistry and Physiology Part A: Molecular & Integrative Physiology,136(1), 17-26. doi:10.1016/s1095-6433(03)00048-5
Dr. John R. Skoyles (1999) HUMAN EVOLUTION EXPANDED BRAINS TO INCREASE EXPERTISE CAPACITY, NOT IQ. Psycoloquy: 10(002) brain expertise
Entine, J. (2000). Taboo: why Black athletes dominate sports and why we are afraid to talk about it. New York: PublicAffairs.
Gobet, F., & Simon, H. A. (1998). Expert Chess Memory: Revisiting the Chunking Hypothesis. Memory,6(3), 225-255. doi:10.1080/741942359
Gruss, L. T., & Schmitt, D. (2015). The evolution of the human pelvis: changing adaptations to bipedalism, obstetrics and thermoregulation. Philosophical Transactions of the Royal Society B: Biological Sciences,370(1663), 20140063-20140063. doi:10.1098/rstb.2014.0063
Hogervorst, T., Heinse W.B., & de Vos J., (2009) Evolution of the hip and pelvis. Acta Orthopaedica, 80:sup336, 1-39, DOI: 10.1080/17453690610046620
Lieberman, D. E., Raichlen, D. A., Pontzer, H., Bramble, D. M., & Cutright-Smith, E. (2006). The human gluteus maximus and its role in running. Journal of Experimental Biology,209(11), 2143-2155. doi:10.1242/jeb.02255
Lieberman, D. E. (2015). Human Locomotion and Heat Loss: An Evolutionary Perspective. Comprehensive Physiology, 99-117. doi:10.1002/cphy.c140011
Piantadosi, S. T., & Kidd, C. (2016). Extraordinary intelligence and the care of infants. Proceedings of the National Academy of Sciences,113(25), 6874-6879. doi:10.1073/pnas.1506752113
Rushton J P (1997). Race, Evolution, and Behavior. A Life History Perspective (Transaction, New Brunswick, London).
Handa, V. L., Lockhart, M. E., Fielding, J. R., Bradley, C. S., Brubakery, L., Cundiffy, G. W., … Richter, H. E. (2008). Racial Differences in Pelvic Anatomy by Magnetic Resonance Imaging. Obstetrics and Gynecology, 111(4), 914–920.
Warrener, A. G., Lewton, K. L., Pontzer, H., & Lieberman, D. E. (2015). A Wider Pelvis Does Not Increase Locomotor Cost in Humans, with Implications for the Evolution of Childbirth. PLoS ONE, 10(3), e0118903.
Weaver, T. D., & Hublin, J. (2009). Neandertal birth canal shape and the evolution of human childbirth. Proceedings of the National Academy of Sciences,106(20), 8151-8156. doi:10.1073/pnas.0812554106
Weaver, T. D. (2009). The meaning of Neandertal skeletal morphology. Proceedings of the National Academy of Sciences,106(38), 16028-16033. doi:10.1073/pnas.0903864106
The Evolutionary Puzzle of Floresiensis
1600 words
Back in October, I wrote that floresiensis is either descended from Erectus or habilis, since those were the only two hominins in the region. Yesterday a study was published titled The affinities of Homo floresiensis based on phylogenetic analyses of cranial, dental, and postcranial characters (Argue et al, 2017), in which Argue et al argue that floresiensis was not descended from a shipwrecked Erectus, as is a popular view. Another theory is that floresiensis is descended from habilis. The third theory is that floresiensis is Homo sapiens with a pathology, but that has been disproven (Falk et al, 2009). It was commonly thought that the LB1 floresiensis specimen was a pathological human inflicted with Laron syndrome which is a type of growth hormone deficiency (Laron and Klinger, 1994).
Argue et al found that floresiensis and erectus had completely different bone structures, particularly in the pelvis and jaw. They now believe that the theory that floresiensis is a derived form of an erectus that swam or rafted to Flores has been defintively refuted. They found that floresiensis was a sister species to habilis. So either a common ancestor of floresiensis or habilis swam to Flores from Africa, or floresiensis evolved in Africa and swam to Flores. They used new phylogenetic techniques to ascertain that floresiensis is stil a part of our lineage, but shows no phylogenetic relationship to erectus on the tree.
According to Baab (2016), biogeography shows that Indonesian erectus is the best fit with what is currently known. She says if floresiensis was derived from erectus that it “implies some degree of body size reduction and more marked brain size reduction.”
Kubo, Kono, and Kaifu (2013) conclude that the evolution of floresiensis from early Javanese erectus is possible when comparing the brain cases of both specimens. However, if floresiensis descended from habilis, then the brain size reduction wouldn’t be as marked (and is still due to island dwarfism, just not on as large of a scale as it would be if floresiensis were descended from erectus). The LB1 specimen also shows the closest neural affinities to early Asian erectus (Baab, Mcnulty, and Harvati, 2013; but see Vannuci, Barron, and Holloway, 2013 for the microcephalic view). Weston and Lister, (2009) showed that there was a 30 percent reduction in brain size in Magalasy hippos, which lends credence to the insular dwarfism hypothesis for floresiensis. Craniofacial morphology also shows that floresiensis evolved from Asian erectus (Kaifu et al, 2011).
The teeth of unknown hominin found at Mata Menge are intermediate between floresiensis and erectus, being 600,000 years older than where floresiensis was found (van den Bergh et al, 2016). This lends credence to the hypothesis that floresiensis is derived from erectus. Furthermore, insular dwarfism is seen in primate species isolated on islands, with changes in body size seen in child populations even on large islands not far from the mainland (Bromham and Cardillo, 2007, Welch, 2009). Genetically isolated on islands, primates can become bigger if the parent population was smaller, or smaller if the parent population was bigger. This is due to differing energy demands relative to the parent population, along with differing predators/prey.
The island rule even holds in the deep sea. As is the case with islands, the deep sea is also associated with decreased food availability. Looking at several species of gastropods, McClain, Boyer, and Rosenberg (2006) found that the island rule held in small-bodied shallow species. They were found to have larger bodied deep-sea representatives, with the same being true for large bodied deep-sea gastropods. Further, island dwarfism in elephants on the islands Sicily, Malta, Cyprus; mammoths on the California channel islands; and red deer on the island Jersey involved body mass changes of 5- to 100-fold over 2,300 to 120,000 generations (Evans et al, 2012).
So the overall hypothesis that island dwarfism is still intact, albeit if floresiensis is derived from habilis, the reduction in brain/body size would be smaller than if floresiensis evolved from early Asian erectus.
Further evidence for brain/body size reduction due to less food availability is noted by Daniel Lieberman in his book The Story of the Human Body: Evolution, Health, and Disease (Lieberman, 2013). While talking about the evolution of floresiensis on page 123 he writes:
The same energetic constraints and processes also affect hunter-gatherers . 62
And in the 62nd footnote on page 391 he writes:
Several human “pygmy” populations (people whose height does not exceed 150 centimeters, or 4.9 feet) have evolved in energy limited places like rain forests or islands. Perhaps the small size of the Dmansi hominins from Georgia also reflected selection to save energy among the first colonists of Eurasia.
Either way, if floresiensis evolved from erectus or habilis, considerable reductions in brain size have to be explained, since the smallest erectus brain ever found is 600 cubic centimeters while the smallest habilis brain ever found is 510 cubic centimeters (Lieberman, 2013: 124), with floresiensis having a brain 417 cubic centimeters (Falk et al, 2007).
What is most important about the insular dwarfism hypothesis in regards to the evolution of floresiensis is the effect of energy reduction/food availability and quality in regards to populations isolated on islands from parent populations. Floresiensis was able to survive on about 1200 kcal by shrinking, needing to consume about 1400 kcal during lactation compared to 1800 kcal for an erectus female who needed about 2500 kcal during lactation (Lieberman, 2013: 125). The cognitive price for the reduction in the brain size of floresiensis is not known, but since brains are so energy expensive (Aiello and Wheeler, 1995; Herculano-Houzel and Kaas, 2011; Fonseca-Azevedo and Herculano-Houzel, 2012), the reduction seen in floresiensis is no surprise.
Energy is one of the most important drivers for the evolution of a species, the evolution of floresiensis is one major example of this. Whether floresiensis evolved from habilis or erectus, reduced energy on the island caused the brain and body size of floresiensis to get smaller to cope with fewer things to eat. Keep in mind that habilis was a meat-eater as well, and with lower-quality energy on the island, the brain would have to reduce in size as it’s one of the most expensive organs in the body. As I’ve been saying for a long time now, the quality of energy is most important to the evolution of a species—especially Man. Cooking was imperative to our evolution, and with a lower-quality diet, we, too, would evolve smaller brains and bodies to compensate for reduced energy consumption since our brains take 25 percent of our daily energy requirements to power despite being 2 percent of our overall body weight.
The evolution of floresiensis shows how important energy is in the evolution of species. Its biggest implication—no matter if floresiensis evolved from habilis or erectus—is how important diet quality is to evolution, as I’ve noted here, here, here, here, here, and here. Without our high-quality diet, we, too, would suffer the same body/brain size reductions that floresiensis did.
References
Aiello, L. C., & Wheeler, P. (1995). The Expensive-Tissue Hypothesis: The Brain and the Digestive System in Human and Primate Evolution. Current Anthropology,36(2), 199-221. doi:10.1086/204350
Argue, D., Groves, C. P., Lee, M. S., & Jungers, W. L. (2017). The affinities of Homo floresiensis based on phylogenetic analyses of cranial, dental, and postcranial characters. Journal of Human Evolution. doi:10.1016/j.jhevol.2017.02.006
Baab, K. L., Mcnulty, K. P., & Harvati, K. (2013). Homo floresiensis Contextualized: A Geometric Morphometric Comparative Analysis of Fossil and Pathological Human Samples. PLoS ONE,8(7). doi:10.1371/journal.pone.0069119
Baab, K.L. (2016). The place of Homo floresiensis in human evolution. Journal of Anthropological Sciences, 94, 5-18.
Bergh, G. D., Kaifu, Y., Kurniawan, I., Kono, R. T., Brumm, A., Setiyabudi, E., . . . Morwood, M. J. (2016). Homo floresiensis-like fossils from the early Middle Pleistocene of Flores. Nature,534(7606), 245-248. doi:10.1038/nature17999
Bromham, L., & Cardillo, M. (2007). Primates follow the ‘island rule’: implications for interpreting Homo floresiensis. Biology Letters,3(4), 398-400. doi:10.1098/rsbl.2007.0113
Evans AR, Jones D, Boyer AG, Brown JH, Costa DP, et al. (2012) The maximum rate of mammal evolution. Proc Natl Acad Sci USA 109: 4187–4190.
Falk, D., Hildebolt, C., Smith, K., Morwood, M. J., Sutikna, T., Jatmiko, … Prior, F. (2007). Brain shape in human microcephalics and Homo floresiensis. Proceedings of the National Academy of Sciences of the United States of America, 104(7), 2513–2518. http://doi.org/10.1073/pnas.0609185104
Falk, D., Hildebolt, C., Smith, K., Jungers, W., Larson, S., Morwood, M., . . . Prior, F. (2009). The type specimen (LB1) of Homo floresiensis did not have Laron Syndrome. American Journal of Physical Anthropology,140(1), 52-63. doi:10.1002/ajpa.21035
Fonseca-Azevedo, K., & Herculano-Houzel, S. (2012). Metabolic constraint imposes tradeoff between body size and number of brain neurons in human evolution. Proceedings of the National Academy of Sciences,109(45), 18571-18576. doi:10.1073/pnas.1206390109
Herculano-Houzel, S., & Kaas, J. H. (2011). Gorilla and Orangutan Brains Conform to the Primate Cellular Scaling Rules: Implications for Human Evolution. Brain, Behavior and Evolution, 77(1), 33–44. http://doi.org/10.1159/000322729
Kaifu, Y., Baba, H., Sutikna, T., Morwood, M. J., Kubo, D., Saptomo, E. W., . . . Djubiantono, T. (2011). Craniofacial morphology of Homo floresiensis: Description, taxonomic affinities, and evolutionary implication. Journal of Human Evolution,61(6), 644-682. doi:10.1016/j.jhevol.2011.08.008
Kubo, D., Kono, R. T., & Kaifu, Y. (2013). Brain size of Homo floresiensis and its evolutionary implications. Proceedings of the Royal Society B: Biological Sciences,280(1760), 20130338-20130338. doi:10.1098/rspb.2013.0338
Laron, Z., & Klinger, B. (1994). Laron Syndrome: Clinical Features, Molecular Pathology and Treatment. Hormone Research,42(4-5), 198-202. doi:10.1159/00018419
3
Lieberman, D. (2013). The Story of the human body – evolution, health and disease. Penguin.
Mcclain, C. R., Boyer, A. G., & Rosenberg, G. (2006). The island rule and the evolution of body size in the deep sea. Journal of Biogeography,33(9), 1578-1584. doi:10.1111/j.1365-2699.2006.01545.x
Vannucci, R. C., Barron, T. F., & Holloway, R. L. (2011). Craniometric ratios of microcephaly and LB1, Homo floresiensis, using MRI and endocasts. Proceedings of the National Academy of Sciences of the United States of America, 108(34), 14043–14048. http://doi.org/10.1073/pnas.1105585108
Welch, J. J. (2009). Testing the island rule: primates as a case study. Proceedings of the Royal Society B: Biological Sciences,276(1657), 675-682. doi:10.1098/rspb.2008.1180
Weston, E. M., & Lister, A. M. (2009). Insular dwarfism in hippos and a model for brain size reduction in Homo floresiensis. Nature, 459(7243), 85–88. http://doi.org/10.1038/nature07922
Race, Testosterone, and Honor Culture
2300 words
Misinformation about testosterone and strength in regards to race is rampant in the HBD-o-sphere. One of the most oft-repeated phrases is that “Blacks have higher levels of testosterone than whites”, even after controlling for numerous confounds. However, the people who believe this literally only cite one singular study with 50 blacks and 50 whites. Looking at more robust data with higher ns shows a completely different story. Tonight I will, again, go through the race/testosterone conundrum (again).
Type I fibers fire first when heavy lifting. Whites have more type I fibers. Powerlifters and Olympic lifters have a greater amount type IIa fibers, with fewer type IIx fibers (like whites). This explains why blacks are hardly represented in powerlifting and strongman competitions.
Somatype, too, also plays a role. Whites are more endo than blacks who are more meso. Endomorphic individuals are stronger, on average, than mesomorphic and ectomorphic individuals.
Blacks have narrower hips and pelves. This morphological trait further explains why blacks dominate sports. Some people may attempt to pick out one variable that I speak about (fiber type, morphology, somatype, fat mass, etc) and attempt to disprove it, thinking that disproving that variable will discredit my whole argument. However, fiber typing is set by the second trimester, with no change in fiber type from age 6 to adulthood (Bell et al, 1980).
It is commonly believed that blacks have higher levels of testosterone than whites. However, this claim is literally based off of one study (Ross et al, 1986) when other studies have shown low to no difference in T levels (Richards et al, 1992; Gapstur et al, 2002; Rohrmann et al, 2007; Mazur, 2009; Lopez et al, 2013; Richard et al 2014). People who still push the “blacks-have-higher-T-card” in the face of this evidence are, clearly, ideologues who want to cushion their beliefs when presented with contradictory evidence (Nyhan and Reifler, 2010).
‘Honor Culture’ and testosterone
In all of my articles on this subject, I have stated—extensively—that testosterone is mediated by the environment. That is, certain social situations can increase testosterone. This is a viewpoint that I’ve emphatically stated. I came across a paper while back that talks about a sociological perspective (I have huge problems with social ‘science’, [more on that soon] but this study was very well done) in regards to the testosterone difference between blacks and whites.
Some people when they read this, however, may go immediately to the part of the paper that says what they want it to say without fully assessing the paper. In this section, I will explain the paper and how it confirms my assertions/arguments.
Mazur (2016) begins the paper talking about ‘honor culture‘, which is a culture where people avoid intentionally offending others while also maintaining a status for not backing down from a confrontation. This theory was proposed by Richard Nisbett in 1993 to explain why the South had higher rates of violence—particularly the Scotch-Irish.
However parsimonious the theory may sound, despite its outstanding explanatory power, it doesn’t hold while analyzing white male homicides in the South. It also doesn’t hold analyzing within-county homicide rates either, since apparently poverty better explains higher homicide rates.
But let’s assume it’s true for blacks. Let’s assume the contention to be true that there is an ‘honor culture’ that people take part in.
Young black men with no education had higher levels of testosterone than educated whites and blacks. Looking at this at face value—literally going right to the section of the paper that says that poor blacks had higher testosterone, nearly 100 ng/ml higher than the mean testosterone of whites. As Mazur (2016) notes, this contradicts his earlier 2009 study in which he found no difference in testosterone between the races.
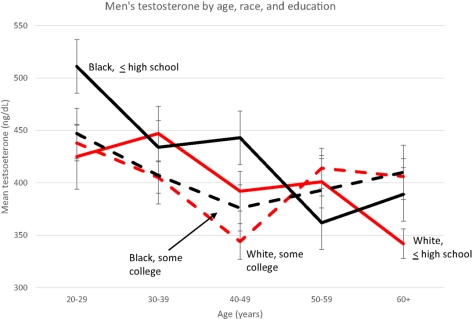
Note the low testosterone for both races at age 20-29—ranging from about 515 to 425—why such low testosterone levels for young men? Anyway, the cause for the higher levels is due to the type of honor culture that blacks participate in, according to Mazur (which is consistent with the data showing that testosterone rises during conflict/aggressive situations).
Mazur cites Elijah Anderson, saying that most youths have a “code of the streets” they take part in, which have to do with interpersonal communication such as “gait and verbal expressions” to deter aggressive behavior.
Testosterone is not a causal variable in regards to violent behavior. But it does rise during conflicts with others, watching a favorite sports team, asserting dominance, and even how you carry yourself (especially your posture). Since low-class blacks participate in these types of behaviors, then they would have higher levels of testosterone due to needing to “keep their status.”
When testosterone rises in these situations, it increases the response threat in mens’ brains, most notably showing increased activity in the amygdala. Further, dominant behavior and posture also increase testosterone levels. Putting this all together, since blacks with only a high school education have higher testosterone levels and are more likely to participate in honor culture compared to whites and blacks with higher educational achievement, then they would have higher testosterone levels than whites and blacks with a high school education who do not participate in honor culture.
Further, as contrary to what I have written in the past (and have since rescinded), there is no indication of higher testosterone levels in black women with low education. It seems this ‘honor culture’ effect on testosterone only holds for black men with only a high school education.
Mazur’s (2016) most significant finding was that black men aged 20-29 with only a high school education had 91 ng/ml higher testosterone than whites. Among older and/or educated men, testosterone did not vary. This indicates that since they have attained higher levels of educational success, there is no need to participate in ‘honor culture’.
This is yet further evidence for my assertion that environmental variables such as posture, dominance, and aggressive behavior raise testosterone levels.
The honor culture hypothesis is found to hold in Brazil in a comparative study of 160 inmates and non-inmates (De Souza et al, 2016). As Mazur (2016) notes, the honor culture hypothesis could explain the high murder rate for black Americans—the need to ‘keep their status’. It’s important to note that this increase in testosterone was not noticed in teenage or female blacks (because they don’t participate in honor culture).
There is a perfectly good environmental—not genetic—reason for this increase in testosterone in young blacks with only a high school education. Now that we know this, back to race and strength.
Mazur (2009) found that black men in the age range of 20-69, they averaged .39 ng/ml higher testosterone than whites, which is partly explained by lower marriage rates and low adiposity. White men are more likely to be obese than black men, since black men with more African ancestry are less likely to be obese. When controlling for BMI, blacks are found to have 2.5-4.9 percent more testosterone than whites (Gapstur et al, 2002, Rohrmann et al, 2007, Richard et al, 2014). There is little evidence for the assertion that blacks have higher levels of testosterone without environmental triggers.
Blacks between the age of 12 and 15 average lower levels of testosterone than whites. However, after the age of 15, “testosterone levels increase rapidly” with blacks having higher peak levels than whites (seen in table 2 below). After adjusting for the usual confounds (BMI, smoking, age, physical activity, and waist circumference), blacks still had higher levels of testosterone—which is attributed to higher levels of lean mass.
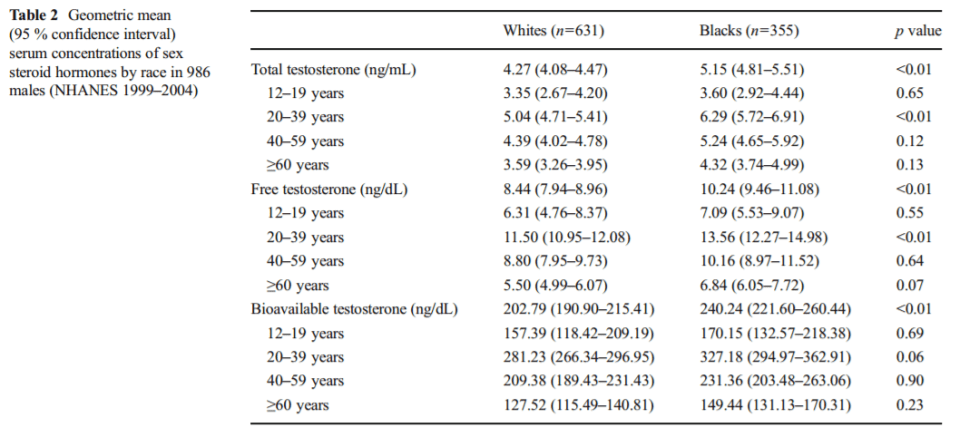
As seen above in table 2 from Hu et al (2014), the difference in total testosterone between blacks and whites aged 20-39 was 6.29 ng/ml and 5.04 ng/ml respectively, with free testosterone for whites being 11.50 and 13.56 for blacks and finally bioavailable testosterone for whites and blacks aged 20-39 was 281.23 and 327.18 ng/ml respectively. These small differences in testosterone cannot account for racial disparities in violence nor prostate cancer—since there is no relationship between prostate cancer and testosterone (Stattin et al, 2003; Michaud, Billups, and Partin, 2015).
In regards to Africans, the best studies I can find comparing some African countries with the West study salivary testosterone. However, there is a direct correlation between salivary testosterone and free serum testosterone (Wang et al, 1981; Johnson, Joplin, and Burrin, 1987). Of the studies I could find, Kenyan pastoralists called the Ariaal have lower levels of testosterone than Western men (Campbell, O’Rourke, and Lipson, 2003; Campbell, Gray, and Ellison, 2006) while men in Zimbabwe had levels “much lower” compared to Western populations (Lukas, Campbell, and Ellison, 2004). Lastly, among men aged 15 to 30, salivary testosterone levels in an American sample was 335 pmol//l compared to 286 pmol/l in men from the Congo (Elisson et al, 2002). Even certain African populations don’t have higher testosterone levels than Western peoples.
Conclusion
The meme that blacks have higher rates of testosterone in comparison to whites needs to be put to rest. This is only seen in blacks who participate in ‘honor culture’, which is an environmental variable. This is in contrast to people who believe that it is genetic in nature—environmental variables can and do drive hormones. Mazur (2016) is proof of that. Mazur (2016) also shows that the honor culture hypothesis doesn’t hold for teens or black males—so they don’t have elevated levels of testosterone. Certain studies of African populations, however, do not show higher levels of testosterone than Western populations.
Looking at the complete literature—rather than a select few studies— we can see that testosterone levels between white and black Americans are not as high as is commonly stated (Richards et al, 1992; Gapstur et al, 2002; Rohrmann et al, 2007; Mazur, 2009; Lopez et al, 2013; Hu et al, 2014; Richard et al, 2014). Further, even if blacks did have higher levels of testosterone than whites—across the board (sans honor culture), it still wouldn’t explain higher rates of black violence when compared to whites, nor would it explain higher prostate cancer rates (Stattin et al, 2003; Michaud, Billups, and Partin, 2015).
Only blacks with low educational achievement have higher levels of testosterone—which, even then is not enough to explain higher rates of violence or prostate cancer acquisition. Other factors explain the higher murder rate (i.e., honor culture, which increases testosterone, the environmental trigger matters first and foremost) and violent crime that blacks commit. But attempting to explain it with 30-year-old studies (Ross et al, 1986) and studies that show that environmental factors increase testosterone (Mazur, 2016) don’t lend credence to that hypothesis.
References
Bell, R. D., Macdougall, J. D., Billeter, R., & Howald, H. (1980). Muscle fiber types and morphometric analysis of skeletal muscle in six-year-old children. Medicine & Science in Sports & Exercise,12(1). doi:10.1249/00005768-198021000-00007
Campbell, B., O’rourke, M. T., & Lipson, S. F. (2003). Salivary testosterone and body composition among Ariaal males. American Journal of Human Biology,15(5), 697-708. doi:10.1002/ajhb.10203
Campbell, B. C., Gray, P. B., & Ellison, P. T. (2006). Age-related patterns of body composition and salivary testosterone among Ariaal men of Northern Kenya. Aging Clinical and Experimental Research,18(6), 470-476. doi:10.1007/bf03324846
De Souza, Souza, B. C., Bilsky, W., & Roazzi, A. (2016). The culture of honor as the best explanation for the high rates of criminal homicide in Pernambuco: A comparative study with 160 convicts and non-convicts. Anuario de Psicología Jurídica,26(1), 114-121. doi:10.1016/j.apj.2015.03.001
Ellison, P. T., Bribiescas, R. G., Bentley, G. R., Campbell, B. C., Lipson, S. F., Panter-Brick, C., & Hill, K. (2002). Population variation in age-related decline in male salivary testosterone. Human Reproduction,17(12), 3251-3253. doi:10.1093/humrep/17.12.3251
, , , , , . Serum androgen concentrations in young men: a longitudinal analysis of associations with age, obesity, and race—the CARDIA male hormone study. Cancer Epidemiol Biomarkers Prev 2002; 11: 1041–7
Hu, H., Odedina, F. T., Reams, R. R., Lissaker, C. T., & Xu, X. (2014). Racial Differences in Age-Related Variations of Testosterone Levels Among US Males: Potential Implications for Prostate Cancer and Personalized Medication. Journal of Racial and Ethnic Health Disparities,2(1), 69-76. doi:10.1007/s40615-014-0049-8
Johnson, S. G., Joplin, G. F., & Burrin, J. M. (1987). Direct assay for testosterone in saliva: Relationship with a direct serum free testosterone assay. Clinica Chimica Acta,163(3), 309-318. doi:10.1016/0009-8981(87)90249-x
Lopez, D. S., Peskoe, S. B., Joshu, C. E., Dobs, A., Feinleib, M., Kanarek, N., . . . Platz, E. A. (2013). Racial/ethnic differences in serum sex steroid hormone concentrations in US adolescent males. Cancer Causes & Control,24(4), 817-826. doi:10.1007/s10552-013-0154-8
Lukas, W. D., Campbell, B. C., & Ellison, P. T. (2004). Testosterone, aging, and body composition in men from Harare, Zimbabwe. American Journal of Human Biology,16(6), 704-712. doi:10.1002/ajhb.20083
Mazur, A. (2009). The age-testosterone relationship in black, white, and Mexican-American men, and reasons for ethnic differences. The Aging Male,12(2-3), 66-76. doi:10.1080/13685530903071802
Mazur, A. (2016). Testosterone Is High among Young Black Men with Little Education. Frontiers in Sociology,1. doi:10.3389/fsoc.2016.00001
Michaud, J. E., Billups, K. L., & Partin, A. W. (2015). Testosterone and prostate cancer: an evidence-based review of pathogenesis and oncologic risk. Therapeutic Advances in Urology,7(6), 378-387. doi:10.1177/1756287215597633
Nyhan, B., & Reifler, J. (2010). When Corrections Fail: The Persistence of Political Misperceptions. Political Behavior,32(2), 303-330. doi:10.1007/s11109-010-9112-2
Richard, A., Rohrmann, S., Zhang, L., Eichholzer, M., Basaria, S., Selvin, E., . . . Platz, E. A. (2014). Racial variation in sex steroid hormone concentration in black and white men: a meta-analysis. Andrology,2(3), 428-435. doi:10.1111/j.2047-2927.2014.00206.x
Richards, R. J., Svec, F., Bao, W., Srinivasan, S. R., & Berenson, G. S. (1992). Steroid hormones during puberty: racial (black-white) differences in androstenedione and estradiol–the Bogalusa Heart Study. The Journal of Clinical Endocrinology & Metabolism,75(2), 624-631. doi:10.1210/jcem.75.2.1639961
Rohrmann, S., Nelson, W. G., Rifai, N., Brown, T. R., Dobs, A., Kanarek, N., . . . Platz, E. A. (2007). Serum Estrogen, But Not Testosterone, Levels Differ between Black and White Men in a Nationally Representative Sample of Americans. The Journal of Clinical Endocrinology & Metabolism,92(7), 2519-2525. doi:10.1210/jc.2007-0028
Ross R, Bernstein L, Judd H, Hanisch R, Pike M, Henderson B. Serum testosterone levels in healthy young black and white men. J Natl Cancer Inst. 1986 Jan;76(1):45–48
Stattin, P., Lumme, S., Tenkanen, L., Alfthan, H., Jellum, E., Hallmans, G., . . . Hakama, M. (2003). High levels of circulating testosterone are not associated with increased prostate cancer risk: A pooled prospective study. International Journal of Cancer,108(3), 418-424. doi:10.1002/ijc.11572
Wang, C., Plymate, S., Nieschlag, E., & Paulsen, C. A. (1981). Salivary Testosterone in Men: Further Evidence of a Direct Correlation with Free Serum Testosterone. The Journal of Clinical Endocrinology & Metabolism,53(5), 1021-1024. doi:10.1210/jcem-53-5-1021
Evolution Denial Part II
1450 words
Why do people deny evolution? Not just evolution from single-celled organisms to multicellular lifeforms, but human evolution as well? Most people who deny evolution don’t have the knowledge to assess it correctly. They fall back on the Bible and say “God did this, the Bible says…. God says…” all the while looking at you as a heathen when you attempt to talk some basic biology or, God forbid, the process of evolution.
I met a woman the other day and I asked her what she was studying in school. She tells me anatomy and physiology (right up my alley). So we start talking about some basic anatomy and physiology before I ask the question: “Do you believe in evolution?” She gave me a blank stare and said no.
“Humans as we know them have always existed in this form,” she said. I just started laughing at her ignorance and then she said “Evolution at the macro level is not possible but it is at the micro level”, repeating the same old and tired Creationist talking points. I said to her that there is no evidence for creation and that the evidence we do have points to evolution. I said that the theory of evolution has so much backing, so much evidence, that to believe otherwise you’d have to purposefully close your mind to the truth, to shut out any and all contradictory information.
One of the funniest things she said to me was that she wants to cure diseases. To that, I said if she wants to do that then she must look at diseases from an evolutionary perspective (Gluckman et al, 2011). She said that she doesn’t need to know how diseases were in the past, just how they are today. I also said that if she is studying anatomy and physiology then she must understand that many of our appendages are derived from our hominin ancestors, which began with Erectus as I’ve covered in my article Man the Athlete. Diseases also must be looked at through an evolutionary lens, so if anyone wants to cure diseases, then they must first understand and accept that things are constantly changing and evolving to better survive in that environment.
When I said that there is no evidence for Creation she got really mad. She said that there is no evidence that “we evolved from monkeys” which gave me a good laugh. Even people who believe in evolution still make that mistake of believing that we evolved from monkeys. One of the most common statements from Creationists is “If humans evolved from monkeys then why are monkeys still around?”, wrongly assuming that we literally evolved from monkeys, incorrectly misinterpreting that we share a common ancestor with monkeys 6-12 mya.
About 6mya, there was a chromosomal fusion on chromosome two; two ancestral ape chromosomes fused to make chromosome two (Idjo et al, 1991). That is some nice chromosomal evidence for common descent from our ape cousins. Creationists, however, purport that a gene in chromosome 2, DDX11L2, writing that the “alleged fusion site is not a degenerate fusion sequence but is and, since creation, has been a functional feature in an important gene.” Further, Tomkins’ claim that the fusion site is actually a gene is wrong since the fusion site is more than 1300 bases away from the gene.
The ancestral equivalents of chromosome 2—2p and 2q—fused together in a fusion event some 6mya. This precise fusion site is on chromosome 2 (Hellier et al, 2004). Creationists will say and do anything to attempt to ‘rebut’ this contention. Genetic evidence is the best evidence we have (due to Punctuated Equilibria, which causes the spottiness in the fossil record), and still, these ‘Creationist geneticists’ will do anything they can to attempt to have Evolutionists go on the defensive. However, the onus is on them to disprove the mountains of evidence.
One of the funniest things this woman said to me is that man has always been in this form and that we didn’t evolve from “monkeys”, which is when I said that it’s more complicated than that: we have fish ancestors, named Tiktaalik who had the beginnings of the human arm and hand, along with Pikaia Gracilens—our oldest ancestor. If Pikaia would have died out in the Cambrian explosion some 550 mya, we wouldn’t be here today. We are here today due to the happenstance of numerous accidents of history—contingencies of “just history” to quote Stephen Jay Gould.
Nevertheless, Creationists will always attempt to distort evolutionary science to fit their agendas. Stephen Jay Gould battled Creationists throughout his career. Creationists would quote mine his books to show that Evolutionists do show evidence of “Creation”. One of his most quote mined works is his and Eldredge’s theory of Punctuated Equilibria (1972). Just because a look at the whole fossil record shows species remaining in stasis for most of their history before a short burst of evolutionary change then that must mean that there was a guiding hand involved in the process. Here is a full list of quote mines that Creationists use from Eldredge and Gould.
As you can see, Creationists use any kind of mental gymnastics to disprove evolution. However, no matter how hard you try with Creationists, you can’t educate people into believing in evolution. This is mainly due to the backfire effect which occurs when you show people contradictory information to a dearly held belief and they frantically attempt to gather evidence to shield themselves from contradictory evidence (Nyhan and Reifler, 2010). This cognitive bias holds for more than political debates, though it’s most often seen there. Showing people any kind of contradictory information will have them search and search for anything to shield themselves from the truth. However, no amount of ‘information’ provided by Creationists will disprove evolutionary theory.
Gould and Eldredge aren’t the only Evolutionist that Creationists quote mine–one of the most famous quote mines is from Darwin’s The Descent of Man in which he talks about defending his theory from detractors, mainly the spottiness of the fossil record (which Eldredge and Gould’s Punctuated Equilibria explains). However, this doesn’t stop Creationists—and even some Evolutionists who fall for Creationist trickery—to believe that Darwin was talking about something completely different, in that Darwin was ‘racist’ talking about the ‘superior races’ exterminating the ‘inferior races’. Reading the quote in its entirety, however, shows something completely different. Alas, some people don’t care about facts antruthut and only care about their agenda they attempt to push.
Even setting evolutionary theory aside, basic geology disproves Creationism. The author of the piece, geologist David Montgomery, says that there is a rock outside of his office that proves Creationism wrong. The rock shows that there is more to the geologic record that could be explained by a single grand flood. Now that geologists now have the tools and data to infer that the earth is billions of years old—not thousands as Young Earth Creationists (YECs) claim—YECs change up their interpretation of the Creation story in Genesis to go from literal days to “days in Genesis refer to geological ages”. Clear mental gymnastics in the face of contradictory evidence.
There are five mass extinctions that are accepted in the scientific community (Jablonski, 2001) (though I am reading a book at the moment that talks about nine mass extinction events with Man pushing the tenth, I will return to this in the future). After these contingencies of ‘just history’, we can see that we are incredibly lucky that our ancestors did not die out. From a Pikaia Gracilens surviving the Cambrian radiation, to Tiktaalik and its venturing onto land from the sea and finally the survival of a shrew-like ancestor during the extinction of the dinosaurs, we should thank our lucky stars that these things went our way, because if not, I wouldn’t be sitting here writing this at the moment and you would not be reading this. Evolutionary history is littered with these events—events that, if they went the other way would not lead to the evolution of Man again.
In sum, people who do not believe in evolutionary theory clearly are emotionally invested in believing in a story of Creation—sans evidence, only their belief. On the other hand, evolutionists such as we have all the data on our side when it comes to this debate. Creationists have to use any kind of warped logic to not believe the mountains of evidence that have piled up since Darwin wrote On the Origin. However, as everyone knows, reality isn’t what just what you believe. Just because Creationists handwave away the data that people like us provide to them doesn’t mean that evolution isn’t true.
