
Home » Posts tagged 'Brain size' (Page 3)
Tag Archives: Brain size
Neanderthals, Inbreeding, r/K Selection Theory and Eurasian Birthrates
1100 words
(Note, 6/24/17: Rushton’s r/K selection in applications to human races is dead. It’s been dead for almost 30 years after and ecologist critiqued his method and use of ecological theory in application to human races. Now, that doesn’t meant that everything written below—or even on my whole blog—is fully wrong, just that the attempted explanation is wrong. It still holds that Eurasians have worse fitness than Africans, which is partly due to deleterious Neanderthal variants, however, r/K theory does not explain it.)
Science Daily reported last week that Neanderthals left humans a genetic burden, which is having less offspring. Of course, these deleterious alleles only introgressed into non-African populations due to Africans not leaving Africa. This manifests itself today in birth rates within countries and between them based on the ethnic/racial mix. And (not) coincidentally, the areas with the highest rate of children are in sub-Saharan Africa.
The Neanderthals existed in small bands, so inbreeding was common. Due to this inbreeding, Neanderthals were more homogenous than we are today. When humans migrated out of Africa, they encountered the inbred Neanderthals who they interbred with. Harmful genetic variants acquired from Neanderthals are shown to reduce the fitness of populations with certain deleterious alleles. There are of course tradeoffs with everything in life. Increased intelligence and being better able to weather the Ice Age, among numerous other factors, were positive things gained from interbreeding with Neanderthals. Negative effects were the acquisition of deleterious alleles which still persist today in non-African hominids. These deleterious alleles decreased biological fitness which manifests itself in the birthrate of Eurasian populations throughout the world (the Germann and Japanese birthrate is 1.3 for reference).
Harris and Nielson also hypothesize that since Neanderthals existed in small bands that natural selection was less effective, allowing for weakly harmful mutations to pass on and not get weeded out over the generations. However, when introduced back into humans these effects become lost over time due to a large population with natural selection selecting against the deleterious Neanderthal alleles. Using a computer program, Harris and Nielson quantify how much of a negative effect the Neanderthal genome had on modern populations. The conclusion of the results was that Neanderthals are 40 percent LESS genetically fit than modern humans.
The researchers’ simulations also suggest that humans and Neanderthals mated more freely, which leads more credence to the idea that Neanderthals got absorbed into the Homo Sapien population and not mostly killed off. The estimation for Neanderthal DNA in modern hominids from the simulation was around 10 percent, which then continued to drop as the Neanderthal-Homo Sapiens hybrids interbred with those who hardly had any Neanderthal DNA. More evidence also shows that the percentage of Neanderthal DNA was higher in the past in Eurasians as well. Which makes sense since Asians have on average 20 percent more Neanderthal DNA than Europeans due to a second interbreeding event.
However, Harris and Nielson end up concluding that non-Africans historically had a 1 percent loss in biological fitness due to Neanderthal genetics. Moreover, a better immune system came from Neanderthal genetics. Skin color is another trait inherited from Neanderthals as well.
Along with the acquisition of deleterious Neanderthal alleles, early Eurasians also encountered the same environment as the Neanderthals. Those selection pressures, along with interbreeding due to small bands lead to a decrease in the number of children had. Fewer children are easier to care for as well as show more attention to. All of these variables in that environment lead to fewer children produced. It’s a better evolutionary strategy to have fewer children in more northerly climes than in more southerly ones due to the differing selection pressures. Environmental effects are also one reason why birthrates are lower for populations that evolved in northerly climes (Neanderthals and post-OoA hominids). Harsh winters lead to a decreased population size, as evidenced by the Inuit and Eskimoes, which their low population size didn’t allow for selection for high IQ despite having the same brain size as East Asians.
I couldn’t help but think that, yet again, for the second time in two weeks, one of JP Rushton’s theories was confirmed. This confirms one of the many variables of Rushton’s r/K Selection Theory. Just like I covered how Piantadosi and Kidd corroborated Rushton’s theory of brain size and earlier child birth. Neanderthals had bigger brains than we do today, and knowing what we know about the correlation between IQ, brain size and early childbirth, I would assume that Neanderthals also had earlier childbirths as well,.
Along with these deleterious gene variants from Neanderthals, other variables that contribute to the decline in Eurasian populations also include higher IQ as well, as JP Rushton says, is an extreme way to have control over their environment and individuality. These traits are seen in higher IQ populations in comparison to lower IQ populations. We could also make the inference that since Eurasian children have bigger heads, that multiple childbirths would be taxing on the Eurasian woman’s birth canal while it would be less taxing on the African woman’s.
This study also shows that Neanderthals also had less offspring due to being more intelligent. They had bigger brains than we do today, and since we know that higher IQ is correlated with fewer children conceived, we can say that they were pretty damn smart (they buried their dead 50,000 years ago. There was also a recent discovery of a 176,500-year-old Neanderthal constructions in a French cave). A main cause for the current trend in birthrates in Eurasian populations is due interbreeding with Neanderthals. These events also attributed more to the decline of the Neanderthals.
Deleterious Neanderthal alleles are yet another reason for lower Eurasian birthrates, which shows = that the current trend currently happening in the world with these populations is natural and evolutionarily based. I’ve said a few times that by showing positive things to women on television will increase the white birth rate, with Rushton cites National Socialist Germany as one example. By showing women happy with children, this lead to a massive boom in the German population. To ameliorate the effects of low natural birth rates, these positive things need to be shown on television to women to start to reverse the effects of low natural childbirths.
It’s been a great month for Rushton’s theories, with two of them being corroborated in one month. It’s only a matter of time before the denial of human nature is completely discarded from modern science. As the data piles up on human genetic diversity we will not be able to deny these clearly evident factors any longer.
Individual and Racial Differences in IQ and Allele Frequencies
1300 words
In the past 100 years since the inception of the IQ test there have been racial differences in test scores. What causes these score differences? Genetics? Environment? Both? Recently it has come out that populations do differ in allele frequencies that affect intelligence. David Piffer’s “forbidden paper on population genetics and IQ” was rejected by the new editor of the journal Intelligence. In the paper, he shows how IQ alleles vary in frequency by population. One reviewer even said it should not be put up for review, which Piffer believes there was a hidden agenda or a closed minded attitude. He even puts reviewers comments and responds to them. He says science should be transparent, which is why he’s showing the researchers’ comments on his paper.
His December, 2015 paper titled: A review of intelligence GWAS hits: Their relationship to country IQ and the issue of spatial autocorrelation shows that there are differing allele frequencies in which IQ between populations that affect IQ which are then correlated highly with average IQ by country (r=.92, factor analysis showed a correlation of .86). There was also a “positive and significant correlation between the 9 SNPs metagene and IQ”(pg. 45). However, Piffer does conclude that since the 9 alleles are present within all populations (Africans, Latin Americans, Europeans, South Asians, and East Asians) that the intelligence polymorphisms don’t appear to be race-specific, but were already present in Homo Sapiens before the migration out of Africa. He then goes on to say that it’s extremely likely that the vast majority of alleles were subject do differential selection pressure which lead increases in cognitive abilities at different rates rates in different geographical areas (pg. 49). It’s of course known that differing populations faced differing selection pressures which then lead to genotypic changes which then affected the phenotype. It’s not surprising that genes that correlate strongly with intelligence have differing frequencies in different geographical populations; it’s to be expected with what we know about evolution and natural selection. Below is the scatter plot showing the relationship between polygenic score GWAS (Genome Wide Association Studies) hits and IQ:

The fact that these differences exist should not come as a shock to those who want to seek the truth, but as seen with how David Piffer didn’t even get consideration for a revision, this shows the bias in science to studies such as this that show racial differences in intelligence exist.
Piffer’s data also corroborates Lynn and Meisenberg’s (2010) finding of a correlation of .907 with measured and estimated IQ. This shows that the differing allele frequencies affect IQ, which then affect a countries GDP, GNP, and over all quality of life.
With a sample with a huge n (over 100,000 subjects) cognitive abilities tests were performed on verbal-numerical reasoning, memory and reaction time (a huge correlate for IQ itself, see Rushton and Jensen, 2005). Davies et al (2016) discovered that there were significant genome-wide SNP based associations in 20 genomic regions, with significant gene-based regions on 46 loci!! Once we find definitive proof that intelligence differences vary between individuals, as well as the loci and genomic regions responsible, we can then move on to difference in allele frequency in depth (which Piffer 2015 was one of the starts to this project).
Moreover, genes that influence intelligence determine how well axons are encased in myelin, which is the fatty insulation that coats our axons, allowing for fast signaling to the brain. Thicker myelin also means faster nerve impulses. The researchers used HARDI to measure water diffusion in the brain. If the water diffuses rapidly in one direction, that shows the brain has very fast connections. Whereas a more broad diffusion would indicate slower signaling, thus lower intelligence. It basically gives us a picture of an individuals mental speed. Thinking of reaction time tests where Asians beat whites who beat blacks, this could possibly show how differing process times between populations manifest itself in reaction time. Since myelin is correlated with fast connections, we can make the inference that Asians have more than whites who have more than blacks, on average. The researchers also say that it’s a long time from now, but we may be able to increase intelligence by manipulating the genes responsible for myelin. This leads me to believe that there must be racial differences in myelin as well, following Rushton’s Rule of Three.
Since the mother’s IQ is the best predictor of the child’s IQ, this should really end the debate on its own. Sure on average, intelligent black mothers would birth intelligent children, but due to regression to the mean, the children would be less intelligent than the mother. JP Rushton also says that regression works in the opposite way. Both blacks and whites who fall below their racial means will have children who regress to the means of 85 and 100 respectively, showing the reality of the genetic mean in IQ between the races.
Why would differing allele frequencies lead to the same cognitive processes in the brain in genetically isolated populations? I’ve shown that brain circuits vary by IQ genes, and populations do differ in this aspect, like all other differing genotypic/phenotypic traits.
East Asians have bigger brains, as shown by MRI studies. Rushton and Rushton (2001) showed that the three races differ in IQ, brain size, and 37 different musculoskeletal traits. We know that West Africans and West African-descended people have genes for fast twitch muscle fibers (Type II) (Nielson and Christenson, 2001). Europeans and East Asians have slow twitch muscle fibers (Type I) for strength and endurance. (East Africans have this as well, which allows for ability to run for distance, which fast twitch fibers do not allow for. The same is true for slow twitch fibers and sprinting events.) Bengt Saltin showed that European distance runners have up to 90 percent slow twitch fibers (see Entine, 2000)! So are genetic IQ differentials really that hard to believe? With all of these differing variables in regards to intelligence that all point to a strong genetic cause for individual differences in other genes that lead to stark phenotypic differences between the races, is it really not plausible that populations differ in intelligence, which is largely inherited?
Is it really plausible that differing populations would be the same cognitvely? That they would have the same capacity for intelligence? Even when evolution occurred in differing climates? The races/ethnicities differ on so many different variables with differing genes being responsible for it. Would IQ genes really be out of the question? Evolution didn’t stop from the neck up. Different populations faced different selection pressures, so different human traits then evolved for better adaption in that environment. Different traits clearly developed in genetically isolated populations that had no gene flow with each other for tens of thousands of years. These differing evolutionary environments for the races put different pressures on them, selecting some for high IQ alleles and others for low IQ alleles.
We are coming to a time where intelligence differences between populations will become an irrefutable fact. With better technology to see how differing genes or sets of genes affect our mind as well as physiology, we will see that most all human differences will come down to differing allele frequencies along with differing gene expression. Following Rushton’s simple rule based on over 60 variables, East Asians will have the most high IQ alleles followed by Europeans and then blacks. The whole battery of different cognitive abilities tests that have been conducted over the past 100 years show us that there are differences, yet we haven’t been able to fully explain it by GWAS and other similar techniques. Charles Murray says within the next 5 to 10 years we will have definitive proof that IQ genes exist. After that, it’s only a matter of time before it comes out that racial differences in IQ are due to differing allele frequency as well as gene expression.
More g Denialism and more Gould Refuting
1750 words
It seems like every day something new comes out that attempts to discredit the reality of g (This paper came out in 2012.). Steven Jay Gould (in)famously wrote in The Mismeasure of Man:
The argument begins with one of the fallacies—reification, or our tendency to convert abstract concepts into entities (from the Latin res, or thing). We recognize the importance of mentality in our lives and wish to characterize it, in part so that we can make the divisions and distinctions among people that our cultural and political systems dictate. We therefore give the word “intelligence” to this wondrously complex and multifaceted set of human capabilities. (emphasis mine)
Which is the same thing that the researchers of the paper Fractioning Human Intelligence said to The Independent:
“The results disprove once and for all the idea that a single measure of intelligence, such as IQ, is enough to capture all of the differences in cognitive ability that we see between people,”
“Instead, several different circuits contribute to intelligence, each with its own unique capacity. A person may well be good in one of these areas, but they are just as likely to be bad in the other two,”
Just like The Mismeasure of Man is “the definitive refutation to the argument of The Bell Curve”, right?
In the above paper, they cite Gould twice writing:
It remains unclear, however, whether population differences in intelligence test scores are driven by heritable factors or by other correlated demographic variables such as socioeconomic status, education level, and motivation (Gould, 1981; . . .
They have been shown over numerous studies that population differences in intelligence are driven by heritable factors (Rushton and Jensen, 2005; Lynn and Vanhanen, 2006; Winick, Meyer, and Harris, 1975; Frydman and Lynn, 1988; Rushton, 2005)
More relevantly, it is questionable whether they relate to a unitary intelligence factor, as opposed to a bias in testing paradigms toward particular components of a more complex intelligence construct (Gould, 1981;
I will prove the existence of g in this article. There is also an empirical basis for the g factor.
It’s getting old now that researchers still think that they can “disprove g”, as a multitude of studies have already corroborated Spearman’s hypothesis as an empirical fact. That is, applying the scientific method, using the same hypothesis over a multitude of different studies and testing those predictions by experiment or further observation and modify the hypothesis when new information comes to light. Then, repeat the aforementioned steps until there are no discrepancies between the theory and experiment/observations.Then when consistency is obtained it then becomes a theory that provides a coherent set of premises that explain a class of events.
How many times has the Hampshire et al hypothesis been corroborated? I doubt it has been corroborated as many times as Spearman’s hypothesis has.
As I said the other day, Jensen tested Spearman’s hypothesis on 25 large independent samples, with each sample confirming Spearman’s hypothesis. Even matching blacks and whites for SES didn’t diminish the effect. Jensen then concludes that the overall chance for Spearman’s hypothesis being wrong is over 1 in a billion. Pretty high odds.
Even then, if this study were to be replicated the amount of times that Spearman’s hypothesis has, it still wouldn’t disprove g.
On page 558-559 of the Afterword to The Bell Curve, Charles Murray responds to many of Gould’s criticisms of the book. He writes:
He (Gould) continues: “The fact that Herrnstein and Murray barely mention the factor-analytic argument forms a central indictment around The Bell Curve and is an illustration of its vacuousness.” Where, Gould asks, is the evidence that g “captures a real property in the head?
Murray states that they “barely brought up the factor-analytical argument” because it was out of date; Gould was using statistics on g that were 50 + years old. Also, a reviewer of his book for the journal Nature said that Gould’s “discussion of the theory of intelligence stops at the stage it was more than a quarter of a century ago.” Gould was using old arguments, and, as Arthur Jensen states in his response to Gould:
Of all the book’s references, a full 27 percent precede 1900. Another 44 percent fall between 1900 and 1950 (60 percent of those are before 1925); and only 29 percent are more recent than 1950.
More than half of Gould’s references in The Mismeasure of Man are outdated by more than 50 years. Clearly, he was attempting to denigrate the old studies of intelligence, i.e., phrenology, even though this recent paper in the journal Nature recently said:
The genomic regions identified include several novel loci, some of which have been associated with intracranial volume
So, we have several loci that are associated with intracranial volume; this shows that those skull studies of yesteryear weren’t crazy. Moreover, the fact that Rushton and Ankney (1996) “reviewed 32 studies correlating measures of external head size with IQ scores or with measures of educational and occupational achievement, and they found a mean r .20 for people of all ages, both sexes, and various ethnic backgrounds, including African Americans” shows that there is a correlation of .20, albeit not too high but there, with external head size and IQ. This shows that Gould’s argument on phrenology is bunk, as modern studies confirm that there is a slight correlation between head size and IQ, and therefore g.
The fact that researchers are still bringing up Gould’s arguments on g show that there really is no good argument to discount it. Basically, any and all arguments that attempt to discredit g are bunk as Spearman’s hypothesis has been empirically verified:
Conclusion: Mean group differences in scores on cognitive-loaded instruments are well documented over time and around the world. A meta-analytic test of Spearman’s hypothesis was carried out. Mean differences in intelligence between groups can be largely explained by cognitive complexity and the present study shows clearly that there is simply no support for cultural bias as an explanation of these group differences. Comparing groups, whether in the US or in Europe, produced highly similar outcomes.
Along with Jensen’s 25 large independent studies that showed that the probability that Spearman’s hypothesis is false is 1 in a billion, this proves that Spearman’s hypothesis is an empirical scientific fact.
Newman and Just, (2005) state in verbal and spatial conditions that the frontal cortex revealed greater activation for high-g in comparison to low-g, supporting the idea that g reflects functions of the frontal lobe. The “seat” of general intelligence is the prefrontal cortex (Cole, et al, 2011, Roth, 2011). This can also be verified with MRI scans that show that those who have higher g have bigger prefrontal cortexes than those with lower g.
Moreover, the fact that Colom, et al (2006) show that in their sample that neuroanatomic areas underlying the g factor could be found across the entire brain including the frontal, parietal, temporal and occipital lobes, shows that this factor is present throughout the brain and all are correlated with g and work together in concert to manifest intellectual ability.
Other researchers have also used the method of correlated vectors on functional Magnetic Resonance Imaging (fMRI), which measures brain activity by detecting changes associated with blood flow. This technique is proven useful due to the fact that cerebral blood flow and neuronal action are correlated. Lee, et al write:
In conclusion, we suggest that higher order cognitive functions, such as general intelligence, may be processed by the coordinated ability may be attributable to the functional facilitation rather than the structural peculiarity of the neural network for g. In addition, our results demonstrated that the posterior parietal regions including bilateral SPL and right IPS could be the neural correlates for superior general intelligence. These findings would be the early step toward the development of biological measures of g which leads to new perspectives for behavior interventions improving general cognitive ability.
They also used the MCV to find that the frontal and parietal lobes are associated with g. Even these studies show that g shows up throughout the brain and not in one solitary spot (though, the PFC is still the seat of intelligence), this shows yet another biological basis for g.
Hampshire, et al write:
Thus, these results provide strong evidence that human intelligence is a construct that emerges from the functioning of anatomically dissociable brain networks.
However, with the above studies confirming that the seat of intelligence is the prefrontal cortex, along with great g ability possibly be attributable to the functional facilitation rather than the structural peculiarity of the neural network for g, this shows, along with the study proving Spearman’s hypothesis, that g is a real and measurable thing. g’s seat is the prefrontal cortex, and exceptional g may possibly be attributed to the functional facilitation of the neural network for g . What all of these studies show is that all though the Hampshire paper showed how they “demonstrate that different components of intelligence have their analogs in distinct brain networks.” that a) higher order cognitive functions may be processed by the coordinated activation of widely distributed brain areas (disproving the above quote), b) the seat of g is the prefrontal cortex, c) those with more g have bigger prefrontal cortexes and therefore bigger brains since the prefrontal cortex is the ‘seat’ of intelligence and d) Spearman’s hypothesis has been corroborated numerous times by many different researchers not named Arthur Jensen.
Highfield (one of the researchers in the study) ends the article as follows:
“We already know that, from a scientific point of view, the notion of race is meaningless. Genetic differences do not map on to traditional measurements of skin colour, hair type, body proportions and skull measurements.
This is something that never ends; it always comes up no matter how many times it’s been said. People can say “race is a social construct” all they want, it doesn’t make it true as there is a biological reality to race.
Now we have shown that IQ is meaningless too,” Dr Highfield said.
IQ is not biased, nor is it “meaningless“.
When will people learn not to cite men who have smeared their legacy in an attempt to defame men who they disagreed with ideologically? Citing Steven Jay Gould in 2016 shows a bias to want to discredit g as a main factor for many things in life including SES, educational attainment, wealth attainment and so forth. The g factor is a measurable thing, with the seat of the factor being the prefrontal cortex. No amount of attempting to dispute this factor can be done, as it’s been empirically verified numerous times.

There Is Such a Thing As a “Male” and “Female” Brain
2100 words
Towards the end of last year, it was said that “male and female brains don’t differ“. Male and female brains differ from the number of neurons to differences in g that affect intelligence, to differences in temperament and differences in the hormones testosterone and estrogen. Other than accounting for differences in physical appearance between the sexes, the differences between the sexes in the two hormones accounts for brain differences as well. This is yet another blank slate argument, years after cognitive neuroscience affirmed that behavior is rooted in the brain and that we are not in fact “blank slates”, these same old and outdated arguments keep being pushed, of course, in part due to the growing number of “transgenders” and an influx of non-western people who are abnormal to our societies. This attempt to have the general public to believe that we have minds of Silly Puddy (to borrow a phrase from Steven Pinker) is an attempt to have us accept all of the things that get pushed on us through the media.
You may have read that having a male brain will earn you more money.
Men do make more money than women, and this isn’t the cause of the imaginary gender pay gap. Even Thomas Sowell, the liberal icon has refuted this myth. Men make more money than women due to, which I will get to below, higher intelligence.
Or maybe that female brains are better at multitasking.
Anecdotal evidence suggests it. Evolutionary evidence suggests it. Studies suggest it. But ever since the Jewish feminist push in the 20th century, this strive for egalitarianism between the sexes became mainstream, which helps to still keep the notion of “blank slatism” alive.
The idea that people have either a “female” or “male” brain is an old one, says Daphna Joel at Tel Aviv University in Israel. “The theory goes that once a fetus develops testicles, they secrete testosterone which masculinises the brain,” she says. “If that were true, there would be two types of brain.”
Anyone else surprised that someone from Tel Aviv University is making these claims? Are we supposed to believe that testosterone doesn’t affect the brain? Are we supposed to believe that higher testosterone, higher estrogen and other biologic differences in brain structure don’t account for behavioral differences between the sexes?
We have data that this is the case, though:
Sex steroid hormones exert a profound influence on the sexual differentiation and function of the neural circuits that mediate dimorphic behaviors. Both estrogen and testosterone are essential for male typical behaviors in many species. Recent studies with genetically modified mice provide important new insights into the logic whereby these two hormones coordinate the display of sexually dimorphic behaviors: estrogen sets up the masculine repertoire of sexual and territorial behaviors, and testosterone controls the extent of these male displays.
Control of masculinization of the brain and behavior (Wu and Shah, 2010)
To believe that testosterone doesn’t cause masculinization of the brain will have to have one deny all of the literature out there. Why people believe that sex differences, as well as racial/ethnic differences, are rooted in experience and not biology is truly mind boggling.
“There are not two types of brain”
And below this, they basically say that the “gender fluid” phenomenon is ‘ok’. Differences between individual boys and girls and individual men and women are extremely evident just by casual observation, so to attempt to say that individual brains cannot be shown to have full-on male or female characteristics is insincere. The fact that, as shown above, testosterone mediates the masculinization of the brain, we can see that these differences in brain structure do exist, and are accounted for by exposure to testosterone invitro, which then cause the differences in the brains of men and women.
Although the team only looked at brain structure, and not function, their findings suggest that we all lie along a continuum of what are traditionally viewed as male and female characteristics. “The study is very helpful in providing biological support for something that we’ve known for some time – that gender isn’t binary,” says Meg John Barker, a psychologist at the Open University in Milton Keynes, UK.
Gender is binary. Female and male characteristics do exist. Males and females differ in certain structures of the brain as seen in a study reviewing over 20 years of the study of sex differences in the brain.
“Across all kinds of spatial skills, we find very, very few that are sensitive to sex,” says Hausmann. “We have also identified spatial problems where women outperform men – the black-and-white idea of a male or female brain is clearly too simple.”
The sex differences on spatial skills tests are rooted in brain structure. Researchers measured a 10 percent difference between men and women in overall amount of parietal lobe surface area. Since how we process information is obviously a result of cognitive processes in the mind, differences between the sexes in brain structure show how men and women can differ in certain cognitive tasks. Of course, some spatial problems can be women can outperform men on some spatial tasks, no one disputes that. However, what the average battery of tests shows is that men have higher visio-spatial intelligence than men.
Alexandra Kautzky-Willer, head of the Gender Medicine Unit at the Medical University of Vienna in Austria, agrees that things aren’t so simple. “There are differences between men and women when you look in large groups, and these are important for diagnosis and treatment,” she says. “But there are always more differences within genders. We always need to look at culture, environment, education and a person’s role in society,” she says.
Just like there “is more difference within race than between them”, right? Culture is a product of genetics and IQ, we put ourselves into certain environments based on our genes, education is largely heritable, a person’s worth to society is based on IQ and the Big Five personality traits, which are at least 50 percent heritable, all of which are rooted in brain processes.. Those factors don’t prove that there are no differences between the brains of the sexes because all of them can be explained, in part due to genetic factors.
These findings, they claim, say that it’s impossible to say what features a person’s brain will have based on the known sex of the brain. With differences in gray matter, brain size and other regions in the brain, we can definitively say whether or not the brain is male or female. Sure some outliers will occur, but the overall bulk, we would see that the sex would be guessed with a super majority being correct.
Joel envisions a future in which individuals are not so routinely classified based on gender alone. “We separate girls and boys, men and women all the time,” she says. “It’s wrong, not just politically, but scientifically – everyone is different.”
Here we are with the point of this article: to attempt to normalize this trend of degenerate behavior that the media pushes which begins to permeate our society. Chromosomal differences between men and women show the sex differences. X means woman, Y means man. Some may point to some anomalies, but anomalies occur in nature all the time and are not a representative of the population.
This also shows with differences in brain size, that causes a difference in IQ between men and women. The study found that men had brains that were, on average, 8 to 13 percent larger than women’s. Since we know that the IQ/brain size correlation is .35, more often than not, men will have higher IQs than women due to having slightly larger brains. And the data is consistent with the finding that men and women have slightly differing IQ scores, which shows in the difference in average brain volume between men and women.
In JP Rushton’s refutation to Steven Jay Gould’s revised edition of The Mismeasure of Man, he states that Gould claims that when accounting for body size and age that the difference in brain size drops from 182 grams to 113 grams, then invokes unspecified age and body size parameters and that accounting for these differences then the sex difference in brain size will vanish. Ankney (1992) reexamined the autopsy data of Ho et al (1980) and found that uncorrected for body size, the difference between men and women’s brains was 140 grams; After correcting for body size, the difference between men and women was 100 grams. This shows that around 30 percent of the difference between men and women in brain size is attributed to body size.
In this review, Rushton did state that men and women had the same scores on tests of intelligence and that this provided a paradox due to the differences in brain size between men and women and similar IQ scores. However, Rushton and Jackson (2006) showed that men and women differ by 3.63 IQ points on average, among a multitude of other strong correlates with the difference in IQ scores.
Men have 23 billion neocortical neurons, women with 19 percent less, at 19 billion (Pakkerson and Gunderson, 1997). Seeing as cortical neuron activity moderates perception in the brain, the differences in neocortical neurons affect other processes and mental faculties in the brain as well.
All of these brain differences then manifest themselves in cultural achievement between men and women.
Charles Murray (2003), in his book Human Accomplishment shows differing societies’ human accomplishments and how these differences in human accomplishment have shaped our society today. He gathered data on women Nobel Prize winners from 1901-2000 and found this:
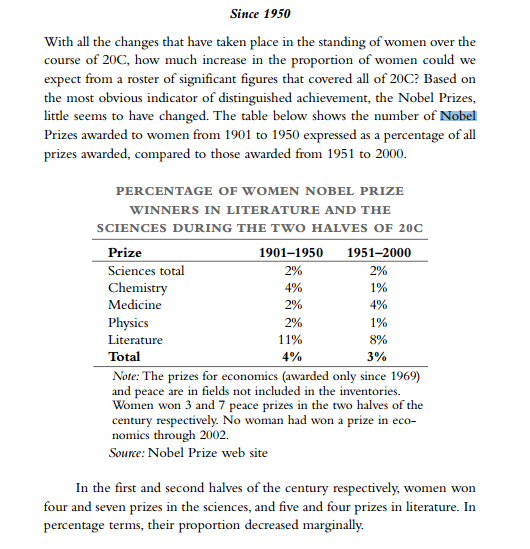
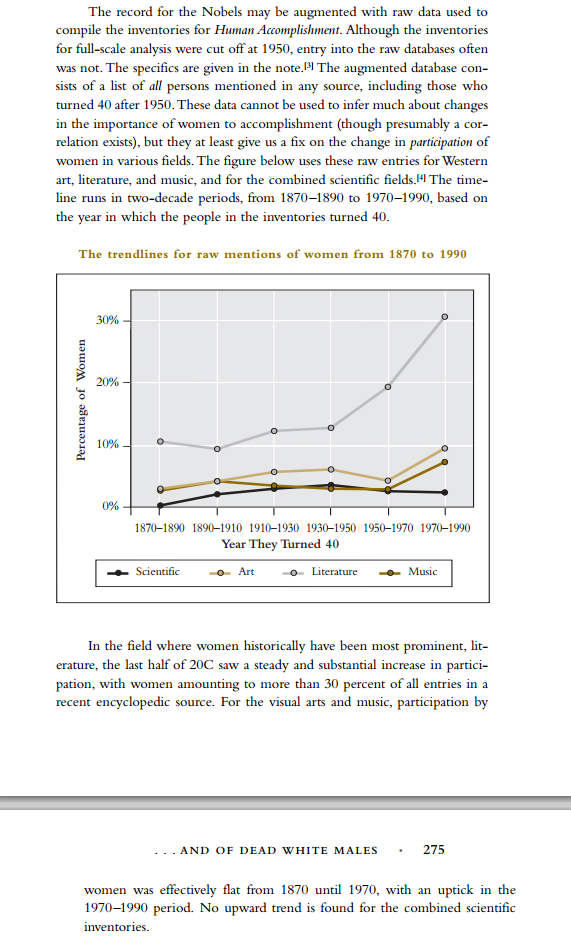
Murray states on p. 273, 274 and 275 that women have an underrepresentation in the sciences. You would figure, if this so-called “white cis male patriarchy” was out to have women be underrepresented, they wouldn’t have allowed the feminist movement to come full-swing in the early 1900s. Well, the numbers on women Nobel Prize winners from 1901-1950 is: 2 percent sciences total, 4 percent chemistry,2 percent medicine, 2 percent physics and 11 percent literature with a 4 percent representation in total. From 1951-2000, it was 2 percent sciences total, 1 percent chemistry, 4 percent medicine, 1 percent in physics and 8 percent in literature for a total of 3 percent.
Now, this does show women’s high verbal ability at play with regards to the number of literary Nobel Prizes’ they have, but this shows that after the Feminist Movement, that when they got ‘equality’, they failed to produce the same as men. This data corroborates what I noted earlier: that there is a significant amount of cortical neuronal difference between men and women, there is a 3.63 IQ point difference between men and women on average, and finally the data on Nobel Prizes corroborates this information.

The Defense Ministers of Sweden, Norway, the Netherlands, and Germany embody what is going on at the moment in these countries with the ‘migrant’ crisis. We can see with Russia’s aversion to the scenario currently happening in Europe, that with their Defense Minister, these things that are currently happening in those aforementioned countries won’t happen in Russia.
This is shown in how men and women’s overall leadership capabilities, ability to lead meetings and differing managing strategies. All of these differences, of course, are due to brain differences between men and women.
Women are more emotional than men due to biology, so in times of war with a woman Defense Minister, since men and women differ in inductive and deductive reasoning traits, women won’t be deductive, which is a logical process in which a conclusion is drawn from multiple premises that are assumed to be true, which men excel at. Women, however, excel at inductive reasoning, which is making broad generalizations from specific observations. It seems that in war time, deductive reasoning would be better, seeing as the conclusion is drawn from things that are assumed to be true. Men make better leaders than women because, since, on average, men don’t think with their emotions while women do.
Men and women’s brains differ on the individual level, of course, like all things between groups, sexes, and individuals. The push to deny human nature, and in turn, invoke a blank slate argument even in the face of science is shown in the way that our society is headed. Between differences in brain size, scholastic achievement, IQ, brain weight, Nobel Prizes, neocortical neurons and other gender-specific differences, these innate differences in brain structure manifest themselves in society and the types of jobs women want and acquire. Women cannot lead as well as men and while they ‘lead differently’, the best type of leader to have is a man as men think with logic and facts whereas women think with emotion, on average.
“Differences in brain structure development may explain test score gap for poor children” Maybe not….
1500 words
Summary: They would have to explain why whites in poorer families score higher than blacks in all other income brackets except blacks in families making over 200,000 dollars per year, which even then blacks only score 3 points higher in the 200,000 dollar plus per year income bracket. They say that frontal and temporal lobes are smaller in poorer children, which whites have bigger frontal and temporal lobes on average as well as having more activity in the frontal lobes, which is thought to be the seat of intelligence. Blacks having smaller brains than whites on average explains the size differences between the differences in the different parts of the brain mentioned.
Low-income children had atypical structural brain development and lower standardized test scores, with as much as an estimated 20 percent in the achievement gap explained by development lags in the frontal and temporal lobes of the brain, according to an article published online by JAMA Pediatrics.
If true, only 20 percent of the achievement gap affected by poverty. I doubt it seeing as poor whites in families making less than 20,000 dollars a year still have 180 points over blacks in the same income bracket and blacks in families making more than 200,000 dollars per year have a 981 score, only 3 points higher than whites in families making less than 20,000 dollars per year. Whites in families making less than 20,000 dollars per year still outperform all negro families in all other income brackets except in negro families making over 200,000 dollars per year by only 3 points. Not even worth talking about.
20 percent of the achievement gap is apparently explained by developmental lags in the front and temporal lobes of the brain. Blacks have a smaller PFC (prefrontal cortex) which may explain it.
Socioeconomic disparities in school readiness and academic performance are well documented but little is known about the mechanisms underlying the influence of poverty on children’s learning and achievement.
It’s well documented that even in poor whites and poor blacks, poor whites are still on average more intelligent and have higher standardized test scores than do blacks.
Seth D. Pollak, Ph.D., of the University of Wisconsin-Madison, and colleagues analyzed magnetic resonance imaging (MRI) scans of 389 typically developing children and adolescents ages 4 to 22 with complete sociodemographic and neuroimaging data. The authors measured children’s scores on cognitive and academic achievement tests and brain tissue, including gray matter of the total brain, frontal lobe, temporal lobe and hippocampus.
I wonder what the breakdown was. Will revise when the full paper comes out. Hippocampal differences are also explained by whites having larger brains than blacks as well as the other parts they state.
The authors found regional gray matter volumes in the brains of children below 150 percent of the federal poverty level to be 3 to 4 percentage points below the developmental norm, while the gap was larger at 8 to 10 percentage points for children below the federal poverty level. On average, children from low-income households scored four to seven points lower on standardized tests, according to the results. The authors estimate as much as 20 percent of the gap in test scores could be explained by developmental lags in the frontal and temporal lobes.
On frontal lobes from this Rushton paper decimating Gould’s garbage *Mismeasure of Man*, which also states they have smaller frontal lobes than whites:
On temporal lobes, from the scientist that Rushton cited above:
.”Development in these brain regions appears sensitive to the child’s environment and nurturance. These observations suggest that interventions aimed at improving children’s environments may also alter the link between childhood poverty and deficits in cognition and academic achievement,” the study concludes.
“Appears sensitive”. I doubt it. See the table on test scores and income above.
In a related editorial, Joan L. Luby, M.D., of the Washington University School of Medicine, St. Louis, writes: “Building on a well-established body of behavioral data and a smaller but expanding body of neuroimaging data, Hair et al provide even more powerful evidence of the tangible detrimental effects of growing up in poverty on brain development and related academic outcomes in childhood. … In developmental science and medicine, it is not often that aspects of a public health problem’s etiology and solution become clearly elucidated. It is even less common that feasible and cost-effective solutions to such problems are discovered and within reach. Based on this, scientific literature on the damaging effects of poverty on child brain development and the efficacy of early parenting interventions to support more optimal adaptive outcomes represent a rare roadmap to preserving and supporting our society’s most important legacy, the developing brain. This unassailable body of evidence taken as a whole is now actionable for public policy.”
I’m assuming they have never seen the SAT score gaps and how whites in families making less than 20,000 dollars a year score the same as blacks in families making over 200,000 dollars a year.
It’s well-known that IQ is the best predictor of success in life. Blacks have a lower a lower average IQ, and smaller brains than whites and Asians which explains the achievement test score gaps. I would like to see a study that separates rich blacks, rich whites and poor blacks and poor whites with controls and see how they differ. I’m assuming it’ll be the same as the SAT score gaps which I have linked above.
The difference in brain size between blacks and whites perfectly describe what is being shown above. More blacks live in poverty because they have lower IQ. IQ is correlated with poverty, crime, illegitimacy, and chronic welfare status. G, or general intelligence, is highly correlated with most things in life. Excerpt from THE g FACTOR The Science of Mental Ability by Arthur Jensen:
In conclusion, they need to have studies that have poor whites and poor blacks, rich blacks and rich whites, rich whites and poor blacks, poor whites and rich blacks and controls to see what the differences really are, and we know there will be differences between the above-mentioned groups, and that poor whites still perform better academically than poor blacks.
