
Home » Posts tagged 'Racial Differences' (Page 3)
Tag Archives: Racial Differences
Steroid Mythconceptions and Racial Differences in Steroid Use
2000 words
Steroids get a bad reputation. It largely comes from movies and people’s anecdotal experiences and repeating stories they hear from the media and other forms of entertainment, usually stating that there is a phenomenon called ‘roid rage’ that makes steroid users violent. Is this true? Are any myths about steroids true, such as a shrunken penis? Are there ways to off-set it? Steroids and their derivatives are off-topic for this blog, but it needs to be stressed that there are a few myths that get pushes about steroids and what it does to behavior, its supposed effects on aggression and so forth.
With about 3 million AAS (ab)users (anabolic-androgenic steroids) in America (El Osta et al, 2016), knowing the effects of steroids and similar drugs such as Winny (a cutting agent) would have positive effects, since, of course, athletes mostly use them.
Shrunken testicles
This is, perhaps, one of the most popular. Though the actual myth is that AAS use causes the penis to shrink (which is not true), in reality, AAS use causes the testicles to shrink by causing the Leydig cells to decrease natural testosterone production which then decreases the firmness and shape of the testicles which then results in a loss of size.
In one study of 772 gay men using 6 gyms between the months of January and February (and you need to think of the type of bias there that those people who are ‘Resolutioners’ would be more likely to go to the gym those months), a questionnaire was given to the men. 15 .2 percent of the men had used, with 11.7 percent of them injecting within the past 12 months. HIV positive men were more likely to have used in the past compared to negative men (probably due to scripts). Fifty-one percent of them reported testicular atrophy, and they were more likely to report suicidal thoughts (Bolding, Sherr, and Elford, 2002). They conclude:
One in seven gay men surveyed in central London gyms in 2000 said they had used steroids in the previous 12 months. HIV positive men were more likely to have used steroids than other men, some therapeutically. Side effects were reported widely and steroid use was associated with having had suicidal thoughts and feeling depressed, although cause and effect could not be established. Our findings suggest that steroid use among gay men may have serious consequences for both physical and mental health.
Of course, those who (ab)use substances have more psychological problems than those who do not. Another study of 203 bodybuilders found that 8 percent (n = 17) found testicular atrophy (for what it’s worth, it was an internet survey of drug utilization) (Perry et al, 2005). Another study found that out of 88 percent of individuals who abused the drug complained of side-effects of AAS use, about 40 percent described testicular atrophy (Evans, 1997), while testicular atrophy was noted in about 50 percent of cases (sample size n = 24) (Darke et al, 2016).
Sperm production
One study of steroid users found that only 17 percent of them had normal sperm levels (Torres-Calleja et al, 2001), this is because exogenous testosterone will result in the atrophy of germinal cells which cause a decrease in spermatogenesis. Though, too, increased AAS (ab)use later into life may lead to infertility later in life. Knuth et al (1989) also studied 41 bodybuilders with an average age of 26.7. They went through a huge laundry list of different types of steroids they have taken over their lives. Nineteen of the men were still using steroids at the time of the investigation (group I), whereas 12 of them (group II) stopped taking steroids 3 months prior, while 10 of them (group III) stopped steroid use 4 to 24 months prior.
They found that only 5 of them had sperm counts below the average of 20 million sperm per square ml, while 24 of the bodybuilders showed these symptoms. No difference between group I and II was noticed and group III (the group that abstained from use for 4 to 24 months) largely had sperm levels in the normal range. So, the data suggests that even in cases of severe decrease of sensitivity to androgens due to AAS (ab)use, spermatogenesis may still continue normally in some men, even when high levels of androgens are administered exogenously, while even after prolonged use it seems it is possible for sperm levels to go back to the normal range (Knuth et al 1989).
Aggression and crime
Now it’s time for the fun part and my reason for writing this article. Does (ab)using steroids cause someone to go into an uncontrollable rage, a la the Incredible Hulk when they inject themselves with testosterone? The media has latched into the mind of many, with films and TV shows showing the insanely aggressive man who has been (ab)using AAS. But how true is this? A few papers have shown that this phenomenon is indeed true (Konacher and Workman, 1989; Pope and Katz, 1994), but how true is it on its own, since AAS (ab)users are known to use multiple substances???
Konacher and Workman (1989) is a case study done on one man who had no criminal history, who began taking AASs three months before he murdered his wife, and they conclude that AAS can be said to be a ‘personality changer’. Piacetino et al (2015) conclude in their review of steroid use and psychopathology in athletes that “AAS use in athletes is associated with mood and anxiety disturbances, as well as reckless behavior, in some predisposed individuals, who are likely to develop various types of psychopathology after long-term exposure to these substances. There is a lack of studies investigating whether the preexistence of psychopathology is likely to induce AAS consumption, but the bulk of available data, combined with animal data, point to the development of specific psycho-pathology, increased aggressiveness, mood destabilization, eating behavior abnormalities, and psychosis after AAS abuse/dependence.” I, too, would add that since most steroid abuse are polysubstance abusers (they use multiple illicit drugs on top of AAS), that the steroids per se are not causing crime or aggressive behavior, it’s the other drugs that the steroid (ab)user is also taking. And there is evidence for this assertion.
Lundholm et al (2015) showed just that: that AAS (ab)use was confounded with other substances used while the individual in question was also taking AAS. They write:
“We found a strong association between self-reported lifetime AAS use and violent offending in a population-based sample of more than 10,000 men aged 20-47 years. However, the association decreased substantially and lost statistical significance after adjusting for other substance abuse. This supports the notion that AAS use in the general population occurs as a component of polysubstance abuse, but argues against its purported role as a primary risk factor for interpersonal violence. Further, adjusting for potential individual-level confounders initially attenuated the association, but did not contribute to any substantial change after controlling for polysubstance abuse.“
Even The National Institute of Health (NIH) writes: “In summary, the extent to which steroid abuse contributes to violence and behavioral disorders is unknown. As with the health complications of steroid abuse, the prevalence of extreme cases of violence and behavioral disorders seems to be low, but it may be underreported or underrecognized.” We don’t know whether steroids cause aggression or more aggressive athletes are more likely to use the substance (Freberg, 2009: 424). Clearly, the claims of steroids causing aggressive behavior and crime are overblown and there has yet to be a scientific consensus on the matter. A great documentary on the matter is Bigger, Stronger, Faster, which goes through the myths of testosterone while chronicling the use of illicit drugs in bodybuilding and powerlifting.
This, too, was even seen in one study where men were administered supraphysiologic doses of testosterone to see its effects on muscle size and strength since it had never been tested; no changes in mood or behavior occurred (Bhasin et al, 1996). Furthermore, injecting individuals with supraphysiological doses of testosterone as high as 200 and 600 mg per week does not cause heightened anger or aggression (Tricker et al, 1996; O’Connor et, 2002). Testosterone is one of the most abused AASs around, and if a heightened level of T doesn’t cause crime, nor can testosterone levels being higher this week compared to last seem to be a trigger for crime, we can safely disregard any claims of ‘roid rage’ since they coincide with other drug use (polysubstance abuse). So since we know that supraphysiologic doses of testosterone don’t cause crime nor aggression, we can say that AAS use, on its own (and even with other drugs) does not cause crime or heightened aggression since aggression elevates testosterone secretion, testosterone doesn’t elevate aggression.
One review also suggests that medical issues associated with AAS (ab)use are exaggerated to deter their use by athletes (Hoffman and Ratamess, 2006). They conclude that “Existing data suggest that in certain circumstances the medical risk associated with anabolic steroid use may have been somewhat exaggerated, possibly to dissuade use in athletes.”
Racial differences in steroid use
Irving et al (2002) found that 2.1 percent of whites used steroids, whereas 7.6 percent of blacks did; 6.1 percent of ‘Hispanics’ use them within the past 12 months, and a whopping 14.1 percent of Hmong Chinese used them; 7.9 percent of ‘other Asians’ used them, and 3,1 percent of ‘Native Americans’ did with 11.3 percent of mixed race people using them within the past 12 months to gain muscle. Middle schoolers were more likely to use than high schoolers, while people from lower SES brackets were more likely to use than people in higher SES brackets.
Stilger and Yesalis (1999: 134) write (emphasis mine):
Of the 873 high school football players participating in the study, 54 (6.3%) reported having used or currently using AAS. Caucasians represented 85% of all subjects in the survey. Nine percent were African-American while the remainder (6%) consisted of Hispanics, Asian, and other. Of the AAS users, 74% were Caucasian, 13% African American, 7% Hispanic, and 3% Asian, x2 (4,854 4) 4.203, p 4 .38. The study also indicated that minorities are twice as likely to use AAS as opposed to Caucasians. Cross tabulated results indicate that 11.2% of all minorities use/used AAS as opposed to 6.5% of all Caucasians (data not displayed).
One study even had whites and blacks reporting the same abuse of steroids in their sample (n = 10,850 ‘Caucasians’ and n = 1,883 black Americans), with blacks reporting, too, lower levels of other drug abuse (Green et al, 2001). Studies indeed find higher rates of drug use for white Americans than other ethnies, in college (McCabe et al, 2007). Black Americans also frequently underreport and lie about their drug use (Ledgerwood et al, 2008; Lu et al, 2001). Blacks are also more likely to go to the ER after abusing drugs than whites (Drug Abuse Warning Network, 2011). Bauman and Ennett (1994) also found that blacks underreport drug use whereas whites overreport.
So can we really believe the black athletes who state that they do not (ab)use AAS? No, we cannot. Blacks like about any and all drug use, so believing that they are being truthful about AAS (ab)use in this specific instance is not called for.
Conclusion
Like with all things you use and abuse, there are always side-effects. Though, the media furor one hears regarding AAS and testosterone (ab)use are largely blown out of proportion. The risks associated with AAS (ab)use are ‘transient’, and will subside after one discontinues using the drugs. Blacks seem to take more AAS than whites, even if they do lie about any and all drug use. (And other races, too, seem to use it at higher rates than whites.) Steroid use does not seem to be ‘bad’ if one knows what they’re doing and are under Doctor’s supervision, but even then, if you want to know the truth about AAS, then you need to watch the documentary Bigger, Stronger, Faster. I chalk this up to the media themselves demonizing testosterone itself, along with the ‘toxic masculinity’ and the ‘toxic jock effect‘ (Miller, 2009; Miller, 2011). Though, if you dig into the literature yourself you’ll see there is scant evidence for AAS and testosterone (ab)use causing crime, that doesn’t stop papers like those two by Miller talking about the effects of ‘toxic jocks’ and in effect, deriding masculine men and with it the hormone that makes Men men: testosterone. If taken safely, there is nothing wrong with AAS/testosterone use.
(Note: Doctor’s supervision only, etc)
Smoking and Race Part II
1750 words
Almost two years ago, I wrote an article on smoking and race, discussing racial differences in smoking, the brains smoked, and biochemical differences brought on by different physiological differences when smoke is inhaled. In this article, I will look at how smoking can be prevented for all race/ethnies, the contribution of smoking to the black/white difference in mortality, and certain personality traits that may have one more likely to pick up the habit.
Tobacco and poverty are “inextricably linked“, with smoking contributing to more than 10 percent of household income among those in poverty. Tobacco has even been said to be a ‘social justice issue‘ since tobacco use is more prevalent in lower-income communities.
It is true that advertisements are concentrated around certain areas to target certain sociodemographic communities (Seidenberg et al, 2010). They looked at two communities in Boston, Massachusets, one high -income non-minority population, and the other a minority low-income population. They found that the low-income community was more likely to have stores which had larger advertisements, have more stores selling tobacco, promote menthol cigarettes (which low-income people are more likely to smoke, mainly blacks), and finally that advertisements for cigarettes would be more likely to be found 1000 feet away from a school zone in low-income communities compared to high-income communities.
They say that their study shows “evidence that features of tobacco advertising are manipulated to attract youth or racial minority sub-groups, and these features are disproportionately evident in low income, minority communities.” So, according to analysis, at least in the urban area of Dorchester, near Boston, if advertisements were to be lessened near schools, along with fewer overall advertisements, the percentage of minority smokers would decrease. (This same effect of low SES affecting the odds of smoking was also seen in a sample of Argentine children; Linetzky et al, 2012).
Higher SES communities have fewer tobacco advertisements than lower SES communities (Barbeau et al, 2005; Hillier et al, 2015). Big Tobacco (along with Big Food and Big Soda) advertise the most in lower-income communities, which then have deleterious health consequences in those populations, further increasing national health spending per year.
Among Americans, as income increases, smoking decreases:
Nationwide, the Gallup-Healthways Well-Being Index reveals that 21% of Americans say they smoke. As the accompanying graph illustrates, the likelihood of smoking generally increases as annual incomes decrease. One exception to this pattern occurs among those making less than $6,000 per year, an income bracket often skewed because many in that bracket are students. Among those making $6,000 to $11,999 per year, 34% say they smoke, while only 13% in the top two income brackets (those with incomes of at least $90,000 per year) say the same — a 21 percentage-point gap.
The Well-Being Index also confirms distinctions in U.S. smoking rates relating to gender and race. Among respondents, 23% of men and 19% of women say they smoke. Blacks are the most likely to smoke (23%) and Asians are least likely to smoke (12%). Hispanics and whites fall in between, at 17% and 20%, respectively.
Further, according to the CDC, the prevalence of smoking of people with a GED is at 40 percent, the highest amongst any SES group. The fact that tobacco companies attempt to advertise in low-income areas and to women is also well-studied. These factors combined to then cause higher rates of smoking in lower-income populations, and blacks are some of the most affected. There are also a slew of interesting physiological differences between blacks and whites regarding smoking.
Ho and Elo (2013) show that smoking differences between blacks and whites at age 50 accounted for 20 and 40 percent of the gap between 1980 and 2005, but not for women. Without adjusting for SES, smoking explains 20 percent of the excessive risk blacks have regarding all-cause mortality.
A study of 720 black smokers from Los Angeles, California showed that 57 percent only smoked menthols, 15 smoked regulars while 28 percent smoked both menthols and regulars (Unger et al, 2010). One of their main findings was that blacks who smoked menthol cigarettes thought that it was a ‘healthier alternative’ to regular cigarettes. Unger et al (2010: 405) also write:
This cross-sectional study identified correlates of menthol smoking, but it does not prove causality. It is possible that smoking menthol cigarettes causes changes in some of the psychological, attitudinal, social, and cultural variables. For example, people who smoke menthols may form beliefs about the positive medicinal benefits of menthols as a way of reducing their cognitive dissonance about smoking.
Figuring out the causation will be interesting, and I’m sure that advertisements outside of storefronts are causally related. Okuyemi et al (2004) also show that blacks who smoke menthol cigarettes are less likely to quit smoking than blacks who smoke regulars. Younger children were more likely to smoke cigarettes with a “longer rod length” (for instance, Newport 100s over Newport regulars). People smoke menthol cigarettes because they taste better, while menthol also “is a prominent design feature used by cigarette manufacturers to attract and retain new, younger smokers.” (Klausner, 2011). Klausner, though, advocates to ban menthol cigarettes, writing:
This evidence suggests that a ban on menthol in cigarettes would result in fewer people smoking cigarettes. Menthol is a prominent design feature used by cigarette manufacturers to attract and retain new, younger smokers. In addition, not only would some current smokers decide to quit rather than smoke non-mentholated cigarettes, but some young people would not make the transition from experimenting with cigarettes to becoming a confirmed smoker. The FDA should ban menthol in cigarettes which will help lower smoking rates particularly among African Americans and women.
Sterling et al (2016) also agree, but argue to ban little cigars and cigarillos (LCCs) writing “Our data add to the body of scientific evidence that supports the FDA’s ban of all characterising flavours in LCCs.” Numerous studies attest to the availability of menthol cigarettes and LCCs which then contributes to influence different demographics to begin smoking. Hersey et al (2006) also shows menthol cigarettes to be a ‘starter product for youth’, stating one reason that children begin smoking mentholated cigarettes is that they are more addictive than non-menthols. Menthol cigarettes are a ‘starter product’ because they taste better than regular cigarettes and, as shown above, seem like they are more ‘theraputic’ due to their taste and coolness compared to regular cigarettes.
Smokers are more likely to be extroverted, tense, anxious and impulsive, while showing more traits of neuroticism and psychoticism than ex- or non-smokers (Rondina, Gorayeb, and Botelho III, 2007). In a ten-year longitudinal study, Zvolensky et al (2015) showed that people who were more likely to be open to experience and be more neurotic would be more likely to smoke, whereas conscientiousness ‘protected’ against picking up the habit. Neuroticism is one of the most important factors of personality to study regarding the habit of smoking. Munafo, Zetteler, and Clark (2006) show in their meta-analysis on personality factors and smoking that neuroticism and increased extraversion were risk factors for being a smoker. I am aware of one study on the effects of different personality and smoking. Choi et al (2017) write:
The results emerging from this study indicate that neuroticism and conscientiousness are associated with the likelihood of being a current smoker, as well as level of ND. Furthermore, personality traits have a greater influence on smoking status and severity of ND in AAs relative to EAs. These relationships were particularly pronounced among smokers with reporting TTFC of ≤5 min.
…
… we found that higher neuroticism and lower conscientiousness were associated with higher likelihood of being a current smoker in the AA sample.
So black smokers were more likely to be conscientious, neurotic and open to experience whereas white smokers were more likely to be neurotic and conscientious.
Finally, racial differences in serum cotnine levels are seen, too. Black smokers have higher levels of cotnine than white smokers (Caraballo et al, 1998; Signorello et al, 2010). Perez-Stable et al (2006) show that higher levels of cotnine can be explained by slower clearance of cotnine along with a higher intake of nicotine per cigarette, because blacks take deeper pulls than whites (though they smoke fewer cigarettes than whites, taking deeper pulls off-sets this; Ho and Elo, 2013).
Smoking can be lessened in all populations—no matter the race/ethincity—with the right universal and intervention efforts (Kandel et al, 2004; Kahende et al, 2011). This can be achieved—especially in low-income areas—by lessening and eventually ridding storefronts of these advertisements for menthol cigarettes, which would then decrease the population of smokers in that area because most only smoke menthols. This would then close some of the black-white mortality gap since smoking causes a good amount of it.
Dauphinee et al (2013) even noted how 52 percent of students recognized Camel cigarettes, whereas 36 percent recognized Marlboro and 32 percent recognized Newports. Black students were three times more likely to recognize Newports than Marlboros (because, in my experience, blacks are way more likely to smoke Newports than Marlboros, which whites are more likely to smoke), while this effect held even after controlling for exposure to smoking by parents and peers. This is yet more proof of the ‘menthol effect’ in lower-income communities that partly drives the higher rates of smoking.
In conclusion, it seems that most of the disparity can be pinned down on Big Tobacco advertising mostly in low-income areas where they spend more than 10 percent of their income on cigarettes. Young children are more likely to know what menthol cigarettes are, what they look like and are more likely to know those type of brains of cigarettes, due mainly to how often and how much they are advertised in low-income areas in comparison to high-income areas. Blacks are also more likely than whites to have the personality traits found in smokers, so this, too, contributes to the how and why of black smoking in comparison to whites; they are more susceptible to it due to their personality along with being exposed to more advertisements since they are more likely to live in lower-income areas than whites.
I don’t believe in banning things, but the literature on this suggests that many people only smoke menthols and that if they were ever banned, most would just quit smoking. I don’t think that we need to go as far as banning menthol cigarettes—or cigarettes in general—we just need to educate people better and, of course, reel in Big Tobaccos reach in lower-income communities. Smoking also began to decline the same year that Joe Camel was ‘voluntarily’ discontinued by its parent company (Pampel and Aguilar, 2008), and so, that is good evidence that at least banning or reforming laws in low-income areas would change the number of smokers in a low-income area, and, along with it, close at least a small part of the black-white mortality gap.
Race/Ethnicity and the Microbiome
1800 words
The microbiome is the number and types of different microorganisms and viruses in the human body. Racial differences are seen everywhere, most notably in the phenotype and morphology. Though, of course, there are unseen racial differences that then effect bodily processes of different races and ethnic groups. The microbiome is one such difference, which is highly heritable (Goodrich et al, 2014; Beaumont et al, 2016; Hall, Tolonen, and Xavier, 2017) (though they use the highly flawed twin method, so heritabilities are most likely substantially lower). They also show that certain genetic variants predispose individuals to microbial dysbiosis. However, diet, antibiotics and birth mode can also influence the diversity of microbiota in your biome (Conlon and Bird, 2015; Bokulich et al, 2017; Singh et al, 2017) and so while the heritability of the microbiome is important (which is probably inflated due to the twin method), diet can and does change the diversity of the biome.
It used to be thought that our bodies contained 90 percent bacteria and only 10 percent human cells (Collen, 2014), however that has been recently debunked and the ratio is 1.3 to 1, human to microbe (Sender, Fuchs, and Milo, 2016). (Collen’s book is still an outstanding introduction to this subject despite the title of her book being incorrect.) Though the 10:1 microbe/human cell dogma is debunked, in no way does that lessen the importance of the microbiome regarding health, disease and longevity.
Lloyd-Price, Abu-Ali, and Huttenhower (2016) review definitions for the ‘healthy human microbiome’ writing “several population-scale studies have documented the ranges and diversity of both taxonomic compositions and functional potentials normally observed in the microbiomes of healthy populations, along with possible driving factors such as geography, diet, and lifestyle.” Studies comparing the biomes of North and South America, Europe and Africa, Korea and Japan, and urban and rural communities in Russia and China have identified numerous different associations that are related to differences in the microbiome between continents that include (but are not limited to) diet, genetics, lifestyle, geography, and early life exposures though none of these factors have been shown to be directly causal regarding geographic microbiome diversity.
Gupta, Paul, and Dutta (2017) question the case of a universal definition of a ‘healthy microbiome’ since it varies by geographic ancestry. Of course, ancestry and geographic location influence culture which influences diet which influences microbiome diversity between populations. This, of course, makes sense. why have a universal healthy microbiome with a reference man that doesn’t reflect the diversity of both the individual and group differences in the microbiome? This will better help different populations with different microbiomes lose weight and better manage diseases in certain populations.
The microbiome of athletes also differs, too. Athletes had enhanced microbiome diversity when compared to non-athletes (Clarke et al, 2016). In a further follow-up study, it was found that microbial diversity correlated with both protein consumption and creatine kinase levels in the body (Clarke et al, 2017) are proxies for exercise, and since they’re all associations, causality remains to be untangled. Nevertheless, these papers are good evidence that both lifestyle and diet leads to changes in the microbiome.
Fortenberry (2013: 165) notes that American racial and ethnic classifications are “social and political in origin and represent little meaningful biologic basis of between-group racial/ ethnic diversity“. It is also known that eating habits, differing lifestyles and metabolic levels also influence the diversity of the microbiome in the three ‘races’* studied (Chen et al, 2016), while deep sequencing of oral microbiota has the ability to classify “African Americans with a 100% sensitivity and 74% specificity and Caucasians with a 50% sensitivity and 91% specificity” (Mason et al, 2014). The infant microbiome, furthermore, is influenced by maternal diet and breastfeeding as well as the infant’s diet (Stearns et al, 2017). This is why differences in race/ethnicity call into question the term of ‘healthy human microbiota’ (Gupta, Paul, and Dutta, 2017). These differences in the microbiome also lead to increased risk for colorectal cancer in black Americans (Goyal et al, 2016; Kinross, 2017).
Further, the healthy vagina “contains one of the most remarkably structured microbial ecosystems, with at least five reproducible community types, or “community state types” (Lloyd-Price, Abu-Ali, and Huttenhower 2016). The diversity of the microbiome in the vagina also varies by race. It was found that 80 percent of Asian women and 90 percent of white women harbored a microbiota species named Lactobacillus, whereas only about 60 percent of ‘Hispanics’ and blacks harbored this species. The pH level, too, varied by race with blacks and ‘Hispanics’ averaging 4.7 and 5.0 and Asians and whites averaging 4.4 and 4.2. So, clearly, since Asians and whites have similar vaginal pH levels, then it is no surprise that they have similar levels of vaginal Lactobacillus, whereas blacks and ‘Hispanics’, with similar pH levels have similar vaginal levels of Lactobacillus.
White subjects also have more diverse species of microbiota than non-white subjects while also having a different microbiota structure (Chen et al, 2015). Caucasian ethnicity/race was also shown to have a lower overall microbiome diversity, but higher Bacteroidetes scores, while white babes also had lower scores of Proteobacteria than black Americans (Sordillo et al, 2017). This comes down to both diet and genetic factors (though causation remains to be untangled).
Differences in the skin microbiome also exist between the US population and South Americans (Blaser et al, 2013). They showed that Venezuelan Indians had a significantly different skin biome when compared to US populations from Colorado and New York, having more Propionibacterium than US residents. Regarding the skin microbiota in the Chinese, Leung, Wilkins, and Lee (2015) write “skin microbiomes within an individual is more similar than that of different co-habiting individuals, which is in turn more similar than individuals living in different households.” Skin microbiota also becomes similar in cohabitating couples (Ross, Doxey, and Neufeld, 2017) and even cohabitating family members and their dogs (Song et al, 2013; Cusco et al, 2017; Torres et al, 2017).
Differences between the East and West exist regarding chronic liver disease, which may come down to diet which may influence the microbiota and along with it, chronic liver disease. (Nakamoto and Schabl, 2016). The interplay between diet, the microbiome and disease is critical if we want to understand racial/ethnic differentials in disease acquisition/mortality, because the microbiome influences so many diseases (Cho and Blaser, 2012; Guinane and Cotter, 2013; Bull and Plummer, 2014; Shoemark and Allen, 2015; Zhang et al, 2015; Shreiner, Kao, and Young, 2016; Young, 2017).
The human microbiome has been called our ‘second genome’ (Zhu, Wang, and Li, 2010; Grice and Seger, 2012) with others calling it an ‘organ’ (Baquero and Nombela, 2012; Clarke et al, 2014; Brown and Hazen, 2015). This ‘organ’, our ‘second genome’ can also influence gene expression (Masotti, 2012; Maurice, Haiser, and Turnbaugh, 2013; Byrd and Seger, 2015) which could also have implications for racial differences in disease acquisition and mortality. This is why the study of the microbiome is so important; since the microbiome can up- and down-regulate gene expression—effectively, turning genes ‘on’ and ‘off’—then understanding the intricacies that influence the microbiome diversity along with the diet that one consumes will help us better understand racial differences in disease acquisition. Diet is a huge factor not only regarding obesity and diabetes differences within and between populations, but a ‘healthy microbiome’ also staves off obesity. This is important. The fact that the diversity of microbiota in our gut can effectively up- and down-regulate genes shows that we can, in effect, influence some of this ourselves by changing our diets, which would then, theoretically, lower disease acquisition and mortality once certain microbiome/diet/disease associations are untangled and shown to be causative.
Finally, the Hadza have some of the best-studied microbiota, and since they still largely live a hunter-gatherer lifestyle, this is an important look at what the diversity of microbiota may have looked like in our hunter-gatherer ancestors (Samuel et al, 2017). The fact that they noticed such diverse changes in the microbiome—some species effectively disappearing during the dry season and reappearing during the wet season—is good proof that what drives these changes in the diversity of the microbiota in the Hadza are seasonal changes in diet which are driven by the wet and dry seasons.
Gut microbiota may also influence our mood and behavior, and it would be interesting to see which types of microbiota differ between populations and how they would be associated with certain behaviors. The microbes are a part of the unconscious system which regulates behavior, which may have causal effects regarding cognition, behavioral patterns, and social interaction and stress management; this too makes up our ‘collective unconscious’ (Dinan et al, 2015). It is clear that the microbes in our gut influence our behavior, and it even may be possible to ‘shape our second genome’ (Foster, 2013). Endocrine and neurocrine pathways may also be involved in gut-microbiota-to-brain-signaling, which can then alter the composition of the microbiome and along with it behavior (Mayer, Tillisch, and Gupta, 2015). Gut microbiota also plays a role in the acquisition of eating disorders, and identifying the specific microbiotal profiles linked to eating disorders, why it occurs and what happens while the microbiome is out of whack is important in understanding our behavior, because the gut microbiome also influences our behavior to a great degree.
The debate on whether or not racial/ethnic differences in microbiome diversity differs due to ‘nature’ or ‘nurture’ (a false dichotomy in the view of developmental systems theory) remains to be settled (Gupta, Paul, and Dutta, 2017). However, like with all traits/variations in traits, it is due to a complex interaction of the developmental system in question along with how it interacts with its environment. Understanding these complex disease/gene/environment/microbiotal pathways will be a challenge, as will untangling direct causation and what role diet plays regarding the disease/microbiota/dysbiosis factor. As we better understand our ‘second genome’, our ‘other organ’, and individual differences in the genome and how those genomic differences interact with different environments, we will then be able to give better care to both races/ethnies along with individuals. Just like with race and medicine—although there is good correlative data—we should not jump to quick conclusions based on these studies on disease, diet, and microbiotal diversity.
The study of ethnic/racial/geographic/cultural/SES differences in the diversity of the microbiome and how it influences disease, behaviors and gene expression will be interesting to follow in the next couple of years. I think that there will be considerable ‘genetic’ (i.e., differences out of the womb; I am aware that untangling ‘genetic’ and ‘environmental’ in utero factors is hard, next to impossible) differences between populations regarding newborn children, and I am sure that even the microbiota will be found to influence our food choices in the seas of our obesogenic environments. The fact that our microbiota is changeable with diet means that, in effect, we can have small control over certain parts of our gene expression which may then have consequences for future generations of our offspring. Nevertheless, things such as that remain to be uncovered but I bet more interesting things never dreamed of will be found as we look into the hows and whys of both individual and populational differences in the microbiome.
You Don’t Need Genes to Delineate Race
2100 words
Most race deniers say that race isn’t real because, as Lewontin (1972) and Rosenberg (2002) state, the within-group variation is larger than the between-group variation. Though, you can circumvent this claim by not even looking at genes/allele frequencies between races, you can show that race is real by looking at morphology, phenotype and geographic ancestry. This is one of Michael Hardimon’s race categories, the minimalist concept of race. This concept does not entail anything that we cannot physically ‘see’ with our eyes (e.g., mental and psychological traits are off the table). Using these concepts laid out by Hardimon can and does prove that race is real and useful without even arguing about any potential mental and psychological differences between human races.
Morphology
Morphology is one of the most simple tells for racial classification. Just by looking at average morphology between the races we can use attempt to use this data point as a premise in the argument that races exist.
East Asians are shorter with shorter limbs and have an endomorphic somatype. This is due to evolving in cold climate, as a smaller body and less surface area can be warmer much quicker than a larger body. This is a great example of Allen’s rule: that animals in colder climates will be smaller than animals in warmer climates. Using average morphology, of course, can show how the population in question evolved and where they evolved.
Regarding Europeans, they have an endomorphic somatype as well. This, again, is due to where they evolved. Morphology can tell us a lot about the evolution of a species. Though, East Asians and Europeans have similar morphologies due to evolving in similar climates. Like East Asians, Europeans have a wider pelvis in comparison to Africans, so this is yet another morphological variable we can use to show that race exists.
Finally, the largest group is ‘Africans’ who have the largest phenotypic and genetic diversity on earth. Generally, you can say that they’re tall, have long limbs and a short torso, which is due to evolving in the tropics. Furthermore, and perhaps most important, Africans have narrower pelves than East Asians and Europeans. This character is one of the most important regarding the reality of race because it’s one of the most noticeable, and we do notice in when it comes to sports competition because that certain type of morphology is conducive to athletic success. (Also read my recent article on strength and race and my article on somatype and race for more information on morphologic racial differences.)
Phenotype
Morphology is a part of the phenotype too, obviously, but there is a reason why it’s separated. As is true with morphology, different characters evolved due to cultural evolution (whether or not they adopted farming early) or evolution through natural selection, drift and mutation. Though, of course, favorable mutations in a certain environment will be passed on and eventually become a part of the characteristics of the population in question.
East Asians have the epicanthic fold, which probably evolved to protect the eye from the elements and UV rays on the Mongolian steppes. They also have softer features than Europeans and Africans, but this is not due to lower testosterone as is popularly stated. (Amusingly enough, there is a paper that stated that East Asians have Down Syndrome-like qualities due to their epicanthic folds to bring up one reason.) Even then, what some races find attractive or not can show how and why certain facial phenotypes evolved. To quote Gau et al (2018):
Compared with White women, East Asian women prefer a small, delicate and less robust face, lower position of double eyelid, more obtuse nasofrontal angle, rounder nose tip, smaller tip projection and slightly more protruded mandibular profile.
And they conclude:
The average faces are different from the attractive faces, while attractive faces differ according to race. In other words, the average facial and aesthetic criteria are different. We should use the attractive faces of a race to study that races aesthetic criteria.
We can use studies such as this to discern different facial phenotypes, which, again, proves that race exists.
The climate one’s ancestors evolved in dictates nose shape. In areas where it is extremely dry and also has a lot of heat, a larger mucous area is required to moisten inspired (inhaled) air, which is why a more flat and narrow nose is needed.
Zaidi et al (2017) write:
We find that width of the nares is correlated with temperature and absolute humidity, but not with relative humidity. We conclude that some aspects of nose shape may have indeed been driven by local adaptation to climate.
Though climate, of course, isn’t the only reason for differences in nose shape; sexual selection plays a part too, as seen in the above citation on facial preferences in East Asian and European women.
There are also differences in hirsutism between the races. Racial differences exist regarding upper lip hair, along with within-race differences (Javorsky et al, 2014). The self-reported races of African American, East Asian, Asian Indian, and ‘Hispanic’ predicted facial hair differences in women, but not how light their skin was. The women were from Los Angeles, USA; Rome, Italy; Akita, Japan; and London, England. Indian women had more hair than any other race, while European women had the least. Regarding within-race variation, Italian women had more hair on their upper lip than American and British women. Skin lightness was related to hair on the upper lip. (Also read my article The Evolution of Human Skin Variation for more information on racial differences in skin color.)
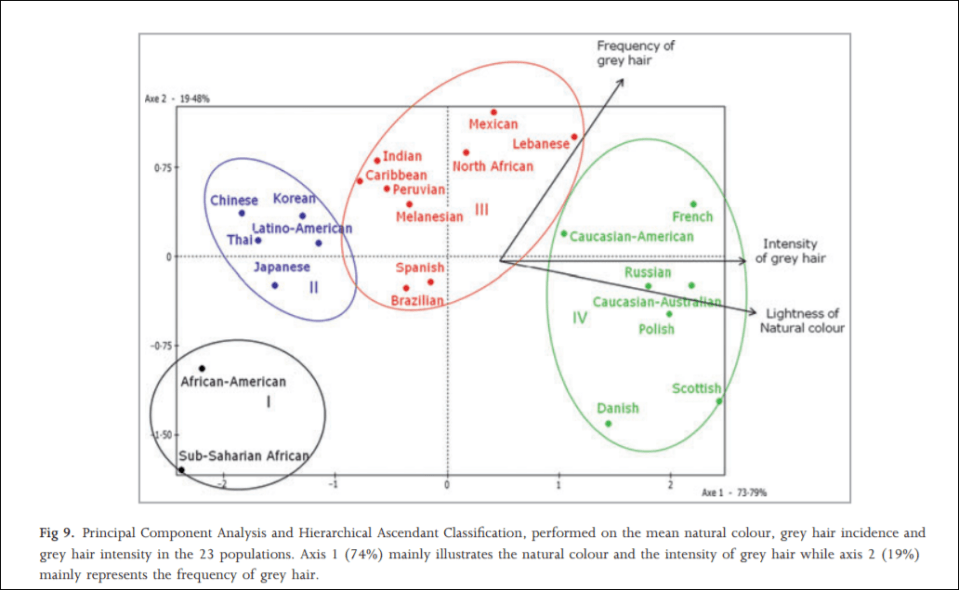
In 2012, an interesting study was carried out on hair greying on a sample population of a large number of the world’s ethnies titled Greying of the human hair: a worldwide survey, revisiting the ‘50’ rule of thumb. The objective of the study was to test the ’50-50-50′ rule; that at age 50, 50 percent of the population has at least 50 percent of their hair grey. Africans and Asians showed fewer grey hairs than whites who showed the most. The results imply that hair greyness varies by ethnicity/geographic origin, which is perfect for the argument laid out in this article. The global range for people over 50 with 50 percent or more of their hair grey was between 6 and 23 percent, far lower than what was originally hypothesized (Panhard, Lozano, and Loussouarn, 2012). They write on page 870:
With regard to the intensity of hair greying, the lowest values were found among African and Asian groups, especially Thai and Chinese, whereas the highest values were in subjects with the blondest hair (Polish, Scottish, Russian, Danish, CaucasianAustralian and French).
…
Altogether, these analyses clearly illustrate that the lowest incidences and intensities of grey hair are found in populations of the darkest hair whereas the highest intensities are found in populations with the lightest hair tones.
Actual hair diversity is much more concentrated in Europeans, however (Frost, 2005). (See Peter Frost’s article Why Do Europeans Have So Many Hair and Eye Colors?) It is largely due to sexual selection, with a few climatic factors thrown in. Dark hair, on the other hand, is a dominant trait, which is found all over the world.
Zhuang et al (2010) found significant differences in facial morphology between the races, writing:
African-Americans have statistically shorter, wider, and shallower noses than Caucasians. Hispanic workers have 14 facial features that are significantly larger than Caucasians, while their nose protrusion, height, and head length are significantly shorter. The other ethnic group was composed primarily of Asian subjects and has statistically different dimensions from Caucasians for 16 anthropometric values.
…
Statistically significant differences in facial anthropometric dimensions (P < 0.05) were noted between males and females, all racial/ethnic groups, and the subjects who were at least 45 years old when compared to workers between 18 and 29 years of age.
Blacks had statistically significant differences in lip and face length when compared to whites (whites had shorted lips than blacks who had longer lips than whites).
Brain size and cranial morphology, too, differs by geographic ancestry which is directly related to the climate where that population evolved (Beals, Smith, and Dodd, 1984). Most every trait that humans have—on average of course—differs by geographic location and the cause of this is evolution in these locations along with being a geographically isolated breeding population.
Geographic ancestry
The final piece to this argument is using where one’s recent ancestors came from. There are five major populations from a few geographic locales: Oceania, the Americas (‘Native Americans), Europe, Africa and East Asia. These geographic locales have peoples that evolved there and underwent different selective pressures due to their environment and their bodies evolved to better suit their environment, and so racial differences in morphology and phenotype occurred so the peoples could survive better in that location. No one part of this argument is more important than any other, though geographic ancestry is the final piece of the puzzle that brings everything together. Because race is correlated with morphology and phenotype, the geographic ancestry dictates what these characteristics look like.
Conclusion
Thus, this is the basic argument:
P1: Differing populations have differing phenotypes, including (but not limited to) facial structure, hair type/color, lip structure, skull size, brain size etc.
P2: Differing populations have differing morphology which, along with this population’s phenotype, evolved in response to climatic demands along with sexual selection.
P3: This population must originate from a distinct geographic location.
C: If all three of the above premises are true, then race—in the minimalist sense—exists and is biologically real.
This argument is extremely simple, and along with the papers cited above in support of the three premises and the ultimate conclusion, it will be extremely hard for race deniers to counter. We can say that P1 is logically sound because geographically isolated populations differ in the above-mentioned criteria. We can say that P2 is logically sound since differing populations have differing morphology (as I have discussed numerous times which leads to racial differences in sporting competition) such as differing trunk lengths, leg lengths, arm lengths and heights which are largely due to evolution in differing climates. We can say that P3 is logically sound because the populations that would satisfy P1 and P2 do come from geographically distinct locations; that is, they have a peculiar ancestry that they only share.
This concept of minimalist race from Michael Hardimon is (his) the racialist concept of race “stripped down to its barest bones” (Hardimon, 2017: 3). The minimalist concept of race, then, does not discuss any differences between populations that cannot be directly discerned with the naked eye. (Note: You can also use the above arguments/data laid out for the populationist concept of race, which, according to Hardimon (2017: 3) is: “A nonracialist (nonessentialist, nonhierarchical) candidate scientific concept that characterizes races as groups of populations belonging to biological lines of descent, distinguished by patterns of phenotypic differences, that trace back to geographically separated and extrinsically reproductively isolated founder populations.)
Minimalist race is biologically sound, grounded in genetics (though I have argued here that you don’t need genetics to define race), and is grounded in biology. Minimalist race is defined as characteristics of the group, not of the individual. Minimalist race are biologically real. Minimalist races exist because, as shown with the data presented in this article, phenotypic and morphologic traits are unevenly distributed throughout the world which then correlates with geographic ancestry. It cannot get any more simpler than that: race exists because differences in phenotype and morphology exist which then corresponds with geographic ancestry.
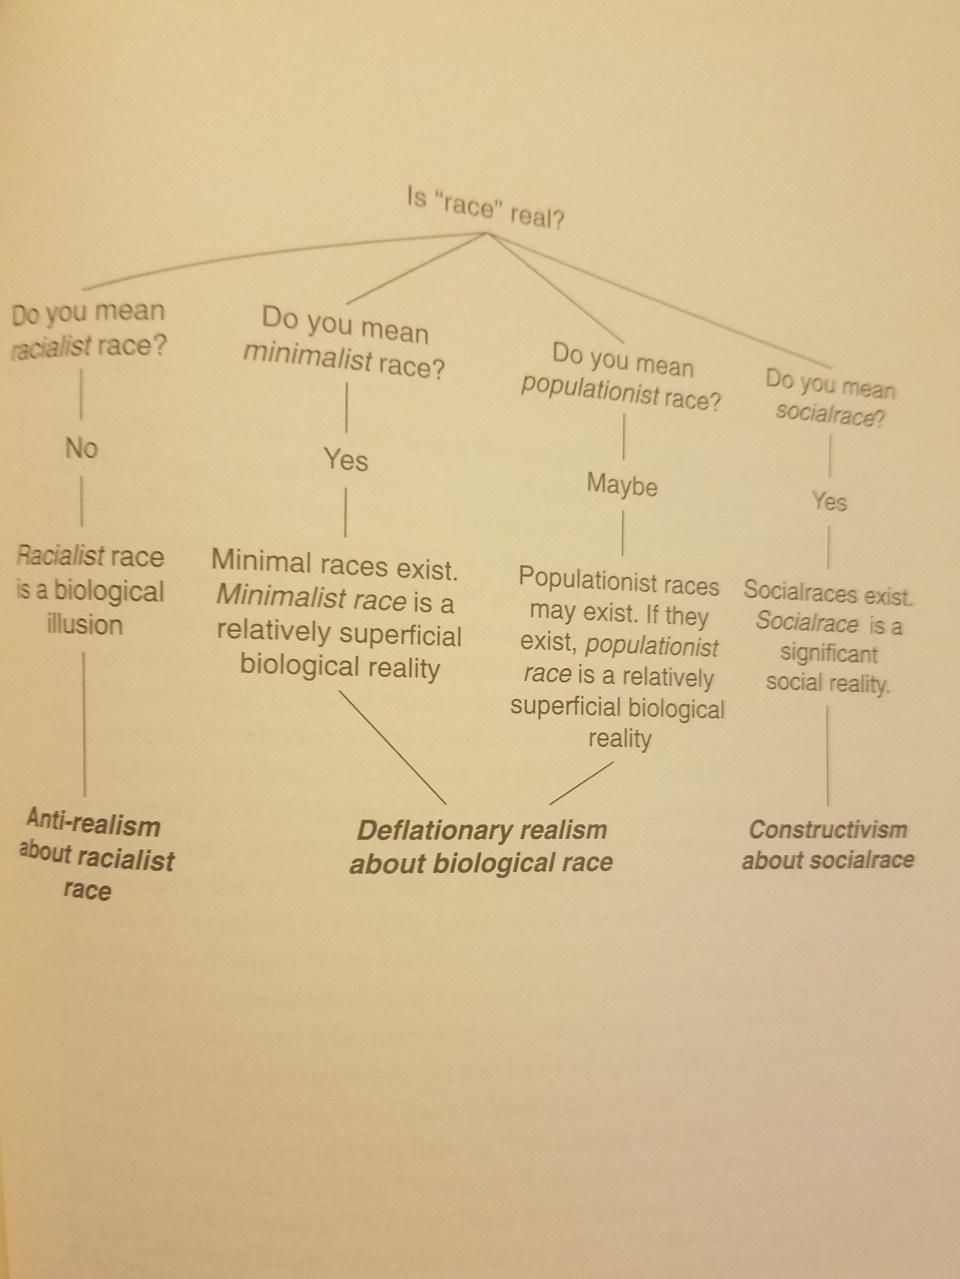
From Hardimon (2017: 177)\
No sane or logical person would deny the existence of race based on the criteria laid out in this article. We can also make another leap in logic and state that since minimalist races exist and are biologically real then geographic ancestry should be a guide when dealing with medicine and different minimalist races.
It is clear that race exists in the minimal sense; you do not need genes to show that race is real, nor that race has any utility in a medical context. This is important for race deniers to understand: genes are irrelevant when talking about the reality of race; you only need to just use your eyes and you’ll see that certain morphologies and phenotypes are distributed across geographic locations. It is also very easy to get someone to admit that races exist in this minimalist-biological sense. No one denies the existence of Africans, Europeans, ‘Native’ Indians, East Asians and Pacific Islanders. These populations differ in morphology and other physical characters which are unevenly distributed by geographic ancestry, so, therefore: minimialist races exist and are a biological reality.
Malaria, the Sickle Cell Trait, and Fast Twitch Muscle Fibers
2550 words
West Africans and their descendants have longer limbs and a shorter trunk than Europeans, on average—as I have extensively noted. Due to where they evolved, of course, they have a different morphology and physiology. Bergmann’s rule states that peoples with recent ancestry in the tropics will have slimmer pelvic bones and be narrower overall whereas Allen’s rule states that peoples with recent ancestry in the tropics will have long limbs, these traits being good for heat dissipation (Lieberman, 2015) and is one reason why West Africans and their descendants excel in these most sports in America.
The fact that a lot of African ethnic groups have different anatomic proportions and physiologic adaptations in comparison to people who have evolved in non-tropical climates is not contested. Morrison and Cooper’s (2006) hypothesis on sick cell anemia driving elite athletic performance in West Africans and their descendants is one of the most interesting explanations I’ve heard on the biochemical differences between the races. Sickle cell anemia is caused by a gene mutation. On amino acid 6, a single nucleotide substitution from A to T (As pair it Ts, Gs pair with Cs). This substitution changes a glutamic acid codon to valine codon which then causes sickling of the blood. Sickle cell anemia, of course, is not a ‘black disease’ as is popularly believed, but it, in fact, has to do with geography and the prevalence of malaria-carrying mosquitoes in that location. “This mutation“, Morrison and Cooper (2006) write “appears to have triggered a series of physiological adjustments, which have had favourable athletic consequences.”
Now, I’m aware that those who are already skeptical of this hypothesis may say ‘so does this mean that Italians, Greeks, MENA peoples etc have more type II fibers and would excel in these competitions?’, no it does not mean that because they don’t have the requisite morphology that West Africans have.
In the 1970s, a study was carried out on the physiological and anatomical proportions of Olympic athletes who competed in the 1968 Olympic games. Anatomic and physiologic measures were taken for each athlete. They used four racial classifications: Negroid, Caucasoid, Mongoloid, and mestizo (Indian/Spanish mix). The classifications were based on “were based on identification and somatotype photographs, as well as physical characteristics including skin color; general body shape; proportions of segments of the limbs; facial structure; form of eyes, lips, and nose; and colour and texture of hair” (Morrison and Cooper, 2006). This study, of course, also confirmed the anatomic differences between blacks and other races and how it leads to superior sports performance. Though, something peculiar was noted in the black athletes. Morrison and Cooper (2006) write: “Although the study failed to link athletic capability to a single gene system, the authors expressed “surprise” that “a sizeable number of Negroid Olympic athletes manifested the sickle-cell trait.””
One interesting study looked at the sickle cell trait (SCT) in French West Indian elite sprint athletes (Marlin et al, 2005). Using the French National Team for the year 2000, Marlin et al (2005) identified 3 sprinters (2 males and 1 female) who tested positive for the SCT. They also noticed a significantly higher presence of titles for people who tested positive for the SCT (38.6 percent for males and 50 percent for females. Marlin et al (2005: 624) conclude “that male SCT carriers are able to perform sprints and brief exercises at the highest levels” and “that brief and intensive exercise performance involving mainly alactic anaerobic metabolism may be enhanced by HbS in elite male sprinters.”
Blacks had narrower hips, longer arms and legs and a shorter trunk in comparison to other races. Of course, somatype is the variable that matters here but certain races are more likely to have certain anatomic characters that lead to superior spots performance on comparison to other races. The authors also attempted to link traits with single gene networks but were unsuccessful. However, they did notice that a large number of black athletes tested positive for the sickle cell trait. There is a conundrum here, however. People with the sickle cell gene might have a greater oxygen demand which causes more in vivo cell sickling. It was hypothesized that these individuals would be at a disadvantage since the 1968 Olympic games were held in Mexico city which is a high altitude area. They theorized that their blood would sickle more at the high altitude in comparison to low altitude but this was not seen.
Then another study was carried out which showed that not only do individuals with the sickle cell trait have lower hemoglobin levels, but all blacks do (Garn, Smith, and Clark, 1975). This is how and why they can perform at high altitudes despite having the sickle cell trait. Then, to test if this was mostly ‘environmental’ or ‘genetic’ they undertook a large study where they followed individuals throughout their whole lives and the difference persisted even later in life. Of course, according to other authors, some sort of compensatory mechanism should exist to counteract black’s lower hemoglobin levels, since this deficiency even exists in athletes (Morrison and Cooper, 2006).
As I’ve written about in the past, it was established that type I and type II fibers use different metabolic pathways and that type II fibers lead to improved athletic performance (along with the certain genotype for the ACTN3 gene). Morrison and Cooper (2006) also state that, of course, not all West Africans and descendants have this trait, and that these people came from a small area of West Africa.
A study looking at pulmonary differences between blacks and whites was conducted which found that blacks compensated for smaller lungs by breathing harder than whites while engaged in physical activity. In a study of 80 Asians and Europeans, Korotzer, Ong, and Hansen (2000) also showed that Asians had lower pulmonary functioning than Europeans. Even differences in chest size has been purported to explain differences in lung functioning, though this relationship did not hold (Whittaker, Sutton, and Beardsmore, 2005). Though, in his short review on race and the history of lung functioning, Braun (2015) writes that “At the very least, the idea that people labelled ‘white’ naturally have higher lung capacity than other races throughout the world should be approached with some skepticism.” because “Most commercially available spirometers internationally ‘correct’ or ‘adjust’ for race in one of two ways: by using a scaling factor for all people not considered to be ‘white’; or by applying population-specific norms. To enable the spirometer, the operator must select the race of an individual, as well as indicate their age, sex/gender and height. How race (or population) is determined varies, with most operators either asking patients to self-identify or ‘eyeballing it’. Interviews with users of the spirometer indicate that many operators are unaware that they are automatically activating race correction when they select a patient’s race (3). Because ‘correction’ is programmed into the spirometer by the manufacturer, it can be difficult to disable.”
Braun, Wolfgang, and Dickerson (2013) and Braun (2015) critiques pulmonary studies because in a large majority of cases, possible explanatory variables for lower lung functioning in black Americans could be related to SES. Harik-Khan, Muller, and Wise (2004) used participants from the Third National Health and Nutrition Examination Survey. They chose black and white children between the ages of 8 and 17 who did not smoke (n=1462, 623 whites and 839 blacks). Blacks were taller but had lower SES, had lower levels of vitamins A and C, along with lower levels of alpha carotene. They also had lower lung functioning. When they adjusted for confounds, sitting explained 42 to 53 percent of the racial difference, SES factors and antioxidant vitamin levels accounted for 7 to 10 percent of the difference. So they could only account for 50 to 63 percent of the difference. In 752 children aged 8 to 10 years of age, low birth weight accounted for 3 to 5 percent of the differences whereas maternal smoking had no effect (Harik-Khan, Muller, and Wise, 2004). So the remaining variation, obviously, will be accounted for by other SES variables, biology, or environmental factors.
Whitrow and Harding (2004) show that, at least for Caribbean blacks living in the UK, upper body differences explained most of the variation in lung functioning than did sitting height, with social correlates having a small but significant impact.
So because blacks have more type II fibers on average, they will convert glucose into energy more rapidly than whites. The energy for these muscle contractions comes from adenosine triphosphate (ATP). Blacks and whites both convert glucose into ATP for cellular functioning but in different ratios. These differences in muscular contractions driven by the metabolic pathway differences of the fibers are one large reason why blacks dominate sports.
Fibers are broken down into two types: fast and slow twitch. Slow twitch fibers use aerobic metabolism which is how they generate ATP and greater oxidative capacity due to higher levels for myoglobin. Oxygen bound to hemoglobin is carried to the red blood cells through capillaries that then influence muscular performance. Myoglobin is also essential for the transport of oxygen to the mitochondria where it is then consumed. Conversely, fast twitch fibers use anaerobic metabolism, have less oxidative capacity, less myoglobin and due to this, they are more dependent on anaerobic metabolism. Blacks also have “significantly higher levels of activity in their phosphagenic, glycolytic, and lactate dehydrogenase marbling pathways than their Caucasian counterparts” (Morrison and Cooper, 2006). This is where the production of ATP is regenerated,and so they have a huge advantage here. So higher faster production of ATP lead to more efficient ATP production, too. However when the ATP is depleted then it’s replaced by a reaction that depletes creatine phosphate. Skeletal muscle then converts “chemical energy into mechanical work” which only 30 to 50 percent is wasted as heat, so even small physiological differences can lead to large differences in performance (Morris and Cooper, 2006).
Though that’s not the only biochemical difference (faster ATP regeneration and production) between the blacks and whites that would explain sports performance. Morrison and Cooper (2006) write: “There is also considerably greater activity in the lactate dehydrogenase pathway of people of West African descent. A primary function of this pathway is to reduce muscle fatigue by converting lactic acid back to glucose and refeeding the muscles. This cyclic set of reactions, from muscles to liver and back to muscles, is known as the Cori cycle.”
Lactic acid production is that feeling in your muscles when during extended athletic activity whereas the postponement of muscle fatigue rests on the rate at which lactic acid is covered into glucose. The rate of this removal is further increased by the lactate dehydrogenase pathway describe above by Morrison and Cooper.
Clearly, the production of lactic acid causes problems during physical activity. The production of lactic acid into glucose to refers the muscles through the lactate dehydrogenase pathway is critical, for if glycogen reserves are depleted during extended physical activity then blood glucose would become the primary source of energy for the muscles, which could lead to lowered blood glucose levels and the nervous system may become compromised. During prolonged activity, however, if glucose isn’t available for energy then the body uses fat reserves which is less efficient than carbohydrates for energy and combustion.
Morrison and Cooper conclude: “Not the least of coincidence seems to be the influence of the compensatory sickle cell gene on oxygen transport and availability to the tissues. The reduced availability pulled with reduced oxygen myoglobin in the preponderant fast-twitch muscle fibres which are adapted for rapid anaerobic energy (ATP) regeneration, all give a new outcome of muscle anatomical and biochemical advantages which proffer a superior athleticism.”
Though, at the moment, as David Epstein states in his 2014 book The Sports Gene: Inside the Science of Extraordinary Athletic Performance, in a few studies done on mice genetically altered to have low hemoglobin levels, a there was a “shift of type IIa fast-twitch muscle fibers to type IIb “super fast twitch” muscle fibers in their lower legs” (Epstein, 2014: 179). This is also a developmental effect of mice in their lifetime, not a direct effect of evolution (Epstein, 2014: 179). No compensatory mechanism yet exists for humans, which I will attempt to untangle in future articles on the matter.
At the end of the chapter on this subject (Chapter 11, Malaria and Muscle Fibers, page 179), Epstein states that he asked physiologists their thoughts on the hypothesis. A few people approved of it, whereas one stated that he had evidence for physiological differences between blacks and whites that have not been studied before but he won’t release his results:
Several scientists I spoke to about the theory insisted they woud have no interest in investigating it because of the inevitably thorny issue of race involved. On of them told me that he actually has data on ethnic differences with respect to a particular physiological trait, but that he would never publish the data because of potential controversy. Another told me he would worry about following Cooper and Morrison’s line of inquiry because any suggestion of a physical advantage among a group of people could be equated to a corresponding lack of intellect, as if athleticism and intelligence were on some kind of biological teeter-totter. With that stigman in mind, perhaps the most important writing Cooper did in Black Superman [Cooper’s book] was his methodical eviseceration of any supposed inverse link between physical and mental prowess. “The concept that physical superiority could somehow be a symptomn of intellectual inferiority only developed when physical superiority became associated with African Americans,” Cooper wrote. “That association did not begin until about 1936.” The idea that athleticism was suddenly inversely proportional to intellect was never a cause of bigotry, but rather a result of it. And Cooper implied a more serious scientific inquiry into difficult issues, not less, is the appropriate path. (Epstein, 2014: 179) [Entine (2002) also spends a considerable amount of time debunking the myth of intelligence and athletic ability being negatively correlated in his 2002 book Taboo: Why Black Athletes Dominate Sports and Why We’re Afraid to Talk About It, which was kind of popularized by Rushton (1997) with his now debunked r/K selection theory.]
Things like this piss me off. These differences are actually measurable and lead to trait differences between the races, and know the mechanisms, pathways and whatnot and people are still. Scared to share their findings. One day, I hope, science will find a way to disregard people’s feelings in regard to people’s feelings on notable, testable and replicable differences between the races, most importantly between blacks and whites. I’ve noted how type II fibers lead to metabolic changes and small tears which then cause big problems. This is due to how fast the type II fibers fire in comparison to the slow twitch fibers.
This hypothesis is extremely interesting and now that I’ve laid out Morrison and Cooper’s (2006) hypothesis, I’m going to take a deep dive into this literature to see what I can prove about this hypothesis. Of course, the somatype along with the fiber distribution matters, as does having the XX genotype and not RR, which lends to superior athletic performance when coupled with type II muscle fibers (Broos et al, 2016). The pieces of this puzzle are, in my opinion, slowly being put together for someone to come along and integrate them into a coherent theory for the sickle cell trait and superior athletic performance through type II muscle fibers. It’s very interesting to note that elite sprinters were more likely to carry the SCT and that champion sprinters were more likely to have it too.
Race and Strength on the Big Four Lifts
2450 words
Different races have different morphology/somatype. Therefore, we can reason that different races would fare better or worse at a certain lift depending on their limb length, such as leg length, arm length, torso length and so on. How do somatypic differences lead to differences in strength between the races on the Big Four lifts? The four lifts I will cover are bench press, deadlift, squat and overhead press.
Squat
East Asians
East Asians have higher levels of body fat (for instance the Chinese, Wang et al, 2011) and have lower BMIs, yet higher levels of body fat (Wang et al, 1994). This, along with their somatype are part of the reason why they excel in some strength sports. Since East Asians have a smaller stature, averaging about 5 feet 8 inches, with shorter arms and legs. Thinking about how the ancestors of the East Asians evolved, this makes sense: they would have needed to be shorter and have shorter limbs as it is easier to warm a body with a smaller surface area. Therefore, while squatting they have a shorter path to travel with the bar on their back. East Asians would strongly excel at the squat, and if you watch these types of competitions, you’d see them strongly overrepresented—especially the Chinese.
African-Americans
African-Americans are descended from West African slaves, and so they have longer, thinner limbs with lower amounts of body fat on average (especially if they have more African ancestry), which is a classic sign of a mesomorphic phenotype. They do also skew ecto, which is useful in the running competitions they dominate (in the case of West Africans and descendants and certain tribes of Kenyans and Ethiopians). Either way, due to their long limbs and a short torso, they have to travel further with the weight therefore here they suffer and wouldn’t be as strong as people who have a long torso with shorter limbs.
European Americans
Like East Asians, Europeans have similar morphology—skewing ectomorphic, the somatype that dominates strength competitions. Having a long torso with shorter limbs and more type I than type II fibers, they would then be able to lift more, especially since these competitors keep a high body fat percentage. Again, like with East Asians, there is a biomechanical advantage here and due to their higher levels of body fat and endomorphic somatype along with shorter limbs, they would be able to move more weight on the squat, especially more than African-Americans. Biomechanics is key when it comes to evaluating different groups’ morphology when attempting to see who would be stronger on average.
Deadlift
East Asians
The deadlift is pretty straightforward: bending down and deadlifting the weight off of the ground. Key anatomic differences between the races dictate who would be better here. East Asians, with shorter limbs and a longer torso the bar has to travel a further path, compared to someone with longer limbs and shorter torso. Though, someone with short limbs and a short torso would also have a biomechanical advantage in pulling, it is nothing like if one has long arms and a short torso.
African-Americans
Here is where they would shine. Their anatomy is perfect for this lift. Since they have longer limbs and a shorter torso, the bar has a shorter path to travel to reach the endpoint of the lift. At the set-up of the lift, they already have a biomechanical advantage and they can generate more power in the lift due to their leverage advantage. The deadlift favors people with a long torso, short femurs, and long arms, and so it would favor African-Americans. (Their long arms off-sets their short torsos, though the bar would still have to travel further, they still would have the ability to move more weight.)
European Americans
European Americans would have the same biomechanical problems as East Asians, but not as much since they have a taller stature. It is well-known in the world of weightlifting that having shorter, ‘T-rex arms’ impedes strength on the lift, since speaking from an anatomic viewpoint, they are just not built for it. No style of deadlift (the sumo or conventional) suits people with short arms, and so they are already at a biomechanical disadvantage. Relative to African-Americans, European Americans have ‘T-rex arms’ and therefore they would suffer at pulling exercises—deadlift included.
Overhead press
East Asians
The overhead press is where people with shorter arms would excel. Thus, East Asians would be extremely strong pushers. Say the bar starts at the top of their chest, the path of the bar to the lockout would be shorter than if someone had longer arms. The size of the trapezius muscles also comes into play here, and people with larger trapezius muscles have a stronger press. The East Asians short stature and therefore shorter limbs is perfect for this lift and why they would excel.
African-Americans
African-Americans would suffer at the overhead press for one reason: their long limbs, mainly their arms. The bar has a further path to travel and thus strength would be impeded. Indeed, people not built for pressing have long arms, long torsos, and long legs. Performing the full range of motion, African-Americans would have less strength than East Asians and European Americans.
European Americans
Again, due to similar morphology as East Asians, they, too, would excel at this lift. Since the lift is completed when the arms lock out, those with shorter arms would be able to move more weight and so what hurts them on the deadlift helps on pressing movements like the overhead press.
Bench press
East Asians
Lastly, the bench press. East Asians would excel here as well since they have shorter arms and the bar would have a shorter path to travel. Notice anything with bar movement? That’s a key to see which group would be stronger on average: looking at the average morphology of the races and then thinking about how the lift is performed, you can estimate who would be good at which lift and why. The bench press would favor someone with a shorter stature and arms, and they’d be able to lift more weight. (I personally have long arms compared to my body and my bench press suffers compared to my deadlift.) However, Caruso et al (2012) found that body mass is a more important predictor of who would excel at the bench press. East Asians have a higher body fat percentage, and therefore would be stronger on average in the lift.
African Americans
Here, too, African-Americans will suffer. Like with the overhead press, the bar has a further path to travel. They also have less body fat on average and that would also have the bar travel more, having the individual put more exertion into the lift compared to someone who had shorter arms. The longer your arms are in a pushing exercise, the further the bar has to travel until lockout. Thus you can see that people with longer arms would suffer in the strength department compared to people with shorter arms, but this is reversed for pulling exercises like the deadlift described above. (There is also a specific longitudinal study on black-white differences in bench press which I will cover in the ‘Objections‘ section.)
European Americans
Again, like with East Asians due to similar somatype, European Americans, too, would excel at this lift. They are able to generate more pound-for-pound power in the lift. The bar also has a shorter path to travel and since the people who compete in these competitions also have higher levels of body fat, then the bar has less of a distance to travel, thus increasing the amount of force the muscle can generate. Limb size/body mass/somatype predict how races/individuals would do on specific lifts.
Objections
One of the main objections that some may have is that one longitudinal study on black and white police officers found that blacks were stronger than whites at the end of the study (Boyce et al, 2014). However, I heavily criticized this paper at the beginning of the year and for good reason: heights of the officers weren’t reported (which is not the fault of the researchers but of an ongoing lawsuit at that department since people complained that they were discriminating against people based on height). The paper is highly flawed, but looking at it on face value someone who does not have the requisite knowledge they would accept the paper’s conclusions at face value. One of the main reasons for my criticism of the paper is that the bench press was tested on a Smith machine, not a barbell bench press. Bench pressing on the Smith machine decreases stability in the biceps brachii (Saterbakken et al, 2011) but there is similar muscle recovery between different bench presses in trained men (Smith, barbell, and dumbbell) (Ferreira et al, 2016). This does not affect my overall critique of Boyce et al (2014) however, since you can move more weight than you would normally be able to, along with the machine being on one plane of motion so everyone has to attempt to get into the same position to do the lift and we know how that is ridiculous due to individual differences in morphology.
Some may point to hand-grip tests, which I have written about in the past, and state that ‘blacks are stronger’ based on hand-grip tests. Just by looking at the raw numbers you’d say that blacks had a stronger grip. However, to get an idea of the strength differences pound-for-pound there is a simple formula: weight lifted/bodyweight=how strong one is pound-for-pound on a certain exercise. So using the values from Araujo et al (2010), for blacks we have a grip strength of 89.826 with an average weight of 193 pounds. Therefore pound-for-pound strength comes out to .456. On the other hand, for Europeans, they had an average grip strength of 88.528 pounds with an average weight of 196 pounds, so their pound-for-pound grip strength is about .452, which, just like African-Americans is almost half of their body weight. One must also keep in mind that these hand-grip studies are done on older populations. I have yet to come across any studies on younger populations that use the big four lifts described in this article and seeing who is stronger, so inferences are all that we have.
Further, Thorpe et al (2016) also show how there is an association between household income and grip-strength—people who live in homes with higher incomes have a stronger grip, with blacks having a stronger grip than whites. Thorpe et al (2016) showed that black women had a stronger grip strength than white women, whereas for black men they only had a stronger grip than white men at the highest SES percentile. This could imply nutrient deficiencies driving down their ability for increases grip strength, which is a viable hypothesis. Although Thorpe et al (2016) showed that black men had a stronger grip strength, these results conflict with Haas, Krueger, and Rohlfson (2012) though the disparities can be explained by the age of both cohorts.
Nevertheless, grip strength—as well as overall strength—is related to a higher life expectancy (Ruiz et al, 2008; Volkalis, Haille, and Meisinger, 2015). If blacks were stronger—and this is being debated with studies like hand-grip—then we should expect to see black men living longer than white men, however, we see the opposite. Black men die earlier than white men, and it just so happens that the diseases that are correlated with strength and mortality are diseases that blacks are more likely to get over whites. One should think about this if they’re entertaining the idea that blacks have an inherent strength advantage over whites.
Others may argue that since chimpanzees have a higher proportion of type II fibers and that’s one reason why they are stronger than us by 1.35 times (O’Neill et al, 2017) and have the ability to rip our faces off. Of course, other factors are at play here other than the chimps’ fast twitch fiber content. Of course, one must also think of the chimpanzee’s way smaller stature when discussing their overall strength. It’s not just their type II fibers, but how much smaller they are which gives them the ability to generate more force pound-for-pound in comparison to humans. So this is a bad example to attempt to show that blacks are stronger than whites based solely on the composition of the muscle fibers.
Finally, back in July I argued that Neanderthals would be stronger than Homo sapiens due to their morphology and a wide waist. This, of course, has implications for strength differences between the races. People with a wider waist would have the ability to generate more power. Blacks have a higher center of gravity due to longer limbs whereas whites and Asians have lower centers of gravity due to a longer torso. Along with climatic conditions, the Neanderthal diet also contributed to their wide waist and thorax, which would then help with strength. Therefore, this has implications for racial differences in strength. We can replace Europeans with Neanderthals and Homo sapiens with Africans and the relationship would still hold. This is yet more proof that blacks are not stronger than whites. This article also contributes to the argument I laid out in my article on how racial differences in muscle fiber typing predict differences in elite sporting competition. Morphology/somatype is the final piece of the puzzle; without the correct morphology, it’d be really hard for someone to become an elite athlete in a certain field if they do not have the correct morphology.
Conclusion
Looking at the big four lifts, the advantage goes to European Americans and East Asians. This is due to their average somatype and morphology. The only lift that Africans would excel at is the deadlift and this is due to their morphology—mainly their long arms. People with longer arms excel at pulling exercises whereas people with shorter arms excel at pushing exercises. Hand-grip strength studies show blacks having a higher grip strength than whites, however in one study if you see who is stronger pound-for-pound, the differences are insignificant. The longitudinal bench press study is highly flawed due to numerous confounds and is therefore unacceptable to assess strength and race. The fact that chimpanzees have a higher proportion of type II fibers compared to humans is also irrelevant. Chimpanzees have a smaller stature and they can, therefore, generate way more power pound-for-pound. Attempting to replace Africans with chimpanzees in this scenario doesn’t make sense because Africans have longer limbs than Europeans and would, therefore, generate less force pound-for-pound. Overall strength is related to mortality; stronger people live longer and have fewer maladies than weaker people. This too lends credence to my argument that whites are stronger than blacks.
Stress and Race Redux: A ‘Hispanic’ Paradox?
1500 words
American Renaissance published an article the other day titled “Is ‘Racism’ Killing Black People?” and, for the most part, I largely agree with it. However, there are a few faults in it that I need to address.
First, off, as the article rightly noted, it’s not only perceived ‘racism’ that is the cause for these health disparities, but stress from other blacks as well. Gregory Hood (the author of the AmRen article) cites a new study showing that blacks who move out of the ‘hood’ see a subsequent decrease in BP (Kershaw et al, 2017). They followed 2,290 people 974 were men and 1,306 were women. This is data collected from the CARDIA study which has helped us to understand racial disparities in all types of different health outcomes. Blacks who lived in high segregation neighborhoods had higher levels of SBP (systolic blood pressure), and saw a decrease in their SBP when they moved to less segregated neighborhoods. The authors conclude that “policies that reduce segregation may have meaningful health benefits.” What kind of policies will ‘reduce segregation’? Most races/ethnic groups group together in an area, so I don’t see how this would happen.
In regards to the argument on black maternal mortality and ‘racism’, I think it’s much more nuanced. Black women are 2 to 6 times more likely to die giving birth than white women; while the leading causes of maternal death in black women is pregnancy-induced hypertension, and embolism (Chang et al, 2003), though reasons for the mortality rate are not explainable at present (Flanders-Stepans, 2002). Further, in regards to preeclampasia, women who get pregnant at younger ages are more likely to acquire the disease while pregnant, and blacks and other non-whites are more likely to get pregnant at younger ages than whites (Main et al, 2015).
However, there are ways to reduce maternal mortality in black women. In a RCT undertaken between the years of 1990-2011 in Memphis, Tennesee, black women were followed with their live-in children and placed into one of four groups: “treatment 1 (transportation for prenatal care [n = 166]), treatment 2 (transportation plus developmental screening for infants and toddlers [n = 514]), treatment 3 (transportation plus prenatal/postpartum home visiting [n = 230]), and treatment 4 (transportation, screening, and prenatal, postpartum, and infant/toddler home visiting [n = 228])” (Olds et al, 2014). They conclude that pre- and post-natal care greatly reduces maternal/infant mortality in black women, “living in highly disadvantaged settings.”
Further, the racial disparity in post-term neonates is largely driven by “CHD among term infants with US-born mothers is driven predominately by the postneonatal survival disadvantage of African-American infants” (Collins et al, 2017). Though, as can be seen in the study by Olds et al (2014), pre- and post-natal care can greatly reduce both infant and maternal mortality.
Stress can also be measured in pregnant women by measuring the level of blood cortisol (Gillespie et al, 2017). They show that, independent of adulthood stress, stress during childhood may shape birth timing, with cortisol being the biological mediator. This may be an explanation for what Gregory Hood notes. He states in his article that there has to be an explanation for why black women birth earlier, and while I am sympathetic to biological models ala Rushton (1997), Gillespie et al (2017) drive a hard argument that stress during childhood using cortisol as a biological mediator makes a lot of sense.
There are a few studies that attest to pre- and post-natal care having a large effect on the morality of black women, and that having the carers being black women seems to have a positive effect (Guerra-Reyes and Hamilton, 2017). They conclude that “Recognition, support, and increasing the number of African-American midwives and birth assistants is vital in tackling health inequalities.” In regards to infant mortality rate (IMR), 18 states will achieve racial equality by 2050 if current trends from 1999-2013 hold (Joedrecka et al, 2017).
Now for the main reason I decided to write this: the ‘Hispanic’ paradox. This paradox is that for the past twenty years, ‘Hispanics’ with low SES have similar or better health outcomes than whites (Franzini, Ribble, and Keddie, 2001). However, more recent analyses show that the ‘Hispanic’ paradox does not exist, mostly due to methodological problems and migrant selectivity (Crimmins et al, 2007; Teruya and Bazargan-Hezeji, 2013) and was not noticed in Chile either (Cabiesies, Tunstall, and Pickett, 2013). There is no migrant selectivity in regards to smoking, however (Fenelon, 2013, 2016).
Teruya and Bazargan-Hezejie (2013) write:
Studies which advocate the validity of the Immigrant Paradox are countered by those which report specific, negative physical and mental health outcomes, and higher rates of substance use, especially among immigrant adolescents. Findings may also be compromised by fundamental methodological concerns such as migrant health selectivity, and approaches that consider only selectively healthy groups. Moreover, the Immigrant Paradox’s benefits do not appear to extend evenly and consistently to all races, ethnicities and subgroups. Similarly, the Hispanic Paradox does not protect consistently across all Latino ethnicities, age groups and genders, with Puerto Ricans and Cubans in particular found to enjoy fewer health advantages.
This is good evidence that the people who migrate to America are healthier, and that the symptoms of low SES show in their children, but not in them because they are a self-selected population. There is no ‘Hispanic’ paradox (Smith and Bradshaw, 2006; Schoenthaler, 2016). Even a new meta-analysis on this ‘paradox’ states “Immigrant children and youth suffer from an immigrant mortality disadvantage” (Shor, Roelfs, and Vamg, 2017).
Lastly, Gregory Hood brings up stress and suicide, stating that if blacks were really more stressed than whites then blacks would have higher rates of suicide, but some studies show that whites have a higher rate of suicidal ideation, while others do not show this (Perez-Rodriguez et al, 2010). Though, as Balis and Postolache (2010) show, studies show that while there is conflicting evidence in regards to racial/ethnic differences in suicide, whites still attempt it the most. However, suicide for young black Americans is on the rise. Ahmedani et al (2016) show that “Nearly 27% of White individuals made a mental health visit versus less than 20% of Asian, Hawaiian/Pacific Islander, and Black individuals in this period. Within 4 weeks, all visits and mental health visits remained most common for White individuals (67.3% and 47.4%, respectively) and least common among Asian individuals (52.8% and 31.9%, respectively). Within 52-weeks, more than 90% made any visit. Alaskan Native/Native American (81.5%) and White individuals (79.5%) made mental health visits 10–25% more often than other groups.” However, at least in Fulton County, Georgia, black suicide decedents were less likely to report depression than white suicide decedents (Abe et al, 2008).
However, for whites, as noted in this 1982 New York Times article, suicidal feelings “reflects feelings of loneliness and hopelessness, which can be greater factors as one grows older; for instance, after loved ones have died” whereas for older white men, loss of status may be a cause, which would not be that prevalent in lower SES ethnicities. The article seems to implicate loss of status as a main cause for higher rates of suicide in white Americans, and states that as other, lower SES ethnies attain higher status, that suicide rates would rise for them as well.
Another cause could be prescription drugs, for instance in the Northeast which has been hit hard by the opiate/heroin crisis which leads to more white deaths. Robert Putnam puts this on “the links between poverty, hopelessness and health” and states that the suicide rate has declined for two groups, black males and males over the age of 75. Further, “divorce, economic strain, or political repression are often characterized as suicide risks.” Cheng et al (2010) show that “A high level of identification with one’s ethnic group was associated with lower rates of suicide attempts.” So, it seems that if one keeps their status, and has a high level of identification with their ethnic group, whites would then be protected against suicidal ideation. Nonmetropolitan counties also have higher rates of suicide than metropolitan counties (Ivey-Stephenson et al, 2017). People who livee in rural counties are less likely to seek help for mental problems (Carpenter-Song and Snell-Rood, 2016). Whites are also more likely to live in rural areas. This could explain higher rates of suicide in whites, along with loss of status, depression and drug use.
In conclusion, the ‘Hispanic’ paradox doesn’t exist; whites attempt/commit suicide more due to loss of status and since most whites live in rural areas, they do not seek help for their mental health problems which then leads to suicide. In regards to black maternal mortality/infant mortality rates, if they have midwives present during and after the birth, mortality rates have decreased. If these trends continue, there will be racial equality in terms of maternal/infant mortality in 18 states. The AmRen article was good and well written, but there were a few huge flaws. The author assumed that since the ‘Hispanic paradox’ exists, that this should have one disregard the effects of, say, stress on blood pressure in black Americans, as I have discussed in the past. But since the ‘Hispanic’ paradox does not exist, then you cannot say that (perceived) discrimination and ‘racism’ is not a cause for higher rates of mortality in blacks compared to whites.
Race and Medicine: Is Race a Useful Category?
2450 words
The New York Times published an article on December the 8th titled What Doctors Should Ignore: Science has revealed how arbitrary racial categories are. Perhaps medicine will abandon them, too. It is an interesting article and while I do not agree with all of it, I do agree with some.
It starts off by talking about sickle cell anemia (SCA) and how was once thought of as a ‘black disease’ because blacks were, it seemed, the only ones who were getting the disease. I recall back in high-school having a Sicilian friend who said he ‘was black’ because Sicilians can get SCA which is ‘a black disease’, and this indicates ‘black genes’. However, when I grew up and actually learned a bit about race I learned that it was much more nuanced than that and that whether or not a population has SCA is not based on race, but is based on the climate/environment of the area which would breed mosquitoes which carry malaria. SCA still, to this day, remains a selective factor in the evolution of humans; malaria selects for the sickle cell trait (Elguero et al, 2015).
This is a good point brought up by the article: the assumption that SCA was a ‘black disease’ had us look over numerous non-blacks who had the sickle cell trait and could get the help they needed, when they were overlooked due to their race with the assumption that they did not have this so-called ‘black disease’. Though it is understandable why it got labeled ‘a black disease’; malaria is more prevalent near to the equator and people whose ancestors evolved there are more likely to carry the trait. In regards to SCA, it should be known that blacks are more likely to get SCA, but just because someone is black does not automatically mean that it is a foregone conclusion that one has the disease.
The article then goes on to state that the push to excise race from medicine may undermine a ‘social justice concept’: that is, the want to rid the medical establishment of so-called ‘unconscious bias’ that doctors have when dealing with minorities. Of course, I will not discount that this doesn’t have some effect—however small—on racial health disparities but I do not believe that the scope of the matter is as large as it is claimed to be. This is now causing medical professionals to integrate ‘unconscious bias training’, in the hopes of ridding doctors of bias—whether conscious or not—in the hopes to ameliorate racial health disparities. Maybe it will work, maybe it will not, but what I do know is that if you know someone’s race, you can use it as a roadmap to what diseases they may or may not have, what they may or may not be susceptible to and so on. Of course, only relying on one’s race as a single data point when you’re assessing someone’s possible health risks makes no sense at all.
The author then goes on to write that the terms ‘Negroid, Caucasoid, and Mongoloid’ were revealed as ‘arbitrary’ by modern genetic science. I wouldn’t say that; I would say, though, that modern genetic science has shown us the true extent of human variation, while also showing that humans cluster into 5 distinct geographic categories, which we can call ‘race’ (Rosenberg et al, 2002; but see Wills, 2017 for alternative view that the clusters identified by Rosenberg et al, 2002 are not races. I will cover this in the future). The author then, of course, goes on to use the continuum fallacy stating that since “there are few sharp divides where one set of traits ends and another begins“. A basic rebuttal would be, can you point out where red and orange are distinct? How about violet and blue? Blue and Cyan? Yellow and orange? When people commit the continuum fallacy then the only logical conclusion is that if races don’t exist because there are “few sharp divides where one set of traits ends and another begins“, then, logically speaking, colors don’t exist either because there are ‘few [if any] sharp divides‘ where one color ends and another begins.
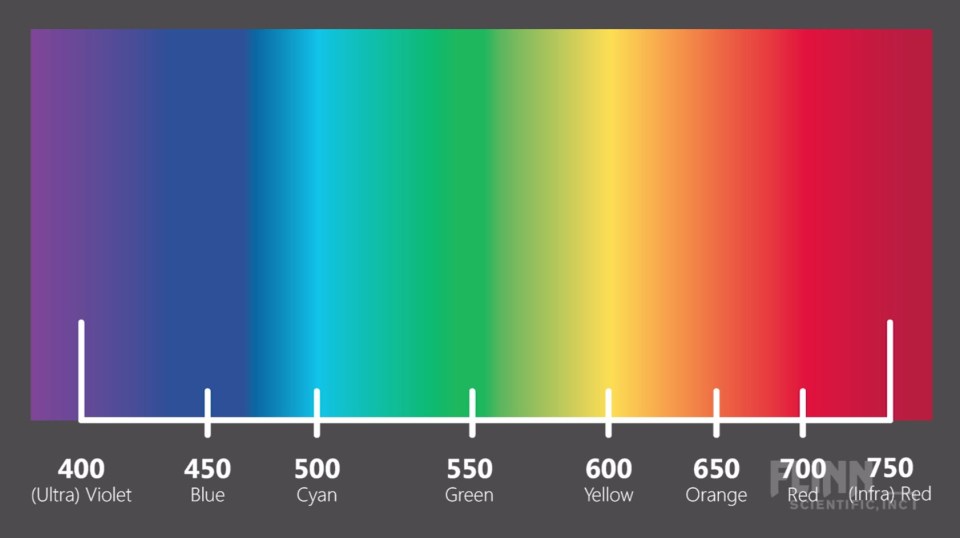
The author also cites geneticist Sarah Tishkoff who states that the human species is too young to have races as we define them. This is not true, as I have covered numerous times. The author then cites this study (Ng et al, 2008) in which Craig Venter’s genome was matched with the (in)famous [I love Watson] James Watson and focused on six genes that had to do with how people respond to antipsychotics, antidepressants, and other drugs. It was discovered that Venter had two of the ‘Caucasian’ variants whereas Watson carried variants more common in East Asians. Watson would have gotten the wrong medicine based on the assumption of his race and not on the predictive power of his own personal genome.
The author then talks about kidney disease and the fact that blacks are more likely to have it (Martins, Agodoa, and Norris, 2012). It was assumed that environmental factors caused the disparity of kidney disease in blacks when compared to whites, however then the APOL1 gene variant was discovered, which is related to worse kidney outcomes and is in higher frequencies in black Americans, even in blacks with well-controlled blood pressure (BP) (Parsa et al, 2013). The author then discusses that black kidneys were seen as ‘more prone to failure’ than white kidneys, but this is, so it’s said, due to that one specific gene variant and so, race shouldn’t be looked at in regards to kidney disease but individual genetic variation.
In one aspect of the medical community can using medicine based on one’s race help: prostate cancer. Black men are more likely to be afflicted with prostate cancer in comparison to whites (Odedina et al, 2009; Bhardwaj et al, 2017) with it even being proposed that black men should get separate prostate screenings to save more lives (Shenoy et al, 2016). Then he writes that we still don’t know the genes responsible, however, I have argued in the past that diet explains a large amount—if not all of the variance. (It’s not testosterone that causes it like Ross et al, 1986 believe).
The author then discusses another medical professional who argues that racial health disparities come down to the social environment. Things like BP could—most definitely—be driven by the social environment. It is assumed that the darker one’s skin is, the higher chance they have to have high BP—though this is not the case for Africans in Africa so this is clearly an American-only problem. I could conjure up one explanation: the darker the individual, the more likely he is to believe he is being ‘pre-judged’ which then affects his state of mind and has his BP rise. I discussed this shortly in my previous article Black-White Differences in Physiology. Williams (1992) reviewed evidence that social, not genetic, factors are responsible for BP differences between blacks and whites. He reviews one study showing that BP is higher in lower SES, darker-skinned blacks in comparison to higher SES blacks whereas for blacks with higher SES no effect was noticed (Klag et al, 1991). Sweet et al (2007) showed that for lighter-skinned blacks, as SES rose BP decreased while for darker-skinned blacks BP increased as SES did while implicating factors like ‘racism’ as the ultimate causes.
There is evidence for the effect of psychosocial factors and BP (Marmot, 1985). In a 2014 review of the literature, Cuffee et al (2014) identify less sleep—along with other psychosocial factors—as another cause of higher BP. It just so happens that blacks average about one hour of sleep less than whites. This could cause a lot of the variation in BP differences between the races, so clearly in the case of this variable, it is useful to know one’s race, along with their SES. Keep in mind that any actual ‘racism’ doesn’t have to occur; the person only ‘needs to perceive it’, and their blood BP will rise in response to the perceived ‘racism’ (Krieger and Sidney, 1996). Harburg et al (1978) write in regards to Detroit blacks:
For 35 blacks whose fathers were from the West Indies, pressures were higher than those with American-born fathers. These findings suggest that varied gene mixtures may be related to blood pressure levels and that skin color, an indicator of possible metabolic significance, combines with socially induced stress to induce higher blood pressures in lower class American blacks.
Langford (1981) shows that when SES differences are taken into account that the black-white BP disparity vanishes. So there seems to be good evidence for the hypothesis that psychosocial factors, sleep deprivation, diet and ‘perceived discrimination’ (whether real or imagined) can explain a lot of this gap so race and SES need to be looked at when BP is taken into account. These things are easily changeable; educate people on good diets, teach people that, in most cases, no, people are not being ‘racist’ against you. That’s really what it is. This effect holds more for darker-skinned, lower-class blacks. And while I don’t deny a small part of this could be due to genetic factors, the physiology of the heart and how BP is regulated by even perceptions is pretty powerful and could have a lot of explanatory power for numerous physiological differences between races and ethnic groups.
Krieger (1990) states that in black women—not in white women—“internalized response to unfair treatment, plus non-reporting of race and gender discrimination, may constitute risk factors for high blood pressure among black women“. This could come into play in regards to black-white female differences in BP. Thomson and Lip (2005) show that “environmental influence and psychosocial factors may play a more important role than is widely accepted” in hypertension but “There remain many uncertainties to the relative importance and contribution of environmental versus genetic influences on the development of blood pressure – there is more than likely an influence from both. However, there is now evidence to necessitate increased attention in examining the non-genetic influences on blood pressure …” With how our physiology evolved to respond to environmental stimuli and respond in real time to perceived threats, it is no wonder that these types of ‘perceived discrimination’ causes higher BP in certain groups with lower SES.
Wilson (1988) implicates salt as the reason why blacks have higher BP than whites. High salt intake could affect the body’s metabolism by causing salt retention which influences blood plasma volume, cardiac output. However, whites have a higher salt intake than blacks, but blacks still ate twice the recommended amounts from the dietary guidelines (all ethnic subgroups they analyzed from America over-consumed salt as well) (Fulgoni et al, 2014). Blacks are also more ‘salt-sensitive’ than whites (Sowers et al 1988; Schmidlin et al, 2009; Sanada, Jones, and Jose, 2014) which is also heritable in blacks (Svetke, McKeown, and Wilson, 1996). A slavery hypothesis does exist to explain higher rates of hypertension in blacks, citing salt deficiency in the parts of Africa that supplied the slaves to the Americas, to the trauma of the slave trade and slavery in America. However, historical evidence does not show this to be the case because “There is no evidence that diet or the resulting patterns of disease and demography among slaves in the American South were significantly different from those of other poor southerners” (Curtin, 1992) whereas Campese (1996) hypothesizes that blacks are more likely to get hypertension because they evolved in an area with low salt.
The NYT article concludes:
Science seeks to categorize nature, to sort it into discrete groupings to better understand it. That is one way to comprehend the race concept: as an honest scientific attempt to understand human variation. The problem is, the concept is imprecise. It has repeatedly slid toward pseudoscience and has become a major divider of humanity. Now, at a time when we desperately need ways to come together, there are scientists — intellectual descendants of the very people who helped give us the race concept — who want to retire it.
Race is a useful concept. Whether in medicine, population genetics, psychology, evolution, physiology, etc it can elucidate a lot of causes for differences between races and ethnic groups—whether or not they are genetic or psychosocial in nature. That just attests to both the power of suggestion along with psychosocial factors in regards to racial differences in physiological factors.
Finally let’s see what the literature says about race in medicine. Bonham et al (2009) showed that both black and white doctors concluded that race is medically relevant but couldn’t decide why however they did state that genetics did not explain most of the disparity in relation to race and disease aside from the obvious disorders like Tay Sachs and sickle cell anemia. Philosophers accept the usefulness of race in the biomedical sciences (Andreason, 2009; Efstathiou, 2012; Hardimon, 2013; Winther, Millstein, and Nielsen, 2015; Hardimon, 2017) whereas Risch et al (2002) and Tang et al (2002) concur that race is useful in the biomedical sciences. (See also Dorothy Roberts’ Ted Talk The problem with race-based medicine which I will cover in the future). Richard Lewontin, naturally, has hang-ups here but his contentions are taken care of above. Even if race were a ‘social construct‘, as Lewontin says, it would still be useful in a biomedical sense; but since there are differences between races/ethnic groups then they most definitely are useful in a biomedical sense, even if at the end of the day individual variation matters more than racial variation. Just knowing someone’s race and SES, for instance, can tell you a lot about possible maladies they may have, even if, utltimately, individual differences in physiology and anatomy matter more in regards to the biomedical context.
In conclusion, race is most definitely a useful concept in medicine, whether race is a ‘social construct’ or not. Just using Michael Hardimon’s race concepts, for instance, shows that race is extremely useful in the biomedical context, despite what naysayers may say. Yes, individual differences in anatomy and physiology trump racial differences, but just knowing a few things like race and SES can tell a lot about a particular person, for instance with blood pressure, resting metabolic rate, and so on. Denying that race is a useful concept in the biomedical sciences will lead to more—not less—racial health disparities, which is ironic because that’s exactly what race-deniers do not want. They will have to accept a race concept, and they would accept Hardimon’s socialrace concept because that still allows it to be a ‘social construct’ while acknowledging that race and psychosocial factors interact to cause higher physiological variables. Race is a useful concept in medicine, and if the medical establishment wants to save more lives and actually end the racial disparities in health then they should acknowledge the reality of race.
Rebutting Ross et al (1986) on Testosterone
1300 words
Ross et al (1986) is one of the most oft-cited papers that HBDers use to attempt to show that blacks have higher levels of testosterone than whites, which then—supposedly—goes on to explain higher rates of crime, aggression, and prostate cancer. However, people 1) say this only from reading the abstract (and not reading the full paper) and 2) even if they could read the paper they would not know where the flaws were to point them out and discredit the study based on flawed methodology. I see this study getting cited every now-and-then and I’m sick of seeing it.
Ross et al (1986: 45) state that they “recently reviewed the evidence that endogenous levels of certain steroid and polypeptide hormones are causally related to a group of human cancers, including cancer of the prostate gland.” I’ve shown how even injecting a man with exogenous testosterone does not worsen his prostate cancer (Eisenberg et al, 2015; Boyle et al, 2016) and testosterone doesn’t cause prostate cancer (Stattin et al, 2003; Michaud, Billups, and Partin, 2015). So this has been falsified. Even if blacks had the testosterone levels that they claimed it still would not cause higher rates of PCa (prostate cancer) incidence.
They solicited study participants from two colleges around the Los Angeles metro area. The two universities they got their sample from were the University of Southern California and California State University of Los Angeles. They recruited individuals through postings on the school bulletin board in in the school newspaper. They got 50 blacks and 50 whites. They then write something that’s troubling to me: “A convenient time for blood collection was arranged, and students were met by a nurse epidemiologist (R. H.) at either the Student Health Center or another mutually convenient location” (Ross et al, 1986: 45). This is dumb. The students were assayed at all times between 10 am and 3 pm; testosterone levels are highest at 8 am though one study on older men shows that assaying between 8 am and 2 pm doesn’t matter (Crawford et al, 2015). However, for the purposes of discussing this paper this is irrelevant.
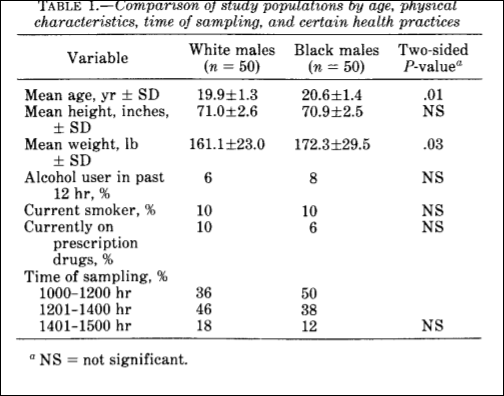
Table 1 from Ross et al (1986) tells us a lot about the flaws in the study—most importantly, the assay times. A majority were assayed between 10 am and 2 pm—which would depress testosterone though people assayed nearer to 10 am would have higher levels than people assayed nearer to 2 pm. Alcohol consumption only decreases testosterone while drunk, and a majority of the cohort did not consume alcohol within 12 hours of being assayed.
They come to the conclusion that the mean total testosterone level was 19 percent higher than whites whereas free testosterone was 21 percent higher. In regard to the assay collection times, Ross et al (1986: 47) write:
There was a negative correlation between time of sampling (No. of min elapsed since 0600 hr) and testosterone levels for whites (r=-O.4I) but not for blacks (r = -0.08). Adjustment for this variable caused a small reduction in geometric mean differences in levels of testosterone and free testosterone between blacks and whites. After simultaneous adjustment by analysis of covariance for time of sampling and age, weight, alcohol use, smoking, and use of prescription drugs, there
remained a 15% difference in total testosterone levels and a 13% difference in free testosterone levels between blacks and whites.
Even though they ‘adjusted for this variable’, it’s still a huge confound. Testosterone assays must be taken nearer to 8 am; the fact that people were assayed all over the place in the span of a 5 hour time period while testosterone levels decrease throughout the day is a huge red flag.
They then say that they are “uncertain why young black men have higher levels of circulating testosterone than white men“, though small sample sizes, a large range of variation in assay time, and a nonrepresentative sample is why. Other, more robust, analyses show a smaller ‘gap’, about 2.5 to 4.9 percent, favoring blacks (Richard et al, 2014). All in all, this study has huge flaws and should not be pointed to—especially today in 2017—because much larger analyses with much better methodologies have been carried out and some studies show no difference while others show a small difference favoring blacks but that still would not explain higher rates of testosterone, aggression and crime.
Ross et al (1986) is used by hereditarians such as Lynn (1990), Rushton (1997) and Hart (2007). Lynn (1990) states that these large testosterone differences discovered by Ross et al (1986) lend credence to Rushton’s r/K selection theory in which blacks have more children than whites who have more children than East Asians. Evidence for this assertion, states Lynn (1990) is the fact that blacks have higher rates of prostate cancer than whites who have higher levels of testosterone than East Asians, however this has been disproven by ethnicmuse.
Rushton (1997: 170) states that blacks had 19 percent higher levels of testosterone citing Ross et al (1986), however, Rushton didn’t cite the adjusted level which ended up being 15 percent, and, again, doesn’t mean anything to their hypothesis.
And Hart (2007) yet still repeats the same old stuff that “these differences in sexual behavior may be a consequence of the fact that blacks, on average, have higher levels of testosterone than whites“. These three researchers, clearly, are citing this study uncritically because it fits with their ‘racial hierarchy’. In fact, Rushton (1999) asked if testosterone was a ‘master switch’. In this paper, he cites Ellis and Nyborg (1992) who find that blacks had 3 percent higher levels of testosterone than whites. They gave the following values:
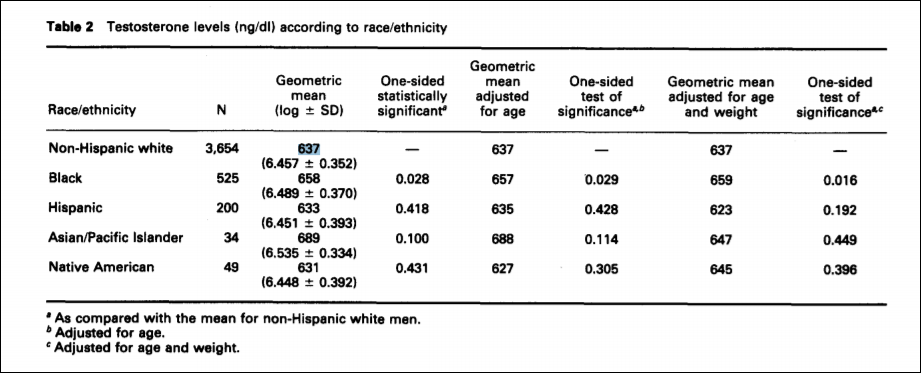
For the purposes of Rushton’s interpretation, writes Fish (2013), “These uncorrected figures are, of course, not consistent with their racial r- and K-continuum.” This, of course, is a big deal. Rushton cites this study as if it lends credence to his claims but it actually found the same result as Richard et al (2014). Thirty years after Ross et al (1986) we have numerous other studies showing a small gap between the races or no gap at all. We have numerous other studies showing that testosterone does not cause aggression, crime or violent behavior. However, people will still point to the abstract of Ross et al (1986) and think that they have proven that blacks have higher levels of testosterone than whites which proves how and why they have higher levels of testosterone, commit more crime and are all around more violent.
Though, as I have written about before, what Ross et al (1986) set out find the answer for (testosterone influencing higher levels of prostate cancer) can most definitely be explained by diet and lack of certain vitamins such as vitamin D, since low levels of this steroid hormone (it’s not a vitamin) cause prostate cancer (Schwartz and Hulka, 1990; Zhao and Feldman, 2001; Khan and Partin, 2004; Garland et al, 2006). Diet can explain a lot of the variation, as I have argued in the past.
In sum, Ross et al (1986) is the only study that I’ve found on racial testosterone differences that shows that extreme directionality favoring blacks over whites. This should set off some alarms in some people’s heads. People—psychologists included—need to learn about these hormones, how they’re produced in the body, and what they’re used for. Hormones don’t cause behavior, hormones influence behavior.
This fear of testosterone is largely overblown. We need testosterone for proper normal functioning. We need testosterone to be socially dominant; if you have lower levels you’ll be less socially dominant. This fear of testosterone—especially when it comes to race and it’s so-called causes—is largely pushed by Lynn, Rushton, Hart, and Ellis. I have spent a lot of time and thousands of words showing that they are wrong and testosterone is not a hormone to fear. It does not cause crime. It does not cause aggression. It does not cause prostate cancer. I’ve rebutted quite a few hereditarians on testosterone as well as testosterone and race, and if I come across more I will rebut them as well.
Musings on Testosterone and Race
1500 words
People don’t understand the relationship between testosterone, aggression, and crime. People hear the sensational media stating that testosterone causes crime, aggression, and anger. However, I have written numerous articles on this blog on the true nature of testosterone, what it’s really needed for and why we need it in high amounts. I’ve mused a lot on this hormone, which is one of my favorites to discuss due to the numerous misconceptions surrounding it.
Which way does causation run in regard to prisoners and their testosterone level?: heightened testosterone > aggression > violence or aggression > heightened testosterone > dominance > possibility (not necessarily, as I have written myself in the past) of violence.
People may use animal studies in support of their contention that testosterone causes aggressive behavior. However, for reasons I have discussed in the past, animal models only show avenues for future research and do not necessarily mean that this is the case for humans (as Mazur, 2006 point out). I don’t use animal studies. They’re good for future research, but to use them as evidence for causation in humans doesn’t make sense.
People may cite Dabbs et al showing that the more violent prisoners had higher levels of testosterone and therefore conclude that higher levels of testosterone drive the violent crime that they commit, however it is much more nuanced than that.
Does being a violent criminal raise testosterone or are violent people more likely to have high testosterone? Dabbs never untangles this; they just showed a correlation, which is small as evidenced by my other citations.
Testosterone is, as evidenced by numerous studies, related to dominance and dominance contests, however, during these dominance contests “a killing is rarely the outcome of a violent dominance contest” (Mazur, 2006: 25). Therefore, this throws a wrench in the testosterone-causes-crime hypothesis.
Some individuals may state that these dominance contests then lead to violence, however, as Mazur (2006) puts it: “Heightened testosterone is not a direct cause of male violence.”
Other animals assert dominance violently but we, necessarily, do not.
Mazur (2006) states that dominance contests rarely escalate to murder. Mazur also states that dominance contests also lead to increased T for the winners and decreased T for the losers, and these contests also don’t necessarily lead to murder/violent behavior. There is a feedback loop with high T causing behavior and behavior causing high T (Mazur, 2006) while this feedback loop may lead to “lethal effects” (Mazur and Booth, 2008).
It’s worth noting that Mazur seems to advocate for ‘testosterone-depressing drugs’. He concludes:
There are strong linkages between macro-level culture and the physiology of
individuals. We may find solutions to some of our social problems by altering these linkage.
Macro-level culture being white culture, black culture, Asian culture, etc.
The physiological differences are due to the preparation for dominance contests. So, his hypothesis goes, the culture of dominance among young black men with no education is why their T is so high. That low education was also associated with low education lends credence to the claim that this is changeable.
However, in his newer article on education, low testosterone and blacks he advocates for more sensible solutions (attempting an environmental change). I don’t know about you but I have big problems with using FDA/Big Pharma drugs to ‘reduce societal problems’, and it seems that Mazur has changed his view there. Mazur (2016) writes:
If high T does facilitate the high violence rate among young black men, there would be a troubling policy question of what, if anything, to do about it. Any notion of a medical or pharmaceutical fix, rather like prescribing Ritalin for hyperactivity, would reek of race-based chemical castration and should be regarded as outside the pale. However, social interventions might be workable and ethically acceptable.
I have railed against measures like this in the past, since proposing measures to attempt to ‘decrease crime through supposedly decreasing one of the main “causes”‘ is very Brave New World-ish, and I am highly against those measures. Social interventions are, in my view, the more sensible measures to undertake.
In regard to low education and testosterone, this same relationship was noticed by Assari, Caldwell, and Zimmerman (2014) where they note that testosterone was not associated with aggression in men, but low education was, which Mazur (2016) replicates, showing that blacks of the same age group with more education had lower levels of testosterone when compared to age-matched blacks. Mazur (2016) cites one study in support for his contention that education can decrease aggressive behavior (Carre et al, 2014)
The correlation is there, I agree. let’s take the middle value of .11 between Archer, Graham-Kevan, and Davies, 2005 at .08; and Book, Starzyk, and Quinsey, 2001 .14. So testosterone explains 3 percent of the the relationship with aggression. Not high at all.
Great evidence against the testosterone-causes-aggressive-behavior hypothesis are data on the Yanomami. About 50 percent of Yanomami men meet their deaths by other Yanomami men. So the Yanomami must have testosterone levels through the roof, right? Wrong. De Lima et al (2015) write:
We observed that Yanomamis present lower levels of testosterone (414 ng/dL) in relation to other ethnic groups (502/512 ng/dL), but still within normal limits (350-1000 ng/dL).
(Note that these values for “normal limits” changed, going into effect at the end of July.)
The Yanomami with an extremely high murder rate with nowhere near a modern society have T levels on the lower end of our range. So….. The Yanomami example is direct evidence against the assertion of testosterone directly causing crime, as some people assert (it is even evidence against an indirect cause). The evidence of the Yanomami having testosterone levels near our lower range is direct evidence against the testosterone/crime hypothesis. Clearly, other variables drive the high violence rate in this society that are not testosterone. More interestingly, these people have had little contact with Western societies, and their T levels are still low compared to ours despite constantly being vigilant for threats from other Yanomami.
Most dominance contests do not end violently in the first-world, there is numerous evidence to attest to this fact. So with the low correlation between testosterone and aggression (Book, Starzyk, and Quinsey, 2001; Archer, Graham-Kevan and Davies, 2005; Book and Quinsey, 2005), along with dominance contests rarely ending in murder/violent crime, then there are way more factors influencing these phenomena.
So the feedback loop goes: Testosterone rises in expectation of a challenge which then, after the dominance contest (which doesn’t always necessarily lead to violence), it affects both individuals differently depending on whether or not they won or lost that dominance contest and these values then persist over time if the dominance contests continuously end up the same.
Let’s say, for argument’s sake, that testosterone is a large cause for aggressive behavior in lower-educated blacks, what should be done about it? Mazur cites evidence that behavioral interventions seem to work to decrease violent behavior during certain circumstances (Carre et al, 2014), so that is a good way to lower violence in populations that have low education.
So heightened testosterone does lead to dominance which then facilitates a dominance contest between two individuals which does not necessarily lead to crime and aggressive, violent behavior (this outcome is rare in dominance contests among “higher primates” [Mazur’s words]) so, therefore, while testosterone does facilitate dominance contests, it rarely leads to violence in our species. Therefore, testosterone does not cause aggressive behavior and crime, but it does cause dominance which, for the most part, do not always result in violent, aggressive, murderous behavior.
I’ve shown that Mazur replicated other analyses that show that testosterone and aggressive behavior are related to lower education. Testosterone wasn’t associated with aggressive behavior in Assari, Caldwell, and Zimmerman’s (2014) study, and, as Mazur (2016) replicates, low education was. So one way to end this relationship is to educate people, as shown by Carre et al (2014), and with this education, crime will begin to fall. Heightened testosterone is not a direct cause of male violence.
(Note: I also believe that other factors such as sleep and depressed nutrition play a factor in crime, as well as racial differences in it. See Birch, 1972; Liu et al, 2003; Liu et al, 2004; Walker et al, 2007; Galler et al, 2011, 2012a, 2012b; Spratt et al, 2012; Gesch, 2013; Kuratko et al, 2013; Waber et al, 2014; Raine et al, 2015; Thompson et al, 2017 for more information, I will cover this in the future. I’m of course not daft enough to believe that no genetic differences between individuals/populations are the cause of a lot of crime between them, however, as I have laid out the case in regard to testosterone and MAOA numerous times, these two explanations for both individual differences in crime as well as racial differences in crime leave a lot to be desired. Other genetic factors, of course, influence these differences, however, I am only worried about refuting the popular notions of ‘testosterone and MAOA, the ‘warrior gene” cause crime. The relationship is a lot more nuanced as I have provided mountains of evidence for.)
