
North/South Differences in Italian IQ: Is Richard Lynn Right?
2300 words
Richard Lynn has stated that there are differences in Northern and Southern Italian IQ scores. Is he correct?
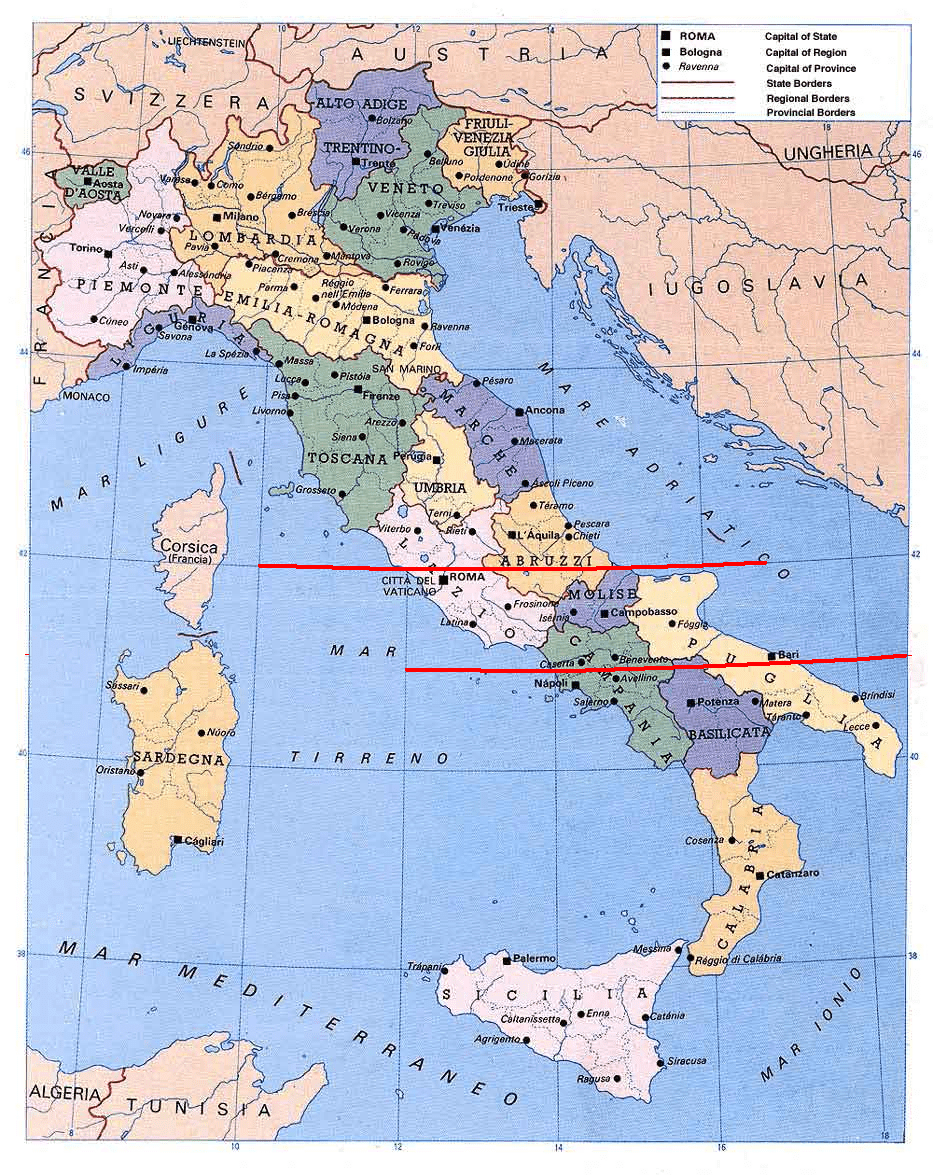
Lynn claims Italian IQ is 100 in the North and 90 in the South, with the lowest being IQ 89 in the Southern most part of Sicily.
Richard Lynn is of course, extremely controversial in his research areas of interest, mainly with his views on IQ and how it relates to the wealth of nations.
In his paper which talks about the North/South differences in IQ which predict differences in education, infant mortality, stature, and literacy.
Lynn’s methods were to take samples of the Program for International Student Assesment (PISA) which administers tests gauging the abilities of students in math, reading comprehension and science understanding. IQs were calculated by averaging science understanding, reading comprehension and mathematical ability, which the averages are expressed in SD unit deviations from the British PISA mean (n=502, SD 99). Figures are then converted to conventional IQs by multiplying them by 15. So the regional Italian IQs are expressed in comparison to the British IQ and SD (100 and 15 respectively).
His 10 data points are as follows:
First, the IQ in the northern regions of Italy measured by the PISA data is approximately 100 and therefore about the same as in Britain and other countries of northern and central Europe given in Lynn and Vanhanen (2002, 2006). This confirms the results of the standardization of the Colored Progressive Matrices in northern Italy reported by Prunetti (1985) and shows that IQs measured by the PISA data and by the Colored Progressive Matrices data are consistent. Regional IQs in Italy decline steadily through the central regions and into the south and reach a low of 89 in the most southerly region of Sicily. The first hypothesis of this study that there may be a north–south gradient of IQs in Italy is supported and quantified by the correlation of 0.963 between regional IQs and latitude.
First, the PISA data from 2013 shows Southern Italians scoring higher, and Northern Italians scoring around the same. Is that an increase in intelligence that happened in only 3 years? Did the genetics of Southern Italy change in 3 years? No.
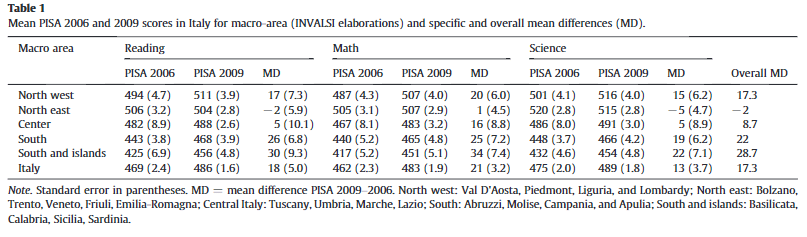
The table above shows the changes in PISA scores for Southern Italy in only 3 years for all 3 subjects tested in PISA. Southern Italy increased by 26 points in reading, and Southern Italy and islands increased by 30 points. For math, 25 for the South and 34 for South and the islands. For science, 18 for the South and 22 for the South and the islands. The presence of non-native students may also be a factor in these score differences. You can see the differences from 3 years, and how even in 3 years, there was a slight decrease in scores in Northern Italy. Migrants, after coming in from the South of the country, then continue to go into the Northern part of the country. This could also explain a huge part of the differences, seeing as they may be counted as Italian citizens, yet aren’t native to the country.
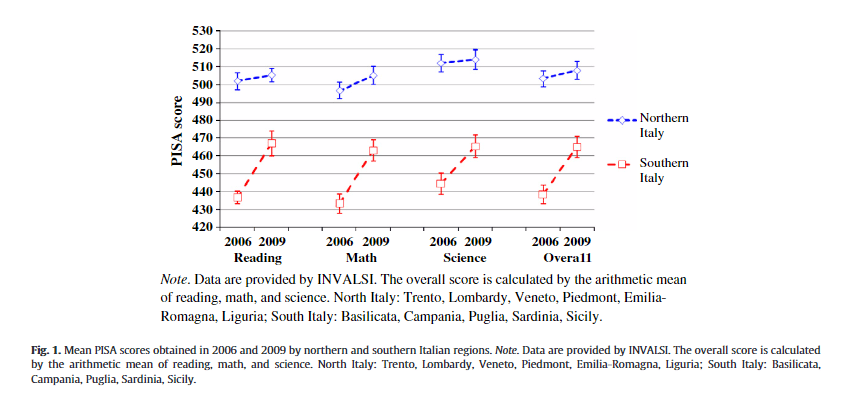
The above table shows mean PISA scores for 2006 and 2009, showing a huge increase in scores from Southern Italy, and hardly any increase in Northern Italy. Any genetic changes in 3 years to show that big of an increase?
Source: Problems in deriving Italian regional differences in intelligence from 2009 PISA data
Two, the second hypothesis of this study is that the north–south gradient of IQs in Italy may explain much of the difference in economic development between the north and south of Italy
Wrong again. Southern Italy has a huge underground economy, that isn’t noted on the books. The GDP in Southern Italy is far from accurate and employment figures do not match reality.
These raw figures require a closer look, because one economist’s analysis of Calabria found low pay, high unemployment, and a very high level of consumer spending. In 1994, the government insurance agency placed the number of business enterprises in Calabria at 23,758, while Istat, carrying out the 1996 census, found about 90,000 businesses in the same region.The economist Domenico Marino concluded, on the basis of 4,000 interviews in Calabria, that 75 percent of the Calabrian work force would refuse a fairly low-paying job, despite a very high official level of unemployment. In Calabria, with its dire employment figures, 84 percent of the families own their own home. What such anomalies must mean is that real income in Calabria is far higher than what is “on the books.” Many among the vast numbers of officially unemployed are, in fact, partly or fully employed. They are earning no social benefits, but they are earning the daily lire that keep their families afloat.
This massive sector skews all the statistics. It means that the GDP for the Italian South (and for Italy as a whole) is far from accurate. And the unemployment figures do not reflect reality.
LOOKING TO 2007: ITALY TIMES TWO
Three, the third hypothesis we set out to examine is that regional IQ differences in Italy are also manifest in variables that can be regarded as correlates or effects of IQs, including stature, infant mortality, literacy, and years of education
When historical data on those variables are used, a different picture emerges. Correlations are insignificant and in the case of infant mortality, do not the supposed link of regional differences in intelligence and socioeconomic development.
Four, per capita incomes are also highly negatively correlated with rates of infant mortality in 1954–57 (r= −0.652), and 1999–2002 (r=−0.823).
When the years 1911, 1891 and 1871 are averaged in, there is no difference.
Lynn didn’t consider the data from the 1860s to average it in with the rest of his data.
Five, the ability of populations with high IQs to give their children better nutrition makes them healthier, more resistant to disease and reduces the risk of mortality, and also improves their children’s stature
Right. But there is no mortality difference, as seen above.
Five, the ability of populations with high IQs to give their children better nutrition makes them healthier, more resistant to disease and reduces the risk of mortality, and also improves their children’s stature
There is a 1.7-inch difference between Northern and Southern Italian height. Which is explained by differences in nutrition between the regions, with the South having a more grain-based diet. Those effects are explained by a grain-based diet, and those Italians from America (which a huge majority are from the South of the country), actually show better educational attainment as well as more monetary success than their Northern counterparts.
Six, regional IQs in 2006 are highly correlated with the years of education of adults in 1951 (r=0.929), 1971 (r=0.871) and 2001 (r=0.886)
At the regional level, average IQs and current per capita GDP are highly related: for the year 2012, the correlation is 0.86. The link between IQ and regional development is, instead, much weaker when data for the years 1871, 1891 and 1911 are considered. Regional IQs and infant mortality rates in 1863–66 are positively correlated, contrarily to that which would be expected based on Lynn’s assumptions;
Two Italies? Genes, intelligence and the Italian North–South economic divide
This is explained simply. When Italy became unified in 1861, there were literacy differences in the country. 87 percent of the Southern population was illiterate in comparison to 67 percent of the Northern population.
The likely explanation for this high correlation is that the percentages of the population that were literate in 1880 was a function of IQs and therefore that the regional differences in IQs were present in 1880 and have been stable over the period 1880 to 2006.
Literacy and average years of schooling are better predictors of income levels than regional IQs.
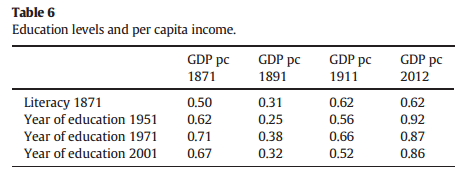
The above table shows this.
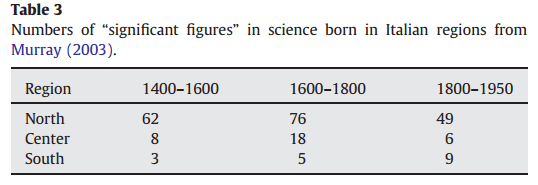
Eight, it is an interesting question whether the differences in Italian regional IQs were present in earlier historical periods. Some useful data bearing on this question have been assembled by Murray (2003, pp. 303–5) who has compiled the numbers of “significant figures” (i.e. those who have made significant contributions to science, literature, music and art) and their places of birth for the whole of Europe from the year 1400 to 1950. His figures for the north, center and south of Italy are shown in Table 3.
Pretty damning right? Wrong.
More than half of the country is put into the ‘North’ section of what he is talking about, and how he did the dividing, it looks like this.
Murray also said that achievement happened in a few places in Italy, with Southern Italy being one of the many areas in Europe with ‘low achievement’, which includes a big part of Northern Italy as well. The achievements in Italy were mainly found in Tuscany, which the literacy rate wasn’t too high in 1880. Again, refuting Lynn on his thesis.
Nine, Putnam (1993, p. 159) and Tabellini (2007) have proposed that “civic trust” is a determinant of regional differences in economic development in Italy and in western Europe.
There are hardly any regional differences in economic development, as seen above.
A possible explanation for the northern regions having had higher IQs than the southern regions at least from 1880 and possibly from 1400 to 1600 is that the populations of the north and south are genetically different and these genetic differences are related to differences in intelligence.
Not at all. I touched on this in my Refuting Afrocentrism: Are Italians Black? article.
They write of the population genetics of Italy that “northern Italy shows similarities with countries of central Europe, whereas central and southern Italy are more similar to Greece and other Mediterranean countries.
See above. They are genetically the same:
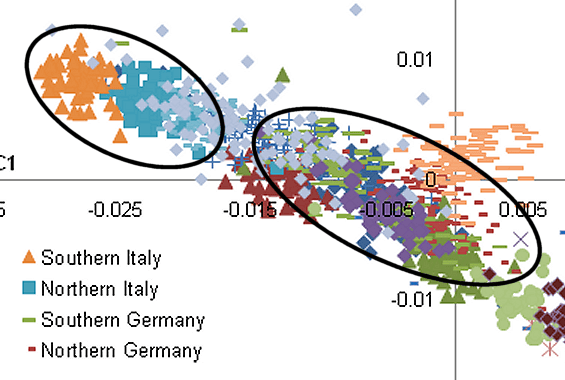
Comparison with Germany and Italy, Germans are spread out farther on the graph than are Italians, are there huge genetic differences with Germans as well?
They write of the population genetics of Italy that “northern Italy shows similarities with countries of central Europe, whereas central and southern Italy are more similar to Greece and other Mediterranean countries. This corresponds to the well-known differences in physical type (especially pigmentation and size) between the northern and north-central Italians on the one side and southern Italians on the other”.
Pigmentation is explained by getting the same UV rays as Northern Africa:

Size differences explained by slight differences in nutrition.
Subsequent studies have confirmed the genetic impact of immigration from the Near East and North Africa into southern Italy. For instance, the Taql, p1 2f2-8-kb allele has a high frequency in the Near East and North Africa (Morocco, 81.8; Lebanon, 43.7; Tunisia, 34.1). The allele is also present but at a lower frequency (26.4) in southern Italy, including Sicily.
Using a single, or small number of loci will lead to you finding the same loci in different populations? Who knew!!
The diffusion of genes from the Near East and North Africa may explain why the populations of southern Italy have IQs in the range of 89–92, intermediate between those of northern Italy and central and northern Europe (about 100) and those of the Near East and North Africa (in the range of 80–84) (these IQs are given in Lynn, 2006). This also explains the north–south gradient of IQ in Italy in which the regional IQs do not show a clear dichotomy between north and south but rather a gradient in which IQs decline steadily with more southerly latitude.
Nope. I’ve covered this in my ‘Black Italians’ article:
Combined data from two large mtDNA studies provides an estimate of non-Caucasoid maternal ancestry in Italians. The first study sampled 411 Italians from all over the country and found five South Asian M and East Asian D sequences (1.2%) and eight sub-Saharan African L sequences (1.9%). The second study sampled 465 Sicilians and detected ten M sequences (2.2%) and three L sequences (0.65%).This makes a total of 3% non-white maternal admixture (1.3% Asian and 1.7% African), which is very low and typical for European populations, since Pliss et al. 2005, e.g., observed 1.8% Asian admixture in Poles and 1.2% African admixture in Germans. (Plaza et al. 2003; Romano et al. 2003)
Similar data from the Y-chromosome reveals Italians’ even lower non-Caucasoid paternal admixture. Both studies obtained samples from all over the mainland and islands. No Asian DNA was detected anywhere, but a single sub-Saharan African E(xE3b) sequence was found in the first study’s sample of 416 (0.2%), and six were observed in the second study’s sample of 746 (0.8%). The total is therefore a minuscule 0.6%, which decreases to 0.4% if only Southern Italians are considered and 0% if only Sicilians are considered.Again, these are normal levels of admixture for European populations (e.g. Austrians were found to have 0.8% E(xE3b) by Brion et al. 2004). (Semino et al. 2004; Cruciani et al. 2004)
An analysis of 10 autosomal allele frequencies in Southern Europeans (including Italians, Sicilians and Sardinians) and various Middle Eastern/North African populations revealed a “line of sharp genetic change [that] runs from Gibraltar to Lebanon,” which has divided the Mediterranean into distinct northern and southern clusters since at least the Neolithic period. The authors conclude that “gene flow [across the sea] was more the exception than the rule,” attributing this result to “a joint product of initial geographic isolation and successive cultural divergence, leading to the origin of cultural barriers to population admixture.” (Simoni et al. 1999)
One of the most important citations is the Simoni et al. 1999 cite. Which says that gene flow across the sea was more the exception than the rule. Those 3 studies above refute any ‘racial differences’ between Northern and Southern Italians.
There are problems deriving Italian IQ from PISA test scores. You cannot take PISA data and infer a group’s IQ from it!! Moreover, on purer measures of intelligence, such as Raven’s Progressive Matrices, there is no significant difference between North and South children. These are differences in achievement, not intelligence. None of the studies cited by Lynn were aimed at comparing Italian IQ across regions and none of them used the same age groups!! This is why his data on Italian IQ is wrong.
To conclude, we don’t know the true IQs of all of the regions of Italy. Lynn used faulty measures to make his theory (which doesn’t need fluff) of north/south disparities in IQ more palatable. He’s been refuted multiple times on this matter. I may do another in the future.
Italianthro source: Refuting Richard Lynn’s IQ Study
Southern Italians and Ashkenazi Jews: What Is the Connection?
700 words.
It has been noted in many studies that there is a close genetic similarity between Ashkenazi Jews and Southern Italians/Greeks. Why such close genetic similarity?
First, some history on the Mediterranean. The Greeks colonized Italy, Sicily and territory up to the Black Sea coast. This is why Southern Italians and Greeks are genetically similar.
Where do Ashkenazi Jews fit in?
The four major founders of the Ashkenazi Jew population have ancestry in prehistoric Europe, and not the Caucus or the Near East. The four minor founders share a deep European ancestry. So with genetic testing, we can see that the majority of the Ashkenazi population didn’t have its origins in the Caucus or Levant, but through assimilation of Roman women who converted to Judaism.
Overall, it seems that at least 80% of Ashkenazi maternal ancestry is due to the assimilation of mtDNAs indigenous to Europe, most likely through conversion. The phylogenetic nesting patterns suggest that the most frequent of the Ashkenazi mtDNA lineages were assimilated in Western Europe, ~2 ka or slightly earlier. Some in particular, including N1b2, M1a1b, K1a9 and perhaps even the major K1a1b1, point to a north Mediterranean source. It seems likely that the major founders were the result of the earliest and presumably most profound wave of founder effects, from the Mediterranean northwards into central Europe, and that most of the minor founders were assimilated in west/central Europe within the last 1,500 years. The sharing of rarer lineages with Eastern European populations may indicate further assimilation in some cases, but can often be explained by exchange via intermarriage in the reverse direction.
Male Jews migrated from the Levant to Rome during Greco-Roman times, which mass conversions led to 6 million Roman women who then began to practice Judaism. The genetic proximity of Ashkenazi Jews and Syrian Jews to Northern Italians, Sardinians and French populations suggest that there is non-Semitic ancestry in Ashkenazi Jews. The findings also say that any theories of Ashkenazi Jews having ancestry in Khazaria or from Slavs are incompatible with genetic studies. The close genetic similarity of Ashkenazi Jews and Southern Europeans has been noted in many studies.
So we have male Jews from the Levant who trekked to Rome around Greco-Roman times. They took beautiful Roman women as wives, who then converted to Judaism. Which brings me to another point about Ashkenazi Jews.
Again, for anyone who thinks that Ashkenazi Jews have origins in Khazaria, and thus are not the ‘True Jews’, these studies definitively put that to rest.
It’s always said that Judaism is passed down through the mother to the child. Other sects of Judaism have it passed from father to child. So why the difference with Ashkenazi Jews?
I have a simple theory.
We know that the mother’s IQ is the most important predictor of the child’s IQ. That being said, why do Ashkenazi Jews say that Judaism passes from the mother to child?
My theory is this. Because IQ is passed from the mother to child, they say that ONLY Ashkenazi women can birth an Ashkenazi Jew. We know that since IQ passes from mother to child, that the reason for Judaism being passed like that is because it’s KNOWN that mother’s are the best predictor of intelligence.
So due to Jewish males migrating to Rome and courting and mating with beautiful Roman women who then converted to Judaism, this is where the Ashkenazi Jews get their intellect from.
We can see from the average IQs of Mizrahi and Sephardic Jews that their IQs average between 85 and 95, right around the average of the Middle East.
Reading up on Italian genetics, I always wondered why they are genetically similar. I always wondered why the Aquiline nose (Roman nose) is prevalent in both Italians and Ashkenazi Jews. Though, it looks better on Italians.
I posit the Ashkenazi Jews got their current intellect from breeding with Roman women. It makes sense, especially with what we know now about mother’s and child’s IQ. This is why Ashkenazi Jews ONLY come from those women who are Ashkenazi.
I will now end with posting pictures of beautiful Southern Italian women. Enjoy.


MILAN, ITALY – SEPTEMBER 14: Elisabetta Gregoracci attends a press conference for Italian TV show ‘The Apprentice’ on September 14, 2012, in Milan, Italy. (Photo by Pier Marco Tacca/Getty Images)

The definition of beauty is Southern Italian women.
Black Crime, Black Physical Attractiveness and Testosterone
I touched on black crime a bit a few months ago. I will now go more in depth on reasons for black crime.
First, what is the caused of all crime, no matter the race?
People have always said that parental socialization was the cause of black crime. But, genetic confounding was never considered in those studies. Kevin Beaver et al found in an analysis of adoptees that once genetic confounds were properly controlled, the effects of parenting on criminal justice measures were nonsignificant. That’s weird. I thought parental socialization was the cause of a kid turning out bad or good.
What is the cause of rape?
In a 37 year nationwide study in Sweden, it was found that sex offending runs in families. They reported strong evidence of familial clustering of sex offenses, mostly accounted for by genes and NOT shared environmental influences (ie, the same thing happening to both people in the family, therefore being the environmental cause of rape).
It’s of course genetics. We know that there is huge variation between individuals of the same race/ethnicity, how about between races? It also follows Rushton’s Rule of Three, Asians on top, whites intermediate and blacks on the bottom.
There are testosterone differences between blacks and whites. On top of those testosterone differences, men who stay and raise children have, on average, lower testosterone. This was noted in the West, but non-Western samples gave differing numbers. The study was conducted in two East African populations from Tanzania, Hadza foragers and Datoga pastoralists. They predicted that high levels of paternal care by the Hadza fathers would be associated with lower testosterone and that no difference would be found in non-fathers and fathers of Datoga men, who provide direct paternal care. The measurements in both populations confirmed the hypothesis, as well as adding further support that decreased testosterone leads to more paternal care.
What does that have to do with crime? Not having a father is detrimental to a young child, studies have shown in the UK that those from broken homes are more likely to commit crime than those from stable families. Also, seven out of ten offenders come from broken homes.
In this paper by Steven Ruggles, he says that analysis confirms that the high incidence of black Americans of single parenthood and children residing without their parents is not a recent phenomenon. Data shows that from 1880 through 1960, black children were two to three times more likely to reside without one or both children than white parents. This directly goes in the face of what liberals say is the cause of the demise of the black family structure. Ever since blacks have been free from slavery has this begun to happen.
Why did black father rates jump so much after the Civil Rights Movement?
I have my own theories.
Today, the black single mother rate is at 72 percent. In 1965, 24 percent of black infants were born without a father. What is the cause for that?
Blacks weren’t allowed to marry whites, and the CRA changed that. So with them being legally allowed to court white women, they obviously shied away from attempting to court black women. We can see that the trends show huge changes in 50 years. The cause is desegregation obviously, but what exactly is that environmental cause? Being able to court white women.
So with those men who DO stay around to raise children who show a decrease in testosterone, it’s extremely safe to say that those men who leave, regardless of race, have higher testosterone than those men who stay. This is reflected in racial single parent stats that show, again as for many more variables, Rushton’s Rule of Three.
What is wrong with black women? How come when segregation got lifted, black single motherhood rose exponentially?
Satoshi Kanazawa knows why. He noted in this study on why black women are not as attractive as other races, that women, on average are more physically attractive than men. EXCEPT BLACK WOMEN. The data shows black women as not being statistically different from the average, and far less attractive than whites, Asians and Native American women.
The cause is higher testosterone. Kanazawa says that the cause for this is due to the mean BMI of black women being 28.5 among black women and 26.1 among non-black women. Though he says that’s not the reason why black women are less physically attractive. Black women have lower levels of intellect net of BMI. Even the racial differences in intelligence don’t account for these differences. Black women are STILL less physically attractive, net of BMI and intelligence. Kanazawa says: “Net of intelligence, black men are significantly more physically attractive than nonblack men.”
Why is that? He says the reason is testosterone. He ends up concluding that testosterone differences are the only cause for these differences. With blacks having the highest testosterone out of all the races, black women obviously have higher rates of testosterone than white women. Those women with higher levels of testosterone have more masculine features, therefore making them less attractive.
Previous research has suggested that perceived attractiveness and personality are affected by the race such that White faces are more attractive but less masculine than Black faces. Such studies, however, have been based on very small stimulus sets. The current study investigated perceived attractiveness and personality for 600 Black, White and mixed-race faces. Many of the investigated personality traits were correlated with race when rated by White participants. Attractiveness specifically was greater for Black male faces than White male faces and among mixed-race faces. Blackness correlated with increased attractiveness. A reverse pattern was found for female faces with Whiteness being associated with attractiveness. The results are discussed in terms of the sexual dimorphism demonstrated in skin color. (Lewis 2010)
That’s the same as was noted in the Kanazawa paper. Darker-skinned males were more attractive, lighter-skinned women were more attractive.
Rushton wrote, in his last paper before his death, that skin color as a multi-generational adaptation to differences in climate over the past 70,000 years. He proposed life history theory (formerly known as r K selection theory) to explain the covariation found between human and non-human pigmentation and variables such as birth rate, infant mortality, longevity, the rate of HIV/AIDs and violent crime.
Dark skin is correlated with these things because of evolution.
High testosterone is linked to crimes of violence and sex. Men who gave saliva samples in prison were shown to violate more rules in prison, especially rules involving overt confrontation. Dabbs et al say: “the variety of rule violations suggests the behavior of high testosterone individuals reflects intractability, unmanageability, and lack of docility as well as aggression and violence.” Higher testosterone levels were associated with more violent crimes, parole board decisions against release, and more prison rule violations. This same thing was noticed in women, high-testosterone women had more crimes of unprovoked violence, increased number of prior charges, and decisions against parole.
For chronic adult offenders, the average IQ is 85, 1 SD below the mean of 100. Why do criminals have low IQ? Lack of abstract thought for one. Those with low IQ have a lack of ability to think of what their actions will do. Along with the lack of ability to delay gratification, paired with high testosterone and low IQ, that is the cause for higher than average crime in the black community in America.
Men with lower intelligence may be more likely to resort to evolutionarily familiar means of competition for resources and mating opportunities, and not to fully comprehend the consequences of their criminal behavior.
Even just a few points of IQ matter to criminality. There is a lot of data on the link between crime and low IQ. Who just so happens to have the lowest IQ in America on average?
It was noted in this study that states with lower IQs have more property crime and violent crime.
Increased intelligence is also linked to lower sex drive. I would reason that as shown above, those with higher IQs will be able to resist natural urges better than those with lower IQs. This shows in NLSY data with lower IQ people having more kids, higher IQ people fewer kids.
All of this data piles up, and the only thing that jumps out, is that lower IQ people have more testosterone, lower IQ people commit more crimes, therefore, high testosterone and low IQ is the cause of black criminality.
HBD and Diet Advice: Anglin Paleo Refutation Part 2
2300 words
A lot of people seem to have wrong views on nutrition. It’s not really taught in school, people think that it doesn’t matter so they do no independent research of their own and they believe anything and everything that comes out in the MSM as gospel. The thing is, the average person doesn’t read studies, or anything nutrition related for that matter, and believes most everything they read and hear in the MSM. I have talked about nutrition a bit here. I refuted Andrew Anglin’s atrocious writing and arguments for the Paleo Diet here and wrote on obesity and ethnicity including genetic and environmental causes. I also wrote on how nutrition is important prenatally as well as postnatally in developing children. I will also touch on comments in that Dailystormer article that jump out to me that need refuting.
Today I will talk about HBD and diet advice.
Steve Sailer wrote an article on HBD and Diet Advice back in September. He claims a few things that need to be disproven.
It’s common for nutrition scientists to give advice to white Americans based on studies done of what is good for nonwhites to eat. For example, in the 1980s, one of the most fashionable studies was of Japanese in Hawaii. The first generation ate mostly rice with little fat, and they had relatively few heart attacks. The next generation ate cheeseburgers and had higher rates of coronary disease than their parents.
I have covered this in the Dailystormer refutation.
Noted in this study are:
- High interpersonal variability in post-meal glucose observed in 800-person cohort
- Using personal and microbiome features enable accurate glucose response prediction
- Prediction is accurate and superior to common practice in an independent cohort
- Short-term personalized dietary interventions successfully lower post-meal glucose
You can see from the above bullet points that there is high interpersonal variability in post-meal glucose. What that means is, that between each individual in the cohort, there were different glucose spikes in each person.
They can accurately predict glucose response with certain tools. They devised a machine-learning algorithm that uses blood parameters, dietary habits, anthropometrics, physical activity, and gut microbiota measured in the cohort and showed that it accurately predicted personalized postprandial (post-meal) glycemic response to real-life meals.
They validated the prediction using a 100 person cohort.
Personalized dietary interventions showed interventions successfully lowered post-meal glucose. (Emphasis mine). This shows that each person should be on an individual diet and not on a one-size-fits-all diet.
Of course the next generation had higher rates of coronary disease than their parents. High carb, high fat diets lead to coronary blockage, leading to heart attacks and other coronary implications.
That is due to the demonization of fat starting in the 70s. We were told that fat is bad and carbs were fine. That turned out not to be the case. That’s what led to the obesity explosion. People think that eating fat “makes you fat”. Well if that’s the case, eating protein leads to kidney failure and eating carbs leads to Diabetes Mellitus. It’s stupid to think of it that way. Anything in excess is bad for you.
The RDA (Recommended Daily Values) for women is as follows:
69 grams of fat, which comes out to 585 kcal, 300 grams CHO which comes out to 1200 kcal and 53 grams of protein which comes out to 215 kcal. For men, it’s 80 grams of fat which comes out to 720 kcal, 375 grams CHO which comes out to 1500 kcal and 70 grams of protein which comes out to 280 kcal. This is data from the FDA on dietary recommendations for the average America.
Protein is nowhere near high enough. Protein is the main macronutrient you want to eat if you want to stay fuller longer as it has a higher TEF (Thermic Effect of Food). In the linked study, they come to the conclusion that TEF contributed to the satiating power of foods. Protein has the highest TEF of all of the macros, and because of this, some researchers have lobbied to have protein count as 3.2 kcal instead of 4 kcal. So if you want to stay fuller, eat more protein, fewer carbs and more fat. Carbs spike your insulin leading to insulin spikes, which lead to you feeling hungry sooner, as most people ingest fast digesting carbohydrates.
Sailer then cites this NYT article that says:
Today, at least 10 percent of Americans regularly take fish oil supplements. But recent trials have failed to confirm that the pills prevent heart attacks or stroke. And now the story has an intriguing new twist.
Wrong. So, so wrong. Controlled studies clearly show that omega-3 consumption had a positive influence on n-3 (fatty acid) intake. N-3 has also been recognized as a modulator of inflammation as well as the fact that omega-3 fatty acids down-regulate genes involved in chronic inflammation, which show that n-3 is may be good for atherosclerosis.
Studies have shown an increase in omega-3 consumption leads to decreased damage from heart attacks.
Omega-3 may also reduce damage after a stroke.
Dietary epidemiology has also shown a link between n-3 and mental disorders such as Alzheimers and depression. N-3 intake is also linked to intelligence, vision and mood. Infants who don’t get enough n-3 prenatally are at risk for developing vision and nerve problems. Other studies have shown n-3’s effects on tumors, in particular, breast, colon and prostate cancer.
Omega-3’s are also great for muscle growth. Omega-3 intake in obese individuals along with exercise show a speed up in fat-loss for that individual.
Where do these people get their information from? Not only are omega-3’s good for damage reduction after a stroke and a heart attack, they’re also good for muscle growth, breast, colon and prostate tumor reduction, infants deficient in omega-3 prenatally are at risk for developing nerve and vision problems. Increase in omega-3 consumption is also linked to increases in cognition, reduces chronic inflammation and is linked to lower instances of depression.
Omega-3’s are fine. As I said with the Anglin refutation, do not listen to those with no background in nutrition as they most likely have no idea what they are talking about.
Rasmus Nielsen, a geneticist at the University of California, Berkeley, and an author of the new study, said that the discovery raised questions about whether omega-3 fats really were protective for everyone, despite decades of health advice. “The same diet may have different effects on different people,” he said.
See above links on omega-3 intake and all of the positive/negative factors.
In the future, maybe you’ll be able to get your DNA analyzed and be given a list of diets in rank order of their likelihood that they will work for you. But, right now, you can still try different diets. In particular, ask your relatives about what has worked and not worked for them.
That doesn’t matter, as diets should be tailored to the individual, as seen in the Cell study.
Oh, wow. I just found that Anglin wrote a refutation to those who deny the Paleo Diet. Let’s see what that’s about.
And maybe these people have scientific research and/or personal experience to back up what they’re saying. I’m not insulting them for disagreeing with me on diet, that is clearly their right.
The evolutionary argument for Paleo does not line up with your statements. As I noted in my previous article, if you want to eat Paleo because it works with what you like to eat, good for you. But doing it for any magic benefits is stupid, as there are none.
I know for a fact that at least 9 out of 10 people who dare to take this challenge will report back positively if they follow it properly for a month, and this means a whole lot more than someone’s opinion about what it might or might not do, theoretically.
Want to know why people will report back positively? Any time you begin a new diet, especially one on a kcal restriction, your body will drop weight quickly. That’s what piranha personal trainers use on unknowing people. Telling them that they’re doing a “great job”, when in actuality, that happens to everyone who begins a new diet.
Instead, they are arguing theoretically, making highly debatable statements like “White people have evolved to be able to consume dairy products.”
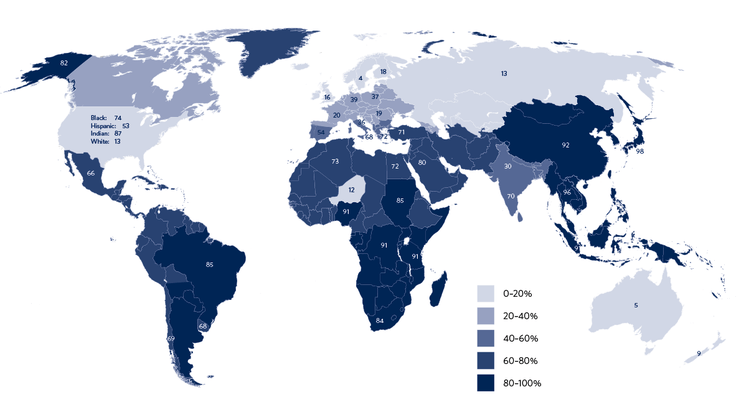
The above map shows lactose intolerance for countries around the world. Ancient Europeans began dairying around 7500 ya and were lactose intolerant when starting to drink milk. But along with faster evolution, which includes no gene flow from other parts of the world, that led to Europeans evolving to, on average, have lower rates of lactose intolerance.
People should really learn what they’re talking about before they say it.
The way to know whether or not they are beneficial is to quit them for a period and see how you feel.
Placebo effect.
Currently, because the scientific literature on these topics is so convoluted and debated on, there is no other conceivable way to prove it one way or another than through our own testing.
The science is pretty solid on this. Anecdotes don’t mean anything to studies.
Many have referred to paleo as a “fad diet.” And it may be a diet that is a fad, but it is also a diet with a thousands upon thousands of years long precedent. One might even suggest that it is the consumption of grains and dairy that are the “fad,” as it is a relatively new trend, in the scope of things.
It IS A FAD DIET ; with NO basis in science that Europeans should eat that way.
If you feel as if you are at peak physical health eating grains and dairy, and have no desire to spend time trying to improve on this, than by all means skip the challenge.
Is he implying that the Paleo Diet is the only diet that doesn’t allow grains and dairy? Not true at all. The Slow Carb Diet is the same, as well as any other high fat, high protein low-carb diet.
We should also note that the definitions of vegetarianism were different then, and Hitler did eat eggs and probably wasn’t completely meat-free.
That’s vegetarianism. Veganism is the more extreme one you’re thinking of where absolutely no animal products are consumed at all.
Vegetarian diets are shown to lead to vitamin inadequacies such as zinc, calcium, iron, manganese, selenium, and copper. Vegetarianism works, it just has to be well-planned. You need to make sure you get the right amount of essential as well as non-essential amino acids, high amounts of protein and make sure you’re not nutrient deficient.
Last time I wrote that White rice and potatoes are good carbs, but I want to be clear that they are not necessary unless you are both already at 5% body weight and you are highly active.
They are not ‘good carbs’. They are white carbs, which are bad for us if we don’t go to the gym to utilize the CHO being ingested. Five percent body-fat? That’s for competition bodybuilders and marathon and distance runners. The average person will never cut down to the level of body-fat. CHO is extremely useful if you’re highly active and go to the gym.
Even if you are not active, you need to consume a decent amount of carbs once a week in order to keep your metabolism from slowing down too much. However, it is probably preferable to use fruits for this purpose, as they contain more micronutrients.
Correct. If you eat a low-carb diet, you need a CHO refeed once a week to keep metabolism high. Though, using fruits is stupid. I know the Paleo thing, but there are many reasons why fructose (the sugar found in fruit) is bad for you. Sugar is just as addictive as cocaine. So telling the average person to ‘use fruits for this purpose’ is stupid, as the average person doesn’t know when to stop eating.
Yes, this diet will technically cost more than a processed foods and grain-based diet, all things being equal. The only reason anyone ever ate grains in the first place is because they were cheap, and processed foods were invented for the same reason. Any natural and healthy diet is going to cost more, all things being equal. However, things don’t have to be equal.
Wrong. Whole foods are not more expensive. The conclusion that was (obviously) reached is that there is expensive and non-expensive junk food as well as whole foods. I personally spend 70 dollars a week on food for myself, with all of my meals planned out. Natural diets will not cost more, all things being equal. If you know how to eat and how to buy food, you will avoid spending too much money.
I tried to answer most of the questions people had in the last thread, but it was so filled up with denialism I could have missed something. So ask here.
I hope you answer this, as well as my other refutation of your horrible nutrition article. I doubt it though.
How did we really evolve to eat?
The most common form of eating, 3 meals a day, is abnormal from an evolutionary perspective. We didn’t evolve eating 3 times a day. We evolved eating intermittently. The study says that intermittent energy restriction periods of up to 16 hours are fine. Long-term calorie restriction is highly effective in reducing the risk for atherosclerosis in humans. Again, another huge benefit for intermittent fasting. As the data comes out on human cohorts, we will be able to see all of the great effects that IF has for us, because that’s how any human population, no matter where they evolved, evolved eating.
There are beneficial effects to IF including reduced oxidative damage and increased cellular stress resistance. Rats put on an IF diet show heightened life-spans. IF is also extremely useful to keep a youthful brain as you age.
There are a mountain of studies that show how beneficial IF is to us and is the TRUE way humans evolved to eat, not any specialized diets. We evolved eating intermittently, and with our hedonistic society we live in now, along with low ability to delay gratification, as well as other factors I have covered in my previous nutrition articles, have led to the effects we see in America, and around the world today.
In conclusion, don’t listen to people who have no background in nutrition. They tell clearly wrong information, and those who aren’t privy to new information in the nutrition world, won’t know that they are being lied to and or manipulated into believing things based on shoddy evidence.
When Was Writing Invented?
Was writing first invented by the Sumerians? Before then? A lot of people seem to have misconceptions about what actually constitutes ‘writing’ and it’s predecessor ‘proto-writing’. Today I will touch on writing’s beginnings, as well as confusion of what writing is and is not.
Writing was first invented in Sumeria around 3200 B.C. What people confuse with writing is proto-writing, which is a precursor to writing. The word writing is defined as the activity of skill of marking coherent words on text. Therefor, proto-writing is not writing.
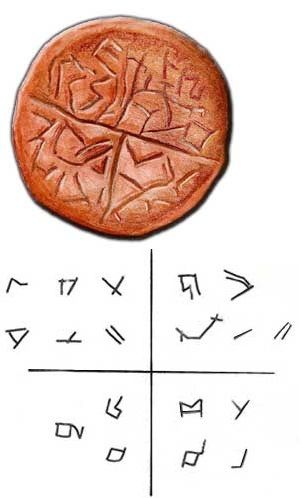
Above is a picture of the Karanovo Seal. People like to say that that denotes writing having it’s beginnings in Southeastern Europe in Romania around 7000 years ago. But that is proto-writing and not what we would call “writing” today. The Seal was made by the Vinca culture of Southeastern Europe. It is devoid of logograms, which is a written symbol representing an entire spoken word without expressing its pronunciation. The Seal is also of the Zodiac, and not any actual writing. It roughly matches up to the constellations when divided up in to four quadrants.

The Tartaria Tablets (which the Karanovo Seal is included with) were excavated in 1961 in Romania. People say that the above is writing. To quote Professor Colin Renfrew:
“To me, the comparison made between the signs on the Tărtăria tablets and those of proto-literate Sumeria carry very little weight. They are all simple pictographs, and a sign for a goat in one culture is bound to look much like the sign for a goat in another. To call these Balkan signs ‘writing’ is perhaps to imply that they had an independent significance of their own communicable to another person without oral contact. This I doubt.”
Steven Fischer writes in his book History of Writing:
The current opinion is that these earliest Balkan symbols appear to comprise a decorative or emblematic inventory with no immediate relation to articulate speech.
Proto-writing=/=writing. It doesn’t convey text and syllables and logographs. A logograph is 1 word represented by a single sign. For something to be classified as writing, it needs to have logograms and phonographs, which are signs holding purely phonetic or sound value.
The New World Encyclopedia says that those ‘writings’ cannot be called proper writing due to the fact that they are ancient traditions of symbol systems.
Now that we have a good understanding of proto-writing and what is and is not writing, lets touch on where writing was developed.
The five original writing systems were developed by the Sumerians of Mesopotamia, the Maya of Central America, the Ancient Egyptians of Egypt, the Dravidians of India and the Chinese of China. Though, the only remaining language in use is Chinese.
All five of the writing systems mentioned above use logograms, phonograms and syllables. All five of those writing systems can be spoken, which denote writing and language. The Tartaria Tablets, including the Koronovo Seal, cannot be spoken from, as the Seal is for the Zodiac and the Tablets are a form of proto-writing that cannot be spoken due to no logograms or phonograms.
Solutrean Hypothesis: Were the first peoples of the Americas from Spain?
Just like Afrocentrists have cockamamie theories, so do Eurocentrists. Some people believe that the first peoples of the Americas were the Solutreans, a stone age people from France and Spain who existed around 25 kya, and ended 16,500 ya. They would have had to cross 3000 miles of ice and water, does that seem possible 20 kya? Not at all.
The Solutrean Hypothesis first came about in the 30s by archaeologist Frank Hibben. He noted that the style of the spear tips the Solutreans used was like that of the Clovis culture in the Americas, who are the oldest culture on the continent. He said the tips bore an extremely strong resemblance to those from the Solutreans in Europe.
The points of the tips are different (diamond shaped, non-fluted vs concave bottoms, fluting). They also didn’t have boats to cross the ocean to reach the Americas.
From this Nature article, we can see that the genome of the Clovis people had direct ancestry to Native Americans:
An alternative, Solutrean, hypothesis posits that the Clovis predecessors emigrated from southwestern Europe during the Last Glacial Maximum4. Here we report the genome sequence of a male infant (Anzick-1) recovered from the Anzick burial site in western Montana. The human bones date to 10,705 ± 3514C years BP (approximately 12,707–12,556 calendar years BP) and were directly associated with Clovis tools. We sequenced the genome to an average depth of 14.4× and show that the gene flow from the Siberian Upper Palaeolithic Mal’ta population5 into Native American ancestors is also shared by the Anzick-1 individual and thus happened before 12,600 years BP.
Consistent with the population migration from Siberia into the Americas, as noted in this study. This study I will quote below also shows why some of the same alleles are found in both Europeans and Native Americans:
Y chromosomal DNA polymorphisms were used to investigate Pleistocene male migrations to the American continent. In a worldwide sample of 306 men, we obtained 32 haplotypes constructed with the variation found in 30 distinct polymorphic sites. The major Y haplotype present in most Native Americans was traced back to recent ancestors common with Siberians, namely, the Kets and Altaians from the Yenissey River Basin and Altai Mountains, respectively. Going further back, the next common ancestor gave rise also to Caucasoid Y chromosomes, probably from the central Eurasian region. This study, therefore, suggests a predominantly central Siberian origin for Native American paternal lineages for those who could have migrated to the Americas during the Upper Pleistocene.
And what do you know? There was this study proves the bolded text from the above study. That the Caucasoid Y chromosome comes from the central Eurasian region, which is where the Yamnaya came from, who populated Europe around 4500 years ago.
A study of the genetics of Kennewick man from Nature says:
We therefore conclude based on genetic comparisons that Kennewick Man shows continuity with Native North Americans over at least the last eight millennia.
That proves that Kennewick man was of Siberian origins, not European.
To round this up, some people like to say how some of the Natives have myths that a bearded white man came from across the Atlantic and gave them knowledge, who then left, promising to return. Then on the same day he promised he would return, was the day that Hernan Cortez landed at the Yucatan Penninsula. From their myths, they knew that the man was a god, because of his description.
People like to say that this myth proves Europeans crossing the ocean thousands of years ago to give knowledge to Native peoples of the Americas. Ridiculous, and here is why.
When the Aztec Empire fell, they needed a way to explain how their once great empire fell. So they then thought of the myth I described above. That the only way their civilization could have possibly fallen is only because of a god.
In conclusion, the Solutrean Hypothesis has no basis in genetics, paleoanthropology, and even basic common sense. Those who say that the Hypothesis is true are uneducated, and just like Afrocentrists, trying to push an untrue agenda.
Refuting Richard Nisbett
3100 words
The environmental model on IQ in the debate on not only IQ as a whole, but in racial differences in intelligence has led to horrible policies throughout the world. Thinking that we are all equal and everyone is the same and has the same potential as the next person has really hurt us as a society.
Richard Nisbett is of the egalitarian (nurture) side of the debate on the black-white IQ gap. His main research has focused primarily on how laypeople reason and make presumptions about the world. His more recent work has focused on comparing East Asians and Westerners, and how and if they think differently. He says that the arguments have been made that Westerners learn analytically, focusing on the object and its attributes, use its attributes to categorize it and apply rules based on the category to explain and predict behavior. He says that East Asians reason holistically, focusing on the object in its surrounding field. There is little concern with categories or universal rules and behavior is explained on the basis of the forces presumed to be operative for the individual case at that particular time. This goes with white’s higher verbal IQ, as well as going with East Asian’s higher visio-spatial IQ. He says that his lab has found evidence for both.
Now that there is some background on Nisbett and his research interests, let’s turn to the B-W IQ gap.
Rushton and Jensen have refuted him multiple times. In their paper Race and IQ: A Theory-Based Review of the Research in Richard Nisbett’s Intelligence and How to Get It, they provide more than sufficient evidence that the B-W IQ gap, as well as other racial differences in intelligence, are genetic in origin. They propose that the hereditarian model (50/50 genetics/culture) better explains group differences than the culture-only model (0/100 genetics environment). They review 14 topics of contention which are: (1) data to be explained; (2) malleability of IQ test scores; (3) culture-loaded versus g-loaded tests; (4) stereotype threat, caste, and “X” factors; (5) reaction-time measures; (6) within-race heritability; (7) between-race heritability; (8) subSaharan African IQ scores; (9) race differences in brain size; (10) sex differences in brain size; (11) trans-racial adoption studies; (12) racial admixture studies; (13) regression to the mean effects; and (14) human origins research and life-history traits. They conclude that the preponderance of evidence concludes that differences in intelligence, as well as other life-history traits between the races, are genetic (50 to 80 percent) in origin.
I will be quoting from this article Nisbett wrote for the New York Times, All Brains Are the Same Color.
JAMES WATSON, the 1962 Nobel laureate, recently asserted that he was “inherently gloomy about the prospect of Africa” and its citizens because “all our social policies are based on the fact that their intelligence is the same as ours — whereas all the testing says not really.”
Ah yes. What a great day that was when Watson said that. It needed to be said. The conversation on exactly why Africans are starving needs to be had. No, the answer is not colonialism. It’s intelligence. I’ve touched on how Kanazawa got attacked for stating that Africa’s woes are due to low intelligence, where the average is 70. Just as how Watson got attacked. Except since Watson is more well-known than Kanazawa, the PC crowd attempted to run him out of town. Watson is 100 percent correct with that statement.
Dr. Watson’s remarks created a huge stir because they implied that blacks were genetically inferior to whites, and the controversy resulted in his resignation as chancellor of Cold Spring Harbor Laboratory. But was he right? Is there a genetic difference between blacks and whites that condemns blacks in perpetuity to be less intelligent?
Blacks are genetically inferior to whites in intelligence, on average, just as West African blacks and their descendants are genetically superior in sprinting competitions and East Africans and their descendants are superior in distance running (the same as whites as both have the same muscle fiber type that allows for endurance running). Are we really to think that East Asians are superior nowhere? Clearly ridiculous. We know of Rushton’s Rule of Three, which holds through most all of the variables between races. Yes, there is a genetic difference in intelligence that will condemn blacks in perpetuity to be less intelligent.
The first notable public airing of the scientific question came in a 1969 article in The Harvard Educational Review by Arthur Jensen, a psychologist at the University of California, Berkeley. Dr. Jensen maintained that a 15-point difference in I.Q. between blacks and whites was mostly due to a genetic difference between the races that could never be erased. But his argument gave a misleading account of the evidence. And others who later made the same argument — Richard Herrnstein and Charles Murray in “The Bell Curve,” in 1994, for example, and just recently, William Saletan in a series of articles on Slate — have made the same mistake.
One of my favorite papers, the one that reignited the B-W IQ debate. Titled How Much Can We Boost IQ and Scholastic Achievement, he argues that scholastic achievement and IQ can’t be boosted to any meaningful level. He says prenatal effects such as nutrition, the length of pregnancy, maternal stress and environment within the uterus has an effect on IQ, whereas any postnatal (environmental) explanations have not been found to show a lowered IQ, except those kept in isolation. Let’s see what the ‘misleading account of the evidence’ he is talking about.
In fact, the evidence heavily favors the view that race differences in I.Q. are environmental in origin, not genetic.
See the Rushton and Jensen paper, as well as the Jensen paper I linked above. Any environmental explanation for racial differences in IQ can easily be explained away due to bad study design, or simply not testing the children again at adulthood, as any instances where blacks showed they had higher IQs than whites, they were never tested again at adulthood. Just so happens, that around age 10-12, where most of these tests get administered, is when the racial gap starts to become extremely noticeable. To think that race differences in IQ are environmental and not genetic is laughable.
The hereditarians begin with the assertion that 60 percent to 80 percent of variation in I.Q. is genetically determined. However, most estimates of heritability have been based almost exclusively on studies of middle-class groups. For the poor, a group that includes a substantial proportion of minorities, heritability of I.Q. is very low, in the range of 10 percent to 20 percent, according to recent research by Eric Turkheimer at the University of Virginia. This means that for the poor, improvements in environment have great potential to bring about increases in I.Q.
Rushton and Jensen state in the refutation of Nisbett I linked that non-white samples show the same heritabilities as white samples.There is little evidence of any cultural, or hardship differences, such as being raised as a visible minority, in one group and not the other. If blacks had heritabilities that were consistently lower than white heritabilities, then we could conclude that racism and poverty were responsible for a lower IQ in blacks. Though when a researcher compared black and white IQs on 3 tests, he found that heritabilities were 50 percent in each group. “The heritabilities in the Basic, Primary, and Cattell tests were, respectively: Whites—.61, .37, and .71; Blacks—.75, .42, and .19.”
On Turkheimer, they say that he was right that he did find gene x environment interactions that made genetic influences weaker and shared environment stronger for those from poorer homes in comparison to those from more affluent homes. Though most studies show no interaction effects, or interactions vary significantly.
Other studies have shown that heritabilities are the same both within as well as between white and black samples. That led Jensen to label this the ‘default hypothesis’. Researchers analyzed full and half siblings from the NLSY on three Peabody Achievement Tests. 161 black full siblings, 106 pairs of black half siblings, 314 pairs of full white siblings and 53 pairs of white half-siblings. with measures in math and reading. The best fitting model for all of the data was by which the sources of the sources of the differences between those within race and the differences between races were the same, at 50 percent genetic and environmental. The combined model (50/50) best explains it, whereas the culture-only and genetics-only models are inadequate.
In any case, the degree of heritability of a characteristic tells us nothing about how much the environment can affect it. Even when a trait is highly heritable (think of the height of corn plants), modifiability can also be great (think of the difference growing conditions can make).
Skewed perception on only working with young children. Heritabilities range from 20 percent to 90 percent from the time someone is a toddler to adulthood. He wouldn’t see the same in adult populations.
There is, for example, the evidence that brain size is correlated with intelligence, and that blacks have smaller brains than whites. But the brain size difference between men and women is substantially greater than that between blacks and whites, yet men and women score the same, on average, on I.Q. tests. Likewise, a group of people in a community in Ecuador have a genetic anomaly that produces extremely small head sizes — and hence brain sizes. Yet their intelligence is as high as that of their unaffected relatives.
Men and women don’t score the same on average. Rushton and Jackson found that on average, men had an edge on IQ tests, scoring 3.63 points higher than women. The people from Ecuador are dwarfs, encephalization quotient explains that, as well as brain size to non-fat mass being most important. Back to Rushton’s Rule of Three, East Asians have bigger brains and more neurons, whites intermediate and blacks last.
About 25 percent of the genes in the American black population are European, meaning that the genes of any individual can range from 100 percent African to mostly European. If European intelligence genes are superior, then blacks who have relatively more European genes ought to have higher I.Q.’s than those who have more African genes. But it turns out that skin color and “negroidness” of features — both measures of the degree of a black person’s European ancestry — are only weakly associated with I.Q. (even though we might well expect a moderately high association due to the social advantages of such features).
Funny. Rushton and Jensen refuted this 2 years before Nisbett wrote this article. Rushton and Jensen say that in certain areas of the Deep South, black IQ is around 70, consistent with the hereditarian explanation of effects of hybridization. An average IQ of 71 was found for all black children in one district, whereas it was 101 for whites (Jensen, 1977). Also, Lynn (2002) and Rowe (2002) analyzed IQ scores for those that are mixed black and white and found scores in between 100 and 85, around 93. Though they do say that evidence isn’t conclusive on the matter. They say Cape Coloreds and African Americans may have better nutrition, or are treated better in society. The Minnesota Study held many variables constant, and still the mixed race children had higher IQs. That supports the genetic hypothesis.
During World War II, both black and white American soldiers fathered children with German women. Thus some of these children had 100 percent European heritage and some had substantial African heritage. Tested in later childhood, the German children of the white fathers were found to have an average I.Q. of 97, and those of the black fathers had an average of 96.5, a trivial difference.
Nope. Doesn’t work that way, Nisbett.
If European genes conferred an advantage, we would expect that the smartest blacks would have substantial European heritage. But when a group of investigators sought out the very brightest black children in the Chicago school system and asked them about the race of their parents and grandparents, these children were found to have no greater degree of European ancestry than blacks in the population at large.
Strawman. No one says there aren’t any smart blacks.
Most tellingly, blood-typing tests have been used to assess the degree to which black individuals have European genes. The blood group assays show no association between degree of European heritage and I.Q. Similarly, the blood groups most closely associated with high intellectual performance among blacks are no more European in origin than other blood groups.
Correct. Though, the studies failed to choose genetic markers with large allele frequencies between Europeans and Africans (Jensen, 1998b pg 480).
A superior adoption study — and one not discussed by the hereditarians — was carried out at Arizona State University by the psychologist Elsie Moore, who looked at black and mixed-race children adopted by middle-class families, either black or white, and found no difference in I.Q. between the black and mixed-race children. Most telling is Dr. Moore’s finding that children adopted by white families had I.Q.’s 13 points higher than those of children adopted by black families. The environments that even middle-class black children grow up in are not as favorable for the development of I.Q. as those of middle-class whites.
“Superior”. I touched on Moore here in my ‘Blank Slate’ article:
Another is the Moore study, which tested 23 black adopted children and 23 black children adopted by middle class black families. Their findings indicated that blacks adopted to black families scored at 104 compared to the blacks adopted by white families who scored at 117. People may point to this and say “Well, they didn’t differ in their environment and not their genes, so therefor the B-W IQ gap is 100 percent environmental.” Ridiculous. As with the other 2 studies, they were not tested again at adulthood. To say that any of these 3 studies mentioned above prove a 100 percent environmental cause is intellectually dishonest.
Not worth talking about either.
Important recent psychological research helps to pinpoint just what factors shape differences in I.Q. scores. Joseph Fagan of Case Western Reserve University and Cynthia Holland of Cuyahoga Community College tested blacks and whites on their knowledge of, and their ability to learn and reason with, words and concepts. The whites had substantially more knowledge of the various words and concepts, but when participants were tested on their ability to learn new words, either from dictionary definitions or by learning their meaning in context, the blacks did just as well as the whites.
Nothing strange here. Blacks have a high verbal IQ in comparison to their visio-spatial. Rushton thought that black rappers and entertainers had high verbal IQs.Also, people from the same Community College would have, on average, around the same intelligence.
Whites showed better comprehension of sayings, better ability to recognize similarities and better facility with analogies — when solutions required knowledge of words and concepts that were more likely to be known to whites than to blacks. But when these kinds of reasoning were tested with words and concepts known equally well to blacks and whites, there were no differences. Within each race, prior knowledge predicted learning and reasoning, but between the races it was prior knowledge only that differed.
That environment can markedly influence I.Q. is demonstrated by the so-called Flynn Effect. James Flynn, a philosopher and I.Q. researcher in New Zealand, has established that in the Western world as a whole, I.Q. increased markedly from 1947 to 2002. In the United States alone, it went up by 18 points. Our genes could not have changed enough over such a brief period to account for the shift; it must have been the result of powerful social factors. And if such factors could produce changes over time for the population as a whole, they could also produce big differences between subpopulations at any given time.
In fact, we know that the I.Q. difference between black and white 12-year-olds has dropped to 9.5 points from 15 points in the last 30 years — a period that was more favorable for blacks in many ways than the preceding era. Black progress on the National Assessment of Educational Progress shows equivalent gains. Reading and math improvement has been modest for whites but substantial for blacks.
Nope. The data that Murray uses only shows those of the same age, which is the accurate model. Others use those from all age groups, skewing the findings due to different heritabilities at different ages.
Most important, we know that interventions at every age from infancy to college can reduce racial gaps in both I.Q. and academic achievement, sometimes by substantial amounts in surprisingly little time. This mutability is further evidence that the I.Q. difference has environmental, not genetic, causes. And it should encourage us, as a society, to see that all children receive ample opportunity to develop their minds.
Yes, interventions from infancy all the way to the end of grade school help, as genes explained only 22 percent of the variance in those at age 5, 40 percent at age 7 and 82 percent at age 18. IQ differences can be changed in younger children, as they are more malleable at younger ages as I have just noted. But as they age, to quote Jensen, their genes “turn on” and fall to the average for that racial grouping.
People like us need to refute these lies that attempt to say that we are all the same and that any and all intelligence and scholastic achievements are environmental in origin and not largely genetic, as Rushton and Jensen have argued vehemently over the years. I will close with the final paragraph of the paper that Rushton and Jensen refuted Nisbett on sums up this situation perfectly:
There is no value in denying reality. While improving opportunities and removing arbitrary barriers is a worthy ethical goal, we must realize that equal opportunity will result in equitable, though unequal outcomes. Expanding on the application of his “default hypothesis” that group differences are based on aggregated individual differences, themselves based on both genetic and environmental contributions, Jensen [59] proposed “two laws of individual differences”—(1) individual differences in learning and performance increase as task complexity increases, and (2) individual differences in performance increase with practice and experience (unless there is a low ceiling on proficiency). We must recognize that the more environmental barriers are ameliorated and everybody’s intellectual performance is improved, the greater will be the relative influence of genetic factors (because the environmental variance is being removed). This means that equal opportunity will result in unequal outcomes, within-families, between-families, and between population groups. The fact that we have learned to live with the first, and to a lesser degree the second, offers some hope we can learn to do so for the third.
People like us need to defend men who are no longer here to defend their work, in Rushton and Jensen. The environmental explanation for IQ, as well as racial differences in IQ, is preposterous. To think that a full environmental causality actually means anything to intelligence is clearly a pipe dream.
HBD and Sports: Baseball
1350 words
Racial differences in sports also prove HBD. The differences are extremely clear to the naked eye, but there are many physiological differences between races that lead to disparities of one being over-represented over another race. I will touch on the three main races (Europeans, Asians and Africans), what they excel in and what they are below average in. Sports, as does academic achievement, prove HBD right. Sports prove innate athletic differences, whereas academic achievement proves innate differences in the brain, as well as intelligence. This is on average of course.
The word ‘sport’ is defined as an athletic activity requiring skill or physical ability, often of competitive nature. The sports I will touch on are baseball, basketball, soccer, football, weightlifting, bodybuilding, chess, gaming and hockey.
Baseball is predominantly white (MLB’s 2015 Racial/Gender Report Card), at 58.8 percent white (down from 60.9 in 2014), 8.3 percent black (up from 8.2 percent in 2014), 29.3 percent ‘Latino’ (up from 28.4 percent in 2014), and 1.2 percent Asian (down from 2 percent in 2014). Baseball is actually one of the only sports in America to be close enough to the ethnic mix of the country. According to the SABR (Society for American Baseball Research), the highest rate for black players in the MLB was in 1981 at 18.7 percent.
Before getting in to why the disparity is that large, I need to touch on ‘Latinos’ in baseball.
According to MLB.com, in 2014, 224 out of 853 players (750 active 25-man roster players and 103 disabled or restricted Major League players) were foreign-born, accounting for 26.3 percent of the players that year. Highest is the Dominican Republic with 83 players, followed by Venezuela with 59 players, Cuba with 19, Puerto Rico with 11, Mexico with 9, Colombia with 4, Panama with 4 and Nicaragua with 3. That makes 192 ‘Latino’ baseball players.
This article talks about how ‘black Latinos’ don’t get treated as black, but as ‘Latino’, when they are racially black (I will show some notable examples below). People like to think that it’s its own separate racial category when that’s not true at all.
Using 2014’s numbers, 520 players were white, 72 were black, 243 were ‘Latinos’, and 18 were Asians. We know that all ‘Latinos’ aren’t black, so using 2014’s numbers by country I will try to estimate the number of black ‘Latino’ players to try to get a real look at the racial breakdown in the MLB.
For brevity, I will just add each country up as what the majority mix of that particular country is. So, adding to the 72 black players I will add 83 from D.R., Cuba with 19, I’ll split P.R. with 5. Venezuela has a mix of blacks, whites and mulattoes, so I will just say 25 percent are black. That’s 15. Adding those up you get 194 black players. Keep in mind, a conservative estimate. So that makes the MLB about 23 percent black (this is only for those from foreign-born countries, I may make a comprehensive list one day if I feel up to it about this).
(I will just group mestizos as white for brevity to only have 3 categories.) So with that being said, 641 white players, 194 black players, and 18 Asian players. So with my guesstimate, baseball is 75 percent white, 23 percent black and 2 percent Asian in 2014.
Why the huge disparity? Simple. Baseball, at its core, is about reaction time. To quote Rushton and Jensen from their magnum opus Thirty Years of Research on Race Differences in Cognitive Ability (pg 244):
Reaction time is one of the simplest culture-free cognitive measures. Most reaction time tasks are so easy that 9- to 12-year-old children can perform them in less than 1 s. But even on these very simple tests, children with higher IQ scores perform faster than do children with lower scores, perhaps because reaction time measures the neurophysiological efficiency of the brain’s capacity to process information accurately—the same ability measured by intelligence tests (Deary, 2000; Jensen, 1998b). Children are not trained to perform well on reaction time tasks (as they are on certain paper-and-pencil tests), so the advantage of those with higher IQ scores on these tasks cannot arise from practice, familiarity, education, or training.
And from pg 245:
The same pattern of average scores on these and other reaction time tasks (i.e., East Asians faster than Whites faster than Blacks) is found within the United States. Jensen (1993) and Jensen and Whang (1994) examined the time taken by over 400 schoolchildren ages 9 to 12 years old in California to retrieve overlearned addition, subtraction, or multiplication of single digit numbers (from 1 to 9) from long-term memory. All of the children had perfect scores on paper-andpencil tests of this knowledge, which was then reassessed using the Math Verification Test. The response times significantly correlated (negatively) with Raven Matrices scores, whereas movement times have a near-zero correlation. The average reaction times for the three racial groups differ significantly (see Figure 2). They cannot be explained by the groups’ differences in motivation because the East Asian children averaged a shorter response time but a longer movement time than did the Black children.
Those with higher IQs average faster times on the simple RT, choice RT and odd-man-out RT. They follow Rushton’s Rule of Three, in which blacks will be at the bottom, whites in the middle and Asians at the top.
In this article, Mind Games: What Makes a Great Baseball Player Great, they say that studies done by Columbia University on Babe Ruth while he was playing showed that he could react to visual and sound cues better than the normal population, as well as having better hand-eye coordination than 98.8 percent of the population. A great proportion of MLB players have 20/20 vision or better. Within higher-skilled players, even then there are huge differences in reaction time (IQ differences). Hitters also have to predict where the ball will be, all within a 4/10ths of a second. This infographic explains it well. So you need an extremely high reaction time to hit a fastball coming at you at 95 miles per hour. All of this proves that, on average, baseball players have high IQs because of a lot of the things associated with baseball, also correlate highly with IQ.
Personality also is a factor. According to the previously linked article, with the example of Darryl Strawberry and Billy Beane, Strawberry handled the pressure well, while Beane folded under pressure. Seems this has to do with extroversion and introversion. Strawberry says that self-confidence and mental toughness come in to play because they fail 66 percent of the time they come up to hit.
Athletic ability is also important. The top two record holders for stolen bases in the MLB are blacks. Has to do with fast twitch muscle fibers (muscle fibers that exert force faster, but tire out more quickly than slow twitch). So you can see how natural fast twitch muscle fibers help blacks on the field, as well as the base pads, in baseball.
To touch on a previous point, even in the upper end of hitters (the elite ones), there are still marked differences in reaction time (IQ). That makes sense, seeing as I alluded to before that it takes 4/10ths of a second for a 95 MPH fastball to reach home plate.
Why the low rate for Asians? Well, natural athletic ability for one. The second reason is myopia. Those with myopia do have a higher IQ on average (as the correlation is .25), but those that are nearsighted are often late in their reactions to higher speed pitches. For something anecdotal, I’ve noticed that most Asians are pitchers, either starters of relievers. This article talks about the critical vision skills that pitchers need, and all though Asians are only 2 percent of the MLB, their high visio-spatial ability, along with high reaction times, they are able to succeed as good pitchers in the MLB.
Outfielders are generally fast and quick. Blacks round out a good amount of outfielders, whereas whites round out catcher, as well as a majority of the infield, due to a lot of line-drive hits coming at them, which the player needs high reaction times to be able to catch/field the ball.
Sports prove HBD, just like academic/monetary achievement. Intelligence, as well as physical differences, are pretty much innate. They show in all facets of life. Even though they are obvious to most, no one ever speaks out on it.
“Race is a Social Construct”: Part 1
3200 words
“Race is a social construct”. You may hear that a lot from uneducated people. They may say that since the definition of race is ‘ever-changing’, that race doesn’t exist and that it only exists in our minds. They obviously have no understanding of genetics and how we came to be today. If you want to get technical, everything is a social construct. The Universe is a social construct. We’re only giving definitions to what we perceive something to be, so with the logic of ‘race being a social construct’, then everything is a social construct. With that logic, the Universe doesn’t exist because it’s a social construct.
I will look at 3 articles in the first of many articles on this subject. One from Angela Onwuachi-Willig, Bill Nye and Ta-Nehisi Coates. All 3 have extremely wrong views on the biological reality of race, and I will prove that here. I will quote from each article and show how they are wrong with scientific studies as well as point out their bad logic.
I will begin with Angela Onwuachi-Willig. In her article for The New York Times, ‘Race and Racial Identities Are Social Constructs‘, she says that because of the ever-changing definition of the term race, that it is a social construct and not a biological one.
Race is not biological. It is a social construct. There is no gene or cluster of genes common to all blacks or all whites. Were race “real” in the genetic sense, racial classifications for individuals would remain constant across boundaries. Yet, a person who could be categorized as black in the United States might be considered white in Brazil or colored in South Africa.
Race is not biological, it is a construct. There are no clusters of genes or one gene that is common in blacks or whites. That is correct, but her statement about race being social and not a biological construct is clearly ignorant as I will show below.
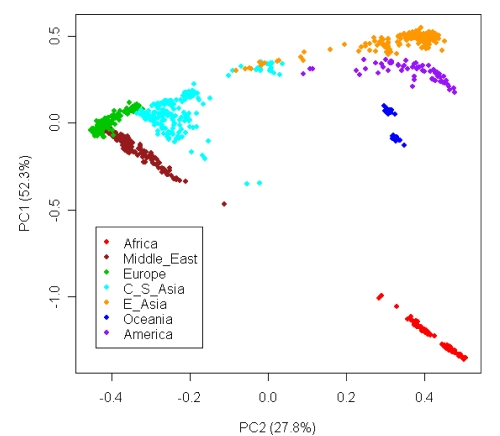
You can see in the picture above that races clearly do cluster in different clusters from other races. She is right about the changing definitions, especially Brazil, but Brazil is a special case. So much mixing has gone on in Brazil that there is evidence of skin color becoming independent of ancestry. One outlier example doesn’t make race a ‘social construct’. South Africa is also another one. They classify race in South Africa with four categories: black, colored, Indian/Asian or white. Obama would have been called ‘colored’ in South Africa today. But, again, just because there are changing definitions of race throughout the globe, doesn’t mean that race doesn’t exist.
Like race, racial identity can be fluid. How one perceives her racial identity can shift with experience and time, and not simply for those who are multiracial. These shifts in racial identity can end in categories that our society, which insists on the rigidity of race, has not even yet defined.
Is she making an argument for being ‘trans-racial’? I bet Rachel Dolezal would be happy.
In a society where being white (regardless of one’s socioeconomic class background or other disadvantages) means living a life with white skin privileges — such as being presumed safe, competent and noncriminal — whites who begin to experience discrimination because of their intimate connection with someone of another race, or who regularly see their loved ones fall prey to racial discrimination, may begin to no longer feel white. After all, their lived reality does not align with the social meaning of their whiteness.
I always hear about ‘white privilege’ but never get an actual definition of what it means. People complain about ‘white privilege’ because they, of course, don’t understand the biological reality of race. Anything that may prove innate differences between individuals or races they just can’t imagine exists because of what they’ve been taught their whole lives. She is talking about those whites who are in the BLM movement. The false ideals of egalitarianism are the cause of this.
More than 50 years ago, Congress enacted the most comprehensive antidiscrimination legislation in history, the Civil Rights Act of 1964. Half a century later in 2015, the same gaps in racial inequality remain or have grown deeper. Today, the unemployment rate for African-Americans remains more than double that for whites, public schools are more segregated now than they were in the 1950s and young black males are 21 times more likely to be shot and killed by the police than their white male peers. Even a white fourth-grade teacher in Texas, Karen Fitzgibbons, openly advocated for the racial segregation of the 1950s and 1960s on her Facebook page.
Right. IQ is the cause of the unemployment rate of African Americans. Not any imaginary forces such as ‘white privilege’. Public schools are more segregated today due to people wanting to be with others genetically similar to themselves. Blacks cause themselves to get shot and killed by police due to their actions during altercations with police officers. Oh no, someone has not politically correct opinions!! She should lose her job and never work a good job again!
That’s what the Left does. They attempt to shout you down with buzzwords so you can’t calmly and intellectually prove your case.
She is clearly wrong. Good thing this is called an ‘opinion piece’, there were few actual facts in it.
Now to touch on Bill Nye’s views on race. It’s funny. I loved his show when I was a kid. Now, knowing the truth about racial differences, hearing him say that made me lose all respect for him. He’s a mechanical engineer with a Bs from Cornell University. People only take what he says because he is ‘The Science Guy’ when he has no training in what he is talking about.
“We obsess about whether our dog is a pug-Jack Russell terrier mix with corgi overtones and an oaky finish. ‘An approachable little dog,’ whatever. They’re all dogs, okay? And so the idea of a purebred is just a human construct. There’s no such thing – in a sense there’s no such thing as a purebred dog.”
That right there is a fallacy. As with the woman’s article above, they both use the ‘continuum fallacy‘. The continuum fallacy is when someone rejects a vague claim because it’s not as precise as they want it to be. ‘There are no pure races’ or ‘there are no pure breeds of dog’, that doesn’t mean that genes don’t cluster differently, showing genetic differentiation.
“If a Papua New Guinean hooks up with a Swedish person all you get is a human. There’s no new thing you’re going to get. You just get a human. Japanese woman jumping the African guy, all you get is a human. They’re all humans. So this is a lesson to be learned. There really is, for humankind there’s really no such thing as race. There’s different tribes but not different races. We’re all one species.”
Right. That doesn’t mean there is no such thing as race. Grizzly bears and polar bears can mate to create a prizzly bear. Does that mean species doesn’t exist? (I will touch on speciation at the end of this article.) Once again, that statement doesn’t deny the biological reality of race, as you can see from the picture above.
Researchers have proven, scientifically, that humans are all one people. The color of our ancestors’ skin is a consequence of ultra-violet light, of latitude and climate.
We all belong to the same genus, Homo, but again, that doesn’t disprove race. He’s correct in saying that our ancestors’ skin is a consequence of UV light of latitude and climate, and right there he proves us correct in stating that sunlight differences depending on where your ancestors evolved in the world are the cause of racial differences.
Despite our recent sad conflicts here in the U.S., there really is no such thing, scientifically, as race. We are all one species. Each one of us more alike than different.
In this statement, he is saying the first sentence because of recent racial relations in the U.S. A clear politically-motivated statement.
“Each one of us more alike than different.’ That is correct, but, yet again, doesn’t disprove the reality of race. Geneticists estimate that humans will differ, on average, at 3 million base pairs in their DNA. That’s more than enough for distinct racial classification, as well as enough to differentiate us.
Is that supposed to mean anything? Cats have 90 percent homologous genes with humans, 82% with dogs, 80% with cows, 79% with chimpanzees, 69% with rats and 67% with mice.
90% of the mouse genome could be lined up with a region on the human genome.
99% of mouse genes turn out to have analogues in humans.
As you can see from the links above, we are all extremely genetically related to animals that are clearly extremely physically different from us humans. This shows, that the differences in humans are down to not how genetically distant we are from other animals in the animal kingdom, but how the differing genes we have are expressed.
We all came from Africa. We’re all made from the same star dust. We’re all going to live and die on the same planet – a pale blue dot in the vastness of space. We have to work together!
And finally, you can see his way of saying that racial differences mean nothing because ‘we all come from Africa’ and ‘ we’re all made from star dust’. That may be true, but that doesn’t do anything to acknowledge, or even show that racial differences are meaningless.
Bill Nye has absolutely no authority to speak on this matter. Liberals then eat this up and cite Bill Nye as proof that race doesn’t exist, which is clearly untrue as I have shown.
Finally, I will get to Ta-Nehisi Coates’ ‘The Social Construction of Race‘. He cites my favorite blogger/geneticist Razib Khan, so this should be good.
Ancestry — where my great-great-great-great grandparents are from — is a fact. What you call people with that particular ancestry is not. It changes depending on where you are in the world, when you are there, and who has power.
Right with the first sentence, and with the second. It seems he’s attempting to use what the first article I cited says: that due to ever-changing racial definitions that race doesn’t exist as we believe it to be. He says that ancestry is a fact, well wouldn’t that same ancestry be your racial classification? I am not following his logic. Just because there are differing views on the definition of race throughout the globe, doesn’t mean that there is no biological reality of race.
He cites someone else who states:
“Race” as a term is very nebulous. But human subgroups with similar ancestries can have group differences in DNA — and intelligence is highly unlikely to have no genetic basis at all (although most now believe its impact is greatly qualified by cultural and developmental differences).
Cultural and developmental differences. The cultural differences are thrown out. According to the editorial ‘Mainstream Science on Intelligence’, which came out shortly after The Bell Curve was published, one of their points is that IQ tests are not culturally biased if the individual speaks English. If they are not English speakers, they will either get a test in their native language or get Raven’s Progressive Matrices, which is a ‘culture free’ IQ test as it’s based on pattern recognition and has no writing involved. Developmental differences, yes. White mothers have a better prenatal environment then do black mothers, which is biological. Developmental differences are innate within the two populations.
I do not know. Andrew is more inclined to believe that there is some group-wide genetic explanation for the IQ difference. I am more inclined to believe that the difference lies in how those groups have been treated. One thing that I am not convinced by is controlling for income and education.
Oh, the old ‘Stereotype Threat‘ canard. The paper, which was cited more than 5000 times, states that African-Americans do worse on tests in which they are told that they are being judged on their race. Well, a meta-analysis of 55 published and unpublished studies came out and what was found that the it shows clear publication bias. Either due to people not knowing how to read scientific papers or more insidious tactics. The effect varies across studies and is small. Though elite university undergrads may underperform on tests of cognitive tests due to Stereotype Threat, this effect doesn’t generalize to non-adapted standardized tests, high-stakes settings and less academically gifted test takers. Stereotype Threat cannot explain the difference in mean cognitive test performance between African Americans and European Americans. (pg 68)
In the mid-20th century, as we have been documenting, it was the policy of this country to deny African-Americans access to the same methods of wealth-building, that it was making available to whites.
This is not merely a problem for your local diversity and sensitivity workshop. It is a problem of wealth and power. When you create a situation in which a community has a disproportionate number of poor people, and then you hyper-segregate that community, you multiply the problems of poverty for the entire community–poor or not. That is to say that black individuals are not simply poorer and less wealthier than white individuals. Because of segregation, black individuals and white individuals of the same income and same wealth, do not live in communities of equal wealth.
What bearing does segregation have on IQ differential? I don’t know. My skepticism of genetics is rooted in the fact that arguments for genetic inferiority among people of African ancestry are old, and generally have not fared well. My skepticism is also rooted in the belief that power generally seeks to justify itself. The prospect of actual equality among the races is frightening. If black and white people truly are equal on a bone-deep level, then the game might really be rigged, and we might actually have to do something about it. I think there’s much more evidence of that rigging, then there is evidence of cognitive deficiency .
I must add that I can not pretend to be a dispassionate, nor impartial observer. I come from a particular place. I’ve now been out in the world, and seen how other people in other places live. They don’t strike me as more intelligent. They strike me as better armed. There’s nothing scientific about that. But I think we all have core faiths. These are mine. You’ve been warned.
Regardless of the method used in the analyses, all researchers reached estimated very close to that obtained by Lewontin: The differences observed by the subdivisions (populations, groups of populations, races) represented 10 to 15 percent of the total genetic variation found within the human species. Formally, these findings demonstrate, first, that the species is indeed subdivided into genetically definable groups of individuals and, second, that atleast some of these groups correspond to those defined by anthropologists as races on the basis of physical characters. They do not however, settle the arguments regarding the methods of racial classification. Unfortunately, Lewontin did not specify before initiating his analysis how large the difference has to be in order to call the groups “races”.
Consequently, the results of the studies have led population geneticists to two diametrically opposite conclusions. Lewontin called the observed differences trivial, and proclaimed that “racial classification is now seen to be of no genetic or taxonomic significance” so that “no justification can be offered for its continuance.” This view is echoed by authors of similar studies, who seem to be surprised that genetic variation within populations is greater than that between them. By contrast, Sewell Wright who can hardly be taken for a dilettante in questions of population genetics, has stated emphatically that if differences of this magnitude were observed in any other species, the groups they distinguish would be called subspecies.
One can extend Wright’s argument even further. The more than 200 species of haplochromine fishes in Lake Victoria differ from each other much less than the human races in their neural genes, although they are presumably distinguished by genes that control differences in their external appearances. The same can be said about atleast some of the currently recognized species of Darwin’s finches and other examples of recent adaptive radiations. In all these cases, reproductively isolated groups are impossible to tell apart by the methods used to measure differences in human races. Obviously, human races are not reproductively isolated (interracial marriages are common and the progenies of such marriages are fully fertile) but the external differences between them are comparable to cichlid fishes and Darwin’s finches. Under these circumstances, to claim that the genetic differences between the human races are trivial is a more political statement than a scientific argument. Trivial by what criterion? How much difference would Lewontin and those who side with him consider non-trivial?
By mixing science with politics, geneticists and anthropologists are committing the same infraction of which they are accusing other scientists, who they themselves label as racist. Even worse, by labelling the genetic differences as insignificant, they play into the hand of genuine racists who can demolish this claim and so further their own agenda. It is intellectually more honest to acknowledge and then point out that by no means imply supremacy of one race over others. This can be done by demonstrating that the differences are in genes that cannot be linked to any features that would be required for the preeminence of a particular race.
It’s clear that racial classification does exist. The creator of Fst, Sewall Wright, says that a Fst distance of .15 is more than enough for speciation (differing racial classifications). It directly refutes Lewontin, who put his political ideology of Marxism over science. Those cichlids in Lake Victoria are a perfect example that though the definition of ‘species’ does change depending on which researcher you speak to, it doesn’t discount that there are real and physical genetic differences between races and ethnicities.
In conclusion, the term “race is a social construct” is a deliberately intellectually dishonest statement, or a statement used to hide the truth for more insidious things to happen due to the non-acknowledgement of race.
IQ, Nutrition, Disease and Parasitic Load
1600 words
There are some environmental factors that have negative effects on IQ. Three I will touch on today are nutrition, disease and parasitic load. All three mean decreased cognitive ability as well as a slew of other negative effects on their lifestyle.
To start, nutrition of the mother is one of the most important and telling things for the health as well as IQ of the child. Prenatal nutrition is very important to a developing fetus. What the mother eats has a big effect on the fetus. For instance, vitamins and minerals are extremely important. A pregnant mother needs two times the amount of folic acid than a non-pregnant mother. A pregnant woman needs 400 mcg per day to prevent defects to the babies brain and spine called neural tube defects. A pregnant woman also needs double the amount of iron than a non-pregnant woman.
We can see here that if a pregnant woman is protein deficient, it passes on to the baby. Protein is more important in the second and third trimester due to the fetus developing more rapidly. It can also lead to growth retardation, due to reduced nutrient supply to the fetus. The authors end up concluding that the women who ingested 50-70 grams of protein per day and 156 to 465 ml of milk had children with significant and better tendency in femur length, bi-parietal diameter, abdomen circumference and head circumference. It’s important for a mother to get the right amount of protein for optimal fetal growth.
It’s also known how malnutrition in early years can lead to antisocial and aggressive behavior as well as lower cognition. It’s due to what I touched on above. They state that malnutrition in early childhood years such as lack of iron, zinc, B vitamins as well as being protein deficient leads to the 3 aforementioned things. As I have shown in the previous paragraph, the lack of the same nutrients during fetal development causes the same problems.
Now that I have touched on how prenatal nutrition is important for the fetus, I will talk about parasitic load.
According to a paper by Eppig et al, the prevalence of parasites is the cause of worldwide differences in cognitive ability. They state that from an energetics standpoint, that a developing human would have a hard time developing a brain while fighting infectious disease, as both are very metabolically demanding. They go through all of the theories of differences in cognitive ability, such as the cold winter hypothesis of Lynn, Rushton and Kanazawa, to studies of inbreeding depression by Saadat and Woodley. They state that Lynn has argued that nutrition is important to high degrees of mental development, that nutrition is the cause of the ‘Flynn Effect’ and that he showed that undernourished children have smaller heads, smaller brains and lower cognitive function than adequately nourished children. They end up concluding that as nations develop, they should be monitored for a decrease in parasitic infection to see if it correlates with a rise in IQ and whether any gain would be able to account for the ‘Flynn Effect’ (which the rate is 3 points per decade, no matter what population you look at).
To touch quickly on what Lynn said about undernourished children having smaller heads, smaller brains, and, therefore, lower cognitive function, all 3 of those variables are related. Brain size is correlated with cognitive ability at .44. So, we can see there is a pretty good relationship with brain size and IQ. So, those who don’t get adequate nutrition will, in turn, have a smaller head size and a smaller brain, which both lead to depressed intelligence.
There is evidence that Sickle Cell Anemia leads to a decrease in IQ. The authors conclude with MRI scans, that those with SCA have a decrease in total brain volume, which of course has a negative effect on cognitive ability. Though, that happened due to an increase in age. It’s known that brain size and the amount of neurons in the brain decrease with age. I won’t discount that SCA lowers cognitive ability, it’s a good hypothesis, along with the paper by Eppig et al, but I still think that Rushton, Lynn and Kanazawa’s Cold Winter Theory is the best evolutionary model for differences in intelligence found across the globe.
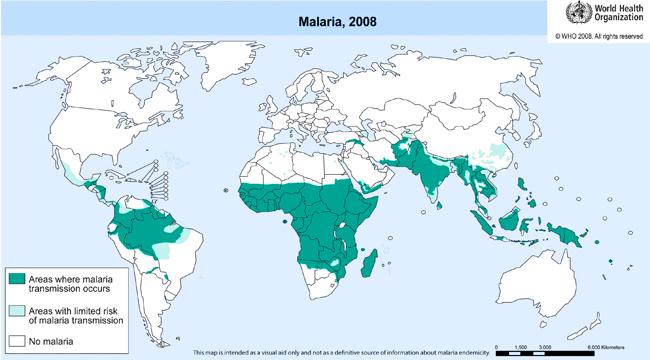
In the map above you can see the rate of malaria in the world. It’s concentrated around the equator as mosquitoes are the main transmitters of the parasites. Though, is it the parasitic load that causes low IQ or evolution in hot climates, which lead to low IQ and, in turn, makes them able to not be able to figure out how to cure the diseases due to low intellect? I believe it’s both, leaning more to the side of evolution in hot climate obviously, but I won’t discount that malaria, and therefore, SCA, has something to do with lower cognitive ability in those populations with higher rates of malaria.
So with all of the above factors, let’s talk about Africa.
We know they have the lowest IQs in the world (IQ 67 to 70), and we know they have the highest rates of malaria in the world, and also some of the worst nutritional standards of any geographic region in the world.
What is the cause? IQ? Disease? Parasitic load? Nutrient deficiencies?
All of the above. The last 3 are environmental effects that retard IQ. IQ drives most all development for a country, so with the last 3 points being there, obviously since they retard IQ, the QoL in the country will suffer.
Lynn states that with better nutrition that Africans will be able to reach their phenotypic IQ of 80. There is some good evidence for his claim as he also states that blacks with low to no white admixture have an IQ of 80. Rushton and Jensen also say that since psychologists don’t venture into the lowest income neighborhoods in the South, that the black IQ may be 78 in America, and not 85. Right there by the African phenotypic IQ of 80. So, that would mean that those with the highest amount of African ancestry have an IQ of around 80, plus or minus a few points. So if those African-Americans with low amount of white admixture have an IQ of 80, then it’s a good bet to take that if Africans themselves had proper nutrition that they would hit 80 as well, just as Lynn has stated.
Satoshi Kanazawa also said this back in 2006. Of course the media made him out to be someone who just said that without any backing of his claims. He compared IQ scores with indicators of ill health in 126 countries. He found that those countries with the lowest IQs have higher rates ill health. They accuse him of attempting to ‘revive the politics of eugenics by publishing the research which concludes that low IQ levels, rather than poverty and disease, are the reason why life expectancy is low and infant mortality high’. We know that poverty goes out the window because of the relationship between IQ and poverty. But as seen above, disease does have an effect on IQ. They only threw buzzwords at him and, of course, didn’t attempt to say anything meaningful to him.
The link between life expectancy and IQ is well studied. Those with lower IQs live shorter lives and those with higher IQs live longer lives. The studies and information I cite in that article corroborate what Kanazawa says about IQ and ability to fight disease.
IQ is affected by environmental factors such as disease, nutrition and parasitic load. I have given good evidence that with better nutrition, Africans can reach their phenotypic IQ of 80. But, they can’t learn how to farm because of their low IQ. They can’t get a higher IQ because they can’t learn how to farm.
The cause of this is evolution. When they say, as seen in Kanazawa’s article, that poverty (malnutrition) and disease are the causes of low IQ, low IQ causes those 2 things because those with lower IQ don’t have the abstract ability to think into the future that what they’re doing to their bodies can and will have negative effects in the future, which leads to decreased life span as I have noted in the article I have linked. It also leads to them not being able to farm, due to not having a high enough intellect due to evolving in the hot climates of the sub-Saharan desert. The only thing that holds wight, in my opinion, for the case for an environmental effect for lowered IQ is the case for parasitic load. So, I posit that if Africans were to some how to get it in to shape on their own and take care of those things on their own, they will be able to reach their phenotypic IQ of 80. We also know that immigrants from European countries with lower IQs, their descendants in America have IQs closer to average to the white average (100). 33 million people in Europe are at risk for malnutrition, so those who do come to America who are at risk for malnutrition, get the IQ boost due to living in America with better nutrition. This is also supported by African immigrants to America having a higher rate of collegiate attainment than white Americans, though that may be due to super-selection, only the smartest African populations coming here.
In conclusion, those African-Americans with low to no white admixture have an IQ of around 80, so it’s well supported that, with better nutrition, lower parasitic load and lower disease rate, Africans, and all other low IQ countries for that matter, can get a boost of around 10 to 15 points with all 3 things I have noted in this article taken care of.
