
Stockholm 5000 BC
by Scott Jameson
350 words
Stockholm Syndrome is when you identify with people who capture and, in some cases, abuse you. I’ve heard two pretty good explanations for this phenomenon. One is that female mammals like powerful male mammals. Makes sense. The other is that abducted people are attempting to maximize their own chances of survival, and perhaps those of any children they already have. Also makes sense. Let me present a third.
Intra-female competition. Imagine that a woman from tribe B is forcibly inducted into tribe A. The women from tribe A know all of the customs of tribe A, speak the language and so on, and they have known the men from tribe A since childhood. All else equal, what does the woman from tribe B have going for her- novelty, perhaps? That’ll wear off pretty quick, likely faster than it takes for her to get familiarized with her new culture. How can she possibly compensate? How can she compete with the women from tribe A for quantity and social status of offspring?
Lots and lots of asabiyah. If she were that much more devoted to her captors, to their religion, and so on, the men may admire her, or perhaps begin to consider her truly one of “their own,” thereby reducing the disadvantage by comparison to the women from tribe A.
All of these line up with the common belief- which I cannot seem to find strong evidence for or against, but here’s a study that mentions a sample of 21 Stockholm cases wherein 18 were women– that women tend to “suffer” from Stockholm Syndrome more often than men.
It’s not a disease in the Darwinian sense, it’s a behavioral response mechanism. The more accurate term is Capture Bonding.
Any one of these three hypotheses may explain it, or perhaps any combination of the three, or maybe something else. You would have to determine selective pressures operating on women currently in a situation wherein capture bonding is common, for example determining which behaviors enabled one war bride to have more children than another. Anybody up for some field work with Boko Haram?
The “N” Word
1300 words
Numerous academics have been looked at as pariahs for uttering this word. This word has a pretty long history offending people. The word I’m talking about is natural. This “N” word—especially today—is extremely divisive in today’s society. If you say that something is ‘natural‘, are you taking away any accomplishments that one has done, all because it’s ‘natural‘?
Take what I’ve been writing about for the past three weeks: athletics. If you say that one is a “natural” at athletic competition, are you taking away the hard work it took for that specific athlete to accomplish his goal? No way. You’re acknowledging that that specific individual has something special that sets him apart from the average person. That’s not to say that hard work, determination, and confidence don’t matter; on the contrary. They DO matter. However, like I said with the Kalenjin Kenyan distance runners (who do have anatomical/physiologic advantages in regards to sprinting): you can take someone with elite genetics who has done elite training and put him up against someone who has subpar genetics (in terms of the athletic event) with elite training—the same training as the athlete with elite genetics—and the athlete with elite genetics/muscle fibers/physiology will constantly blow away the individual who is less genetically gifted.
People readily admit that certain races excel at certain physical activities whereas other races don’t fare as well. As I’ve extensively covered (and provided more than enough evidence/arguments for), the races differ in the number of muscle fibers which cause higher rates of obesity in blacks; this causes strength differences which then correlate with mortality. Finally, somatype is extremely important when speaking about athletics. Blacks have a mesomorphic somatype, which, along with their fiber typing and physiologic differences on average compared to whites, cause blacks to dominate most sporting events. However, when you say that certain races are “naturally more intelligent than others“, people all of a sudden have a bone to pick.
This “N” word when it comes to athletics is perfectly fine to use in our vocabulary, yet when we begin talking about intelligence differences—between races and individuals—all of a sudden we think that everyone is the same and that all brains are made the same. We believe that, although humans evolved genetically isolated for thousands of years and have incurred anatomic/physiologic differences, that one organ—the brain—is somehow exempt from the forces of natural selection. I can think of no traits that WON’T get selected for/against, and so I can think of no reason why the brain wouldn’t be under different selective pressures in Siberia/Northern Europe/the Americas/Africa/PNG/Australia.
However, as far as I can tell, we have not found any alleles that differ between populations. It was proposed in 2005 that the genes ASPM and Microcephalin influenced brain growth (Evans et al, 2005; Mekel-Brobov et al, 2005). However, two years later, Rushton, Vernon and Ann Bons (2007) showed that there was no evidence that Microcephalin and ASPM were associated with general mental ability (GMA), head circumference or altruism. Peter Frost cites Woodley et al, (2014) showing that the correlation between microcephalin and IQ is .79, whereas the correlation with ASPM and IQ was .254. Woodley et al (2014) also show there is a correlation between Disability Adjusted Life Years (DALY) and Microcephalin. The reasoning is that Microcephalin may improve the body’s immune response to viral infections, enabling humans to live in larger societies and thus get selected for higher IQ. Since the allele seems to give better disease resistance, then, over time, selection for higher intelligence can be selected for since fewer people are dying from disease due to increased resistance.
Nevertheless, the debate is still out on this allele. However, the data does look good in that we may have found certain polymorphisms that differ between populations which may explain some racial differences in intelligence. (For more information on IQ alleles, see Race and IQ: the Case for Genes).
Now, we are beginning to have some good evidence pile up showing that there are population differences in these alleles, and that they do predict intelligence. Racial differences in intelligence aren’t accepted by mainstream science and the public at large (obviously) like physiologic/anatomic differences are between human populations. Populations are split for thousands of years. They evolve different anatomy/physiology based on the environment. So, then, why wouldn’t psychological differences appear between the races of Man, when other, physical changes occurred from the OoA migration? It literally makes no sense.
People readily admit that athleticism is largely “natural“, yet when someone says that differences in intelligence are largely due to genes they get shouted down and called a ‘racist’, as if that adds anything to the dialogue. People readily admit that individuals/races are “naturally” leaner/stronger/faster/have quicker reflexes. But if one just even hints at thinking about “natural” differences between populations when it comes to general mental ability, they will be shouted down and their careers will be ruined.
Why? Why are people so scared of the “N” word? Because people want to believe that what they do or do not accomplish comes down to them as an individual and only them. They don’t want to think about the complex interaction between genes x environment and how that shapes an individual’s life path. They only think about environment, and not any possible genetic factors. Certain people—mostly social science majors—deny that evolution had ANY impact on human behavior. The “N” word, especially in today’s society, is a completely divisive word. State that you hold hereditarian views (in terms of mental ability) in regards to differences between populations and athletic events and no one will bat an eye.
“Didn’t you see Usain Bolt blow away the competition and set a new world record in the 100m dash at 9.58 seconds?!”
“He’s naturally good, he was born a gifted athlete.”
No one will bat an eye if you say this. This is where the tables will be flipped if you say:
“Don’t you know that differences in intelligence are largely genetic in nature and no matter how much you ‘train the brain’ you’ll stay at that intelligence level?”
“Man, that’s racist. That shouldn’t be looked at. We are all the same and equal. Except when it comes to certain athletic events, then we are not equal and some populations have natural predispositions that help them win. Evolution stopped at the neck 100kya; the only parts of the body under selective pressure over the past 100kya is below the neck!”
People who say this need to explain exactly what shields the brain from selection pressures. Man originated in Africa, the descendants of the soon-to-be coalesced races spent tens of thousands of years in differing environments. You need to do different things to survive in different environments. Just as the races differ physically, they differ mentally as well. Evolution did not stop at the neck. Significant changes in the brain have occurred in the past 10,000 years. There was a trade-off with agriculture, in that it was responsible for the population explosion which was responsible for mutations that affect intelligence and thus get selected for.
The “N” word is not a scary word. It is, in fact, it’s just common sense. People need to realize that by accepting genetic explanations for black domination in sports, that they would then, logically, have to accept racial differences in intelligence. It makes no sense to accept evolutionary theories (even if you don’t know it) in regards to athletics and not accept the same evolutionary theories for racial differences in the brain. There are real differences between populations, in both anatomy/physiology and our mental faculties and brain organization. If you accept one, you have to accept the other.
Diet Or Socializing—What Caused Primate Brain Size To Increase?
1100 words
The social brain hypothesis argues that the human brain did not increase in size to solve increasingly complex problems, but as a means of surviving and reproducing in complex social groups (Dunbar, 2009). The social brain hypothesis is one of the most largely held views when it comes to explaining primate encephalization. However, an analysis of new phylogeny and more primate samples shows that differences in human and non-human primate brain evolution come down to diet, not sociality.
Diet is one of the most important factors in regards to brain and body size. The more high-quality food an animal has, the bigger its brain and body will be. Using a larger sample (3 times as large, 140 primates), more recent phylogenies (which show inferred evolutionary relationships amongst species, not which species is ‘more evolved’ than another), and updated statistical techniques, Decasien, Williams, and Higham (2017) show that diet best predicts brain size in primates, not social factors after controlling for body size and phylogeny (humans were not used because we are an outlier).
The social scheme they used consisted of solitary, pair-living, harem polygyny (one or two males, “a number of females” and offspring), and polygynandry (males and females have multiple breeding partners during the mating season). The diet scheme they used consisted of folivore (leaf-eater), frugivore-folivore (fruit and leaf eater), frugivore (fruit-eater) and omnivore (meat- and plant-eaters).
None of the sociality measures used in the study showed a relative increase in primate brain size variation, whereas diet did. Omnivores have bigger brains than frugivores. Frugivores had bigger brains than folivores. This is because animal protein/fruit contains higher quality energy when compared to leaves. Bigger brains can only evolve if there is sufficient and high-quality energy being consumed. The predicted difference in neurons between frugivores and folivores as predicted by Herculano-Houzel’s neuronal scaling rules was 1.08 billion.
The authors conclude that frugivorous primates have larger brains due to the cognitive demands of “(1) necessity of spatial information storage and retrieval; (2) cognitive demands of ‘extractive foraging’ of fruits and seeds; and (3) higher energy turnover and enhanced diet quality for energy needed during fetal brain growth.” (Decasien, Williams, and Higham, 2017). Clearly, frugivory provided some selection pressures, and, of course, the energy needed to power a larger brain.
The key here is the ability to overcome metabolic constraints. Without that, as seen with the primates that consumed a lower-quality diet, brain size—and therefore neuronal count—was relatively smaller/lower in those primates. Overall brain size best predicts cognitive ability across non-human primates—not encephalization quotient (Deaner et al, 2007). Primate brains increase approximately isometrically as a function of neuron number and its overall size with no change in neuronal density or neuronal/glial cell ratio with increasing brain size (in contrast to rodent brains) (Herculano-Houzel, 2007). If brain size best predicts cognitive ability across human primates and primate brain size increases isometrically as a function of neuron number with no change in neuronal density with increasing brain size, then primates with larger brains would need to have a higher quality diet to afford more neurons.
The results from DeCasien, Williams, and Higham (2017) call into question the social brain hypothesis. The recent expansion of the cerebellum co-evolved with tool-use (Vandervert, 2016), suggesting that our ability to use technology (to crush and mash foods, for instance) was at least as important as sociality throughout our evolution.
The authors conclude that both human and non-human primate brain evolution was driven by increased foraging capability which then may have provided the “scaffolding” for the development of social skills. Increased caloric consumption can afford larger brains with more neurons and more efficient metabolisms. It’s no surprise that frugivorous primates had larger brains than folivorous primates. Just as Fonseca-Azevedo and Herculano-Houzel (2012) observed, primates that consumed a higher quality diet had larger brains.
In sum, this points in the opposite direction of the social brain hypothesis. This is evidence for differing cognitive demands placed on getting foods. Those who could easily get food (folivores) had smaller brains than those who had to work for it (frugivores, omnivores). However, to power a bigger brain the primate needs the energy from the food that takes the complex behavior—and thus larger brain—to obtain. This lends credence to Lieberman’s (2013) hypothesis that bipedalism arose after we came out of the trees and needed to forage for fruit to survive.
Brain size in non-human primates is predicted by diet, not social factors, after controlling for body size and phylogeny. Diet is the most important factor in the evolution of species. With a lower quality diet, larger brains with more neurons (in primates, 1 billion neurons takes 6 kcal per day to power) would not evolve. Brain size is predicated on a high-quality diet, and without it, primates—including us—would not be here today. Diet needs to be talked about a lot more when it comes to primate evolution. If we would have continued to eat leaves and not adopt cooking, we would still have smaller brains and many of the things that immediately came after cooking would not have occurred.
Since we are primates we have the right morphology to manipulate our environment and forage for higher quality foods. But those primates with access to foods with higher quality have larger brains and are thus more intelligent (however, there are instances where primate brain size increases and decreases and it comes back to, of course, diet). Sociality comes AFTER having larger brains driven by nutritional factors—and would not be possible without that. Social factors drove our evolution—no doubt about it. But the importance of diet throughout hominin evolution cannot be understated. Without our high-quality diet, we’d still be like our hominin ancestors such as Lucy and her predecessors. Higher quality diet—not sociality, drives primate brain size.
References
DeCasien, A. R., Williams, S. A. & Higham, J. P. Primate brain size is predicted by diet but not sociality. Nat. Ecol. Evol. 1, 0112 (2017).
Deaner, R. O., Isler, K., Burkart, J., & Schaik, C. V. (2007). Overall Brain Size, and Not Encephalization Quotient, Best Predicts Cognitive Ability across Non-Human Primates. Brain, Behavior and Evolution,70(2), 115-124. doi:10.1159/000102973
Dunbar, R. (2009). The social brain hypothesis and its implications for social evolution. Annals of Human Biology,36(5), 562-572.
Fonseca-Azevedo, K., & Herculano-Houzel, S. (2012). Metabolic constraint imposes tradeoff between body size and number of brain neurons in human evolution. Proceedings of the National Academy of Sciences,109(45), 18571-18576. doi:10.1073/pnas.1206390109
Herculano-Houzel, S. (2007). Encephalization, neuronal excess, and neuronal index in rodents. Anat. Rec. 290, 1280–1287.
Lieberman, D. (2013). The story of the human body: evolution, health and disease. London: Penguin Books.
Vandervert, L. (2016). The prominent role of the cerebellum in the learning, origin and advancement of culture. Cerebellum & Ataxias,3(1). doi:10.1186/s40673-016-0049-z
Evolution and IQ Linkfest III
1050 words
What the octopus tells us about human intelligence (Mammals are ‘brain heavy’, the cephalopod nervous system is more distributed across its limbs. Some people believe they have minds with consciousness. Interesting read.)
A brewing debate on evolution theory picks up in India (Great look at the niche construction theory—which states that an organism modifies its environment which in turn decreases or increases fitness. Two great examples of NC are lactase consumption 6500 ya that led to most European populations having the ability to digest lactase and an African farmer digging some irrigation holes could cause mosquitoes to live in the still water. Over time, the people would get malaria. They then would evolve sickle cell anemia to battle the malaria virus. For more information on niche construction, read this paper: Conceptual Barriers to Progress Within Evolutionary Biology and Niche Construction Theory and Archaeology.)
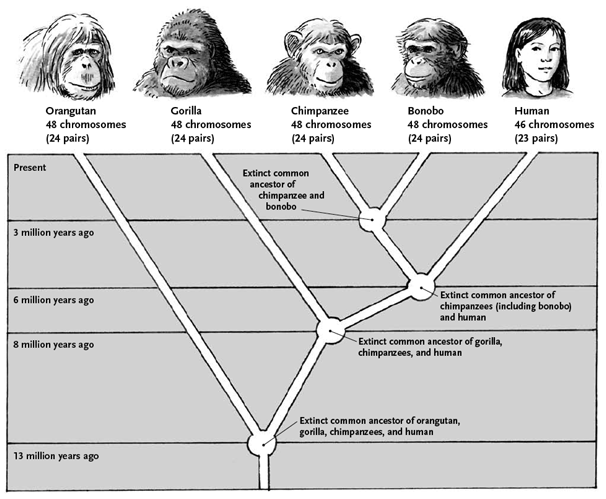
Human evolution: why we’re more than great apes (Culture and our brains set us apart from the animal kingdom, and thus, some researchers argue, that humans shouldn’t be called Great Apes. Both humans and Great Apes are a part of the Hominidae family. Sure we’re ‘more than Great Apes’. However, due to the chromosomal fusion some 6mya, this is why we speciated.)
Dramatic evolution within human genome may have been caused by malaria parasite (The most recent common ancestor that possessed the DARC gene, which shuts off a protein receptor on the surface of the red blood cells that the parasite needs to gain entry, lived around 42 kya. By 8000 ya, 99 percent of the population had the DARC gene. The author estimates that for every 100 people that were born without the DARC gene, 105 would have been born with it. The gene has pretty much has hit fixation in this population. Of course, since humans evolved to fight the parasite, the parasite itself evolved adaptations to continue living. See the Red Queen Hypothesis.)
Climate may have shaped the evolution of the human nose: Nature’s nose job (Nose shape is linked to climate, which is then shaped by natural selection. Africans and their descendants have wider, shorter, flatter noses due to living in more moist, drier environments. A larger mucous area is needed to moisten dry air. Peoples who evolved in cooler climes, however, evolved longer, thinner noses due to living in colder climes. Read the paper here: Investigating the case of human nose shape and climate adaptation.)
Human skull evolved along with two-legged walking, study confirms (No surprise here. This is some good evidence for my “Man the Athlete” hypothesis. Our athleticism was paramount in our evolutionary history, which released important hormones to aid in our brain growth over time. The foramen magnum is forward-shifter in many bipedal species. That is the hole in which the spinal column goes into.)
Stone tools not always deliberate, research finds (Capuchin monkeys of South America can flake tools similar to that of early hominins. Pretty much, if we find tools that are similar to this, we cannot assume that a human ancestor made them. Flaking alone is not enough, it may have been by a non-hominin so other measures are needed.)
MD Debunks Myth that Humans Evolved to Eat Meat (This deserves a full-length article. The MD says that humans eating meat are like dogs eating chocolate since we are closely related to chimpanzees who eat a plant-based diet. This reasoning…. makes no sense! There are genetic changes from cooking that appeared between 265 to 800kya and the ONLY explanation is the introduction of cooked foods! I will cover this article in the future.)
Tooth be told: Millions of years of evolutionary history mark those molars (Anthropologists can see what type of diet an animal ate, to how long their childhood was due to the layers of tooth enamel. Looking at the teeth of hominins/chimps also show that humans have a longer childhood, which is important for motor development at a young age.)
Microbes evolved to colonize different parts of the human body (The microbiota in our body evolved especially for the place it found itself it. Each species of bacteria serves a pertinent function in the body. These bacteria also drive part of our metabolism, so having them was extremely beneficial in our evolution.)
‘No Valid Conclusions’: Omega-3 trade body fires back over prenatal DHA supplementation findings (A new RCT (Randomized Controlled Trial) just came out stating that DHA supplements that mothers take while pregnant doesn’t increase IQ. Women were randomized to receive a placebo or 800 mg of DHA. They found no difference in cognitive, language or motor development by 18 months. At four years of age, they reported no effect of DHA on the children’s cognitive, language or motor development, noting possibly that DHA consumption had a negative effect on parent-rated behavior. Of the eligible children, 85 percent (543 children) took part in the follow-up. IQ did not differ in the DHA group (98.31) or for the placebo group (97.32). Perceptual reasoning was slightly higher in the DHA group, but the parent-rated behavior was worse. There are some problems with the study design, however. The experimental design didn’t test blood levels of omega-3s in the mothers or the offspring. It’s also unknown if they were receiving the correct amount of DHA since they weren’t tested. Of course, post-pregnancy diets of the mothers while breastfeeding AND that of the children would skew levels of DHA in the blood. Omega-3s are paramount for brain health at all ages—most importantly in the womb and the first few years of a child’s life. In fact, telling women and children NOT to consume fish oil/omega-3s is the WORST thing you can do!)
How a Western diet leads to overeating and obesity (Chronic overconsumption of Western diets high in sugar and fat is a major cause of the obesity epidemic. However, researchers have found that a chronic overconsumption of the Western diet leads to obesity “due to elevations in ‘peripheral endocannabinoid signaling.'” The endocannabinoid system regulates energy balance, reward, and food intake. Elevations of endocannabinoids in the body lead to hyperphagia (an abnormal appetite for food). I await future looks into this research. We may be able to curb the epidemic by identifying certain pathways that lead to hyperphagia and other eating disorders and prevent them.)
Racial Differences in Somatype
1750 words
One’s somatype is, really, the first thing they notice. Somatypes are broken down into three categories: ectomorph (skinny build), endomorph (rounder, fatter build) and mesomorph (taller, more muscular build). Like numerous other traits, different races and ethnies fall somewhere in between these three soma categories. Africans are meso, while Europeans are endo, while East Asians are more endo than Europeans. Differences in somatype, too, lead to the expected racial differences in sports due to differing anatomy and fat mass.
History of somatyping
The somatype classification was developed by psychiatrist William Sheldon in the 1940s, while releasing a book in 1954 titled Atlas of Men: Somatotyping the Adult Male At All Ages. He theorized that one’s somatype could predict their behavior, intelligence, and where they place socially. Using nude posture photos from his Ivy League students, he grouped people into three categories based on body measurements and ratios—mesomorph, endomorph, and ectomorph. Clearly, his theory is not backed by modern psychology, but I’m not really interested in that. I’m interested in the somatyping.
Somatypes
The three somatypes are endomorph, mesomorph, and ectomorph. Each type has different leverages and body fat distribution. Endomorphs are rounder, with short limbs, a large trunk, carry more fat in the abdomen and lower body, large chest, wide hips, and has hardly any muscular definition, yet gain strength easily. Ectomorphs, on the other hand, are taller, lankier with longer limbs, a narrow chest, thin body, short trunk and has little muscle.
There are further subdivisions within the three main types, mesomorphic-endomorph (meso-dominant), mesomorph-endomorph (both types are equal with less ectomorphy), ectomorphic-mesomorph, endomorphic-mesomorph, endomorph-ectomorph, and ectomorphic-endomorph. This can be denoted as “7-1-1”, which would indicate pure endomorph, “1-7-1” would indicate pure mesomorph and “1-1-7” would be a pure ectomorph. Further breakdowns can be made such as “1.6-2.7-6.4”, indicating the somatype is ecto-dominant. On the scale, 1 is extremely low while 7 is extremely high. The races, however, fall along racial lines as well.
Racial differences in somatype
West Africans and their descendants are the most mesomorphic. They also have the highest amount of type II muscle fibers which is a leading cause of their success in sporting events which call for short bursts of speed. Due to having longer limbs, they have a longer stride and can generate more speed. West Africans also have the narrowest hips out of all of the races (Rushton, 1997: 163) which further leads to their domination in sprinting competitions and events that take quick bursts of speed and power. However much success their morphology lends them in these types of competitions, their somatype hampers them when it comes to swimming. The first black American qualified for the Olympic swimming team in the year 2000. This is due to a narrower chest cavity and denser, heavier bones.
East Africans are most ectomorphic which you can see by their longer limbs and skinnier body. They have an average BMI of 21.6, one of the lowest in the world. Their low BMI, ectomorphic somatype and abundance of slow twitch muscle fibers are why they dominate in distance running events. Many explanations have been proposed to explain why East Africans (specifically Kenyans and Ethiopians) dominate distance running. The main factor is their somatype (ectomorphic) (Wilbur and Pitsiladis, 2012). The authors, however, downplay other, in my opinion, more important physiologic characteristics such as muscle fiber typing, and differences in physiology. Of course their somatype matters for why they dominate, but other important physiologic characteristics do matter. They clearly evolved together so you cannot separate them.
Europeans are more endo than East Africans and West Africans but less so than East Asians. Europeans have a strong upper body, broad shoulders, longer and thicker trunk and shorter extremities along with 41 percent slow twitch fibers compared to blacks’ 33 percent slow twitch fibers. This is why Europeans dominate power sports such as powerlifting and the World’s Strongest Man. Eighty to 100 percent of the differences in total variation in height, weight, and BMI between East Asians and Europeans are associated with genetic differences (Hur et al, 2008). If the variation between East Asians and Europeans on height, weight and BMI are largely attributed to genetic factors, then the same, I assume, should be true for Africans and Europeans/East Asians.
East Asians are the most endomorphic race and have lighter skeletons and more body fat. They have short arms and legs with a large trunk, which is a benefit when it comes to certain types of lifting movements (such as Olympic lifting, where East Asians shine) but hampers them when it comes to sprinting and distance running (although they have higher rates of type I fibers). East Asians also have more body fat at a lower BMI which is further evidence for the endomorphic somatype. This is also known as ‘TOFI’, ‘Thin on the Outside, Fat on the Inside’. Chinese and Thai children had a higher waist circumference and higher trunk fat deposits than Malay and Lebanese children (Liu et al, 2011). This is a classic description of the endomorphic individual.
Human hands and feet are also affected by climate. Climatic variation played a role in shaping the racial somatic differences we see today. The differences seen in hands and feet “might be due to the presence of evolutionary constraints on the foot to maintain efficient bipedal locomotion” (Betti et al, 2015).
Black-white differences in somatype
Fifty percent of the variability in lean mass is due to genetic factors (Arden and Specter, 1997) with the heritability of stature 85 percent in a meta-analysis (Peeters et al, 2009). Racial differences in somatype are also seen at a young age (Malina, 1969). Blacks had better muscular development and less fat-free mass at an early age. Vickery et al (1988) argued that since blacks have thinner skin folds that caliper measurements testing differences in body fat would be skewed. Malina (1969) also reports the same. Note that Malina’s paper was written in 1969, literally right before it got pushed on the American populace that fat was bad and carbohydrates were good.
Looking at the two tables cited by Malina (1969) on somatype we can see the difference between blacks and whites.
| Data from Malina, (1969: 438) | n | Mesomorph | Ectomorph | Endomorph |
| Blacks | 65 | 5.14 | 2.99 | 2.92 |
| Whites | 199 | 4.29 | 2.89 | 3.86 |
| Data from Malina (1969: 438) | Blacks | Whites |
| Thin-build body type | 8.93 | 5.90 |
| Submedium fatty development | 48.31 | 29.39 |
| Medium fleshiness | 33.69 | 43.63 |
| Fat and very fat categories | 9.09 | 21.06 |
Since this data was collected literally before we went down the wrong path and wrongly demonized fat and (wrongly) championed carbohydrates, this is an outstanding look at somatype/fat mass before the obesity epidemic. There is a clear trend, with blacks being more likely to have lower levels of fat-free body mass while also more likely to be mesomorphic. This has a ton of implications for racial differences in sports.
Somatype is predicated on lean mass, stature, bone density and fat-free body mass. Since racial differences appear in somatype at an early age, there is a great chance that the differences in somatype are genetic in nature.
College (American) football players are more likely to be endo-mesomorphs while high-school football players were more likely to be mesomorphs (Bale et al, 1994). This partly explains black over representation in football. Further, basketball, handball, and soccer players in Nigeria were taller, heavier, and had lower percent body fat than other athletic groups (Mazur, Toriola, and Igobokwe, 1985). Somatic differences have a lot to do with domination in sports competition.
Somatic differences are also seen in boxing. Elite boxers are more likely to have a mesomorphic somatype compared to non-athletes. Higher weight divisions were also more likely to be mesomorphic and endomorphic than the lower weight divisions which skewed ectomorphic (Noh et al, 2014). Blacks do well in boxing since they have a more mesomorphic somatype. Due to their higher levels of type II fibers, they can be quicker and throw more forceful punches which translates to boxing success.
Conclusion
Racial differences in somatype are another key to the puzzle to figure out why the races differ in elite sporting competition. The races evolved in different geographic locations which then led to differences in somatype. West African sports dominance is explained by their somatype, muscle fiber type, and physiology. The same can be said for Europeans in strength sports/powerlifting sports, and East Asians with ping-pong and some strength sports (though, due to lower muscle mass they are the least athletic of the races). I am not, of course, denying the impact of determination to succeed or training of any kind. What one must realize, however, is that one with the right genetic makeup/somatype and elite training will, way more often than not, outperform an individual with the wrong genetic makeup/somatype and elite training. These inherent differences between races explain the disparities in elite sporting competitions.
References
Arden, N. K., & Spector, T. D. (1997). Genetic Influences on Muscle Strength, Lean Body Mass, and Bone Mineral Density: A Twin Study. Journal of Bone and Mineral Research,12(12), 2076-2081. doi:10.1359/jbmr.1997.12.12.2076
Bale P, Colley E, Mayhew JL, et al. Anthropometric and somatotype variables related to strength in American football players. J Sports Med Phys Fitness 1994;34:383–9
Betti, L., Lycett, S. J., Cramon-Taubadel, N. V., & Pearson, O. M. (2015). Are human hands and feet affected by climate? A test of Allen’s rule. American Journal of Physical Anthropology,158(1), 132-140. doi:10.1002/ajpa.22774
Hur, Y., Kaprio, J., Iacono, W. G., Boomsma, D. I., Mcgue, M., Silventoinen, K., . . . Mitchell, K. (2008). Genetic influences on the difference in variability of height, weight and body mass index between Caucasian and East Asian adolescent twins. International Journal of Obesity,32(10), 1455-1467. doi:10.1038/ijo.2008.144
Liu, A., Byrne, N. M., Kagawa, M., Ma, G., Kijboonchoo, K., Nasreddine, L., . . . Hills, A. P. (2011). Ethnic differences in body fat distribution among Asian pre-pubertal children: A cross-sectional multicenter study. BMC Public Health,11(1). doi:10.1186/1471-2458-11-500
Malina, R. M. (1969). Growth and Physical Performance of American Negro and White Children: A Comparative Survey of Differences in Body Size, Proportions and Composition, Skeletal Maturation, and Various Motor Performances. Clinical Pediatrics,8(8), 476-483. doi:10.1177/000992286900800812
Mathur, D. N., Toriola, A. L., & Igbokwe, N. U. (1985). Somatotypes of Nigerian athletes of several sports. British Journal of Sports Medicine,19(4), 219-220. doi:10.1136/bjsm.19.4.219
Noh, J., Kim, J., Kim, M., Lee, J., Lee, L., Park, B., . . . Kim, J. (2014). Somatotype Analysis of Elite Boxing Athletes Compared with Nonathletes for Sports Physiotherapy. Journal of Physical Therapy Science,26(8), 1231-1235. doi:10.1589/jpts.26.1231
Peeters, M., Thomis, M., Beunen, G., & Malina, R. (2009). Genetics and Sports: An Overview of the Pre-Molecular Biology Era. Genetics and Sports Medicine and Sport Science, 28-42. doi:10.1159/000235695
Rushton J P (1997). Race, Evolution, and Behavior. A Life History Perspective (Transaction, New Brunswick, London).
Vickery SR, Cureton KJ, Collins MA. Prediction of body density from skinfolds in black and white young men. Hum Biol 1988;60:135–49.
Wilber, R. L., & Pitsiladis, Y. P. (2012). Kenyan and Ethiopian Distance Runners: What Makes Them so Good? International Journal of Sports Physiology and Performance,7(2), 92-102. doi:10.1123/ijspp.7.2.92
Possibly Retracting My Article on HBD and Baseball
700 words
I am currently reading Taboo: Why Black Athletes Dominate Sports and Why We’re Afraid To Talk About It and came across a small section in the beginning of the book talking about black-white differences in baseball. It appears I am horribly, horribly wrong and it looks like I may need to retract my article HBD and Sports: Baseball. However, I don’t take second-hand accounts as gospel, so I will be purchasing the book that Entine cites, The Bill James Baseball Abstract 1987 to look into it myself and I may even do my own analysis on modern-day players to see if this still holds. Nevertheless, at the moment disregard the article I wrote last year until I look into this myself.
Excerpt from Taboo: Why Black Athletes Dominate Sports and Why We’re Afraid To Talk About It:
Baseball historian Bill James, author of dozens of books on the statistical twists of his favorite sport believes this trend [black domination in baseball] is not a fluke. In an intriguing study conducted in 1987, he compared the careers of hundreds of rookies to figure out what qualities best predict who would develop into stars. He noted many intangible factors, such as whether a player stays fit or is just plain lucky. The best predictors of long-term career success included the age of the rookie, his defensive position as a determinant in future hitting success (e.g., catchers fare worse than outfielders), speed, and the quality of the player’s team. But all of these factors paled when compared to the color of the player’s skin.
“Nobody likes to write about race,” James noted apologetically. “I thought I would do a [statistical] run of black players against white players, fully expecting that it would show nothing in particular or nothing beyond the outside range of chance, and I would file it away and never mention that I had looked at the issue at all.
James first compared fifty-four white rookies against the same number of black first-year players who had comparable statistics. “The results were astonishing,” James wrote. The black players:
* went on to have better major-league careers in 44 out of 54 cases
* played 48 percent more games
* had 66 percent more major league hits
* hit 93 percent more triples
* hit 66 percent more home runs
* scored 69 percent more runs
* stole 400 more bases (Entine, 2000: 22-23)
…
Flabbergasted at what he found, James ran a second study using forty-nine black/white comparisons. Again, blacks proved more durable, retained their speed longer, and were consistently better hitters. For example, he compared Ernie Banks, a power hitting shortstop for the Chicago Cubs, and Bernie Allen who broke in with Minnesota. They both reached the majors when they were twenty-three years old, were the same height and weight, and were considered equally fast. Over time, Allen bombed and Banks landed in the Hall of Fame. (Entine, 2000: 24)
…
In an attempt to correct for possible bias, James compared players with comparable speed statistics such as the number of doubles, triples, and stolen bases. He ran a study focused on players who had little speed. He analyzed for “position bias” and made sure that players in the same eras were being compared. Yet every time he crunched the numbers, the results broke down across racial lines. When comparing home runs, runs scored, RBIs or stolen bases, black players held an advantage a startling 80 percent of the time. “And I could identify absolutely no bias to help explain why this should happen,” James said in disbelief.
James also compared white Hispanic rookies whom he assumed faced an uphill battle similar to that for blacks, with comparable groups of white and black players. The blacks dominated the white Latinos by even more than they did white North Americans, besting them in 19 of the 26 comparisons. Blacks played 62 percent more games, hit 192 more home runs, drove in 125 percent more runs, and stole 30 percent more bases.
So why have blacks become the stars of baseball far out of proportion to their relative numbers? James eventually concluded that there were two possible explanations: “Blacks are better athletes because they are born better athletes, which is to say that it is genetic, or that they are born equal and become better athletes. (Entine, 2000: 24-25)
Black-White Differences in Muscle Fiber and Its Role In Disease and Obesity
1700 words
How do whites and blacks differ by muscle fiber and what does it mean for certain health outcomes? This is something I’ve touched on in the past, albeit briefly, and decided to go in depth on it today. The characteristics of skeletal muscle fibers dictate whether one has a higher or lower chance of being affected by cardiometabolic disease/cancer. Those with more type I fibers have less of a chance of acquiring diabetes while those with type II fibers have a higher chance of acquiring debilitating diseases. This has direct implications for health disparities between the two races.
Muscle fiber typing by race
Racial differences in muscle fiber typing explain differences in strength and mortality. I have, without a shadow of a doubt, proven this. So since blacks have higher rates of type II fibers while whites have higher rates of type I fibers (41 percent type I for white Americans, 33 percent type I for black Americans, Ama et al, 1985) while West Africans have 75 percent fast twitch and East Africans have 25 percent fast twitch (Hobchachka, 1988). Further, East and West Africans differ in typing composition, 75 percent fast for WAs and 25 percent fast for EAs, which has to do with what type of environment they evolved in (Hochhachka, 1998). What Hochhachka (1998) also shows is that high latitude populations (Quechua, Aymara, Sherpa, Tibetan and Kenyan) “show numerous similarities in physiological hypoxia defence mechanisms.” Clearly, slow-twitch fibers co-evolved here.
Clearly, slow-twitch fibers co-evolved with hypoxia. Since hypoxia is the deficiency in the amount of oxygen that reaches the tissues, populations in higher elevations will evolve hypoxia defense mechanisms, and with it, the ability to use the oxygen they do get more efficiently. This plays a critical role in the fiber typing of these populations. Since they can use oxygen more efficiently, they then can become more efficient runners. Of course, these populations have evolved to be great distance runners and their morphology followed suit.
Caesar and Henry (2015) also show that whites have more type I fibers than blacks who have more type II fibers. When coupled with physical inactivity, this causes higher rates of cancer and cardiometabolic disease. Indeed, blacks have higher rates of cancer and mortality than whites (American Cancer Society, 2016), both of which are due, in part, to muscle fiber typing. This could explain a lot of the variation in disease acquisition in America between blacks and whites. Physiologic differences between the races clearly need to be better studied. But we first must acknowledge physical differences between the races.
Disease and muscle fiber typing
Now that we know the distribution of fiber types by race, we need to see what type of evidence there is that differing muscle fiber typing causes differences in disease acquisition.
Those with fast twitch fibers are more likely to acquire type II diabetes and COPD (Hagiwara, 2013); cardiometabolic disease and cancer (Caesar and Henry, 2015); a higher risk of cardiovascular events (Andersen et al, 2015, Hernelahti et al, 2006); high blood pressure, high heart rate, and unfavorable left ventricle geometry leading to higher heart disease rates and obesity (Karjalainen et al, 2006) etc. Knowing what we know about muscle fiber typing and its role in disease, it makes sense that we should take this knowledge and acknowledge physical racial differences. However, once that is done then we would need to acknowledge more uncomfortable truths, such as the black-white IQ gap.
One hypothesis for why fast twitch fibers are correlated with higher disease acquisition is as follows: fast twitch fibers fire faster, so due to mechanical stress from rapid and forceful contraction, this leads the fibers to be more susceptible to damage and thus the individual will have higher rates of disease. Once this simple physiologic fact is acknowledged by the general public, better measures can be taken for disease prevention.
Due to differences in fiber typing, both whites and blacks must do differing types of cardio to stay healthy. Due to whites’ abundance of slow twitch fibers, aerobic training is best (not too intense). However, on the other hand, due to blacks’ abundance of fast twitch fibers, they should do more anaerobic type exercises to attempt to mitigate the diseases that they are more susceptible due to their fiber typing.
Black men with more type II fibers and less type I fibers are more likely to be obese than ‘Caucasian‘ men are to be obese (Tanner et al, 2001). More amazingly, Tanner et al showed that there was a positive correlation (.72) between weight loss and percentage of type I fibers in obese patients. This has important implications for African-American obesity rates, as they are the most obese ethny in America (Ogden et al, 2016) and have higher rates of metabolic syndrome (a lot of the variation in obesity does come down food insecurity, however). Leaner subjects had higher proportions of type I fibers compared to type II. Blacks have a lower amount of type I fibers compared to whites without adiposity even being taken into account. Not surprisingly, when the amount of type I fibers was compared by ethnicity, there was a “significant interaction” with ethnicity and obesity status when type I fibers were compared (Tanner et al, 2001). Since we know that blacks have a lower amount of type I fibers, they are more likely to be obese.
In Tanner et al’s sample, both lean blacks and whites had a similar amount of type I fibers, whereas the lean blacks possessed more type I fibers than the obese black sample. Just like there was a “significant interaction” between ethnicity, obesity, and type I fibers, the same was found for type IIb fibers (which, as I’ve covered, black Americans have more of these fibers). There was, again, no difference between lean black and whites in terms of type I fibers. However, there was a difference in type IIb fibers when obese blacks and lean blacks were compared, with obese blacks having more IIb fibers. Obese whites also had more type IIb fibers than lean whites. Put simply (and I know people here don’t want to hear this), it is easier for people with type I fibers to lose weight than those with type II fibers. This data is some of the best out there showing the relationship between muscle fiber typing and obesity—and it also has great explanatory power for black American obesity rates.
Conclusion
Muscle fiber differences between blacks and whites explain disease acquisition rates, mortality rates (Araujo et al, 2010), and differences in elite sporting competition between the races. I’ve proven that whites are stronger than blacks based on the available scientific data/strength competitions (click here for an in-depth discussion). One of the most surprising things that muscle fibers dictate is weight loss/obesity acquisition. Clearly, we need to acknowledge these differences and have differing physical activity protocols for each racial group based on their muscle fiber typing. However, I can’t help but think about the correlation between strength and mortality now. This obesity/fiber type study puts it into a whole new perspective. Those with type I fibers are more likely to be physically stronger, which is a cardioprotectant, which then protects against all-cause mortality in men (Ruiz et al, 2008; Volaklis, Halle, and Meisenger, 2015). So the fact that black Americans have a lower life expectancy as well as lower physical strength and more tpe II fibers than type I fibers shows why blacks are more obese, why blacks are not represented in strength competitions, and why blacks have higher rates of disease than other populations.The study by Tanner et al (2001) shows that there obese people are more likely to have type II fibers, no matter the race. Since we know that blacks have more type II fibers on average, this explains a part of the variance in the black American obesity rates and further disease acquisition/mortality.
The study by Tanner et al (2001) shows that there obese people are more likely to have type II fibers, no matter the race. Since we know that blacks have more type II fibers on average, this explains a part of the variance in the black American obesity rates and further disease acquisition/mortality.
Differences in muscle fiber typing do not explain all of the variance in disease acquisition/strength differences, however, understanding what the differing fiber typings do, metabolically speaking, along with how they affect disease acquisition will only lead to higher qualities of life for everyone involved.
References
Araujo, A. B., Chiu, G. R., Kupelian, V., Hall, S. A., Williams, R. E., Clark, R. V., & Mckinlay, J. B. (2010). Lean mass, muscle strength, and physical function in a diverse population of men: a population-based cross-sectional study. BMC Public Health,10(1). doi:10.1186/1471-2458-10-508
Andersen K, Lind L, Ingelsson E, Amlov J, Byberg L, Miachelsson K, Sundstrom J. Skeletal muscle morphology and risk of cardiovascular disease in elderly men. Eur J Prev Cardiol 2013.
Ama PFM, Simoneau JA, Boulay MR, Serresse Q Thériault G, Bouchard C. Skeletal muscle characteristics in sedentary Black and Caucasian males. J Appl Physiol 1986: 6l:1758-1761.
American Cancer Society. Cancer Facts & Figures for African Americans 2016-2018. Atlanta: American Cancer Society, 2016.
Ceaser, T., & Hunter, G. (2015). Black and White Race Differences in Aerobic Capacity, Muscle Fiber Type, and Their Influence on Metabolic Processes. Sports Medicine,45(5), 615-623. doi:10.1007/s40279-015-0318-7
Hagiwara N. Muscle fibre types: their role in health, disease and as therapeutic targets. OA Biology 2013 Nov 01;1(1):2.
Hernelahti, M., Tikkanen, H. O., Karjalainen, J., & Kujala, U. M. (2005). Muscle Fiber-Type Distribution as a Predictor of Blood Pressure: A 19-Year Follow-Up Study. Hypertension,45(5), 1019-1023. doi:10.1161/01.hyp.0000165023.09921.34
Hochachka, P.W. (1998) Mechanism and evolution of hypoxia-tolerance in humans. J. Exp. Biol. 201, 1243–1254
Karjalainen, J., Tikkanen, H., Hernelahti, M., & Kujala, U. M. (2006). Muscle fiber-type distribution predicts weight gain and unfavorable left ventricular geometry: a 19 year follow-up study. BMC Cardiovascular Disorders,6(1). doi:10.1186/1471-2261-6-2
Ogden C. L., Carroll, M. D., Lawman, H. G., Fryar, C. D., Kruszon-Moran, D., Kit, B.K., & Flegal K. M. (2016). Trends in obesity prevalence among children and adolescents in the United States, 1988-1994 through 2013-2014. JAMA, 315(21), 2292-2299.
Ruiz, J. R., Sui, X., Lobelo, F., Morrow, J. R., Jackson, A. W., Sjostrom, M., & Blair, S. N. (2008). Association between muscular strength and mortality in men: prospective cohort study. Bmj,337(Jul01 2). doi:10.1136/bmj.a439
Tanner, C. J., Barakat, H. A., Dohm, G. L., Pories, W. J., Macdonald, K. G., Cunningham, P. R., . . . Houmard, J. A. (2001). Muscle fiber type is associated with obesity and weight loss. American Journal of Physiology – Endocrinology And Metabolism,282(6). doi:10.1152/ajpendo.00416.2001
Volaklis, K. A., Halle, M., & Meisinger, C. (2015). Muscular strength as a strong predictor of mortality: A narrative review. European Journal of Internal Medicine,26(5), 303-310. doi:10.1016/j.ejim.2015.04.013
Man the Athlete
5450 words
Homo nerdicus or Homo athleticus? Which name more aptly describes Man? Without many important adaptations incurred throughout our evolutionary history, modern Man as you see him wouldn’t be here today. The most important factor in this being our morphology and anatomy which evolved due to our endurance running, hunting, and scavenging. The topics I will cover today are 1) morphological differences between hominin species and chimpanzees; 2) how Man became athletic and bring up criticisms with the model; 3) the evolution of our aerobic physical ability and brain size; 4) an evolutionary basis for sports; and 5) the role of children’s playing in the evolution of human athleticism.
Morphological differences between Man and Chimp
Substantial evolution in the lineage of Man has occurred since we have split from the last common ancestor (LCA) with chimpanzees between 12.1 and 5.3 mya (Moorjani et al, 2016; Patterson et al, 2006). One of the most immediate differences that jump out at you when watching a human and chimpanzee is such stark differences in morphology, in particular, how we walk (pelvic differences) as well as our arm length relative to our torsos. Though we both evolved to be proficient at abilities that had us become evolutionarily successful in the environments we found ourselves in, one species of primate went on to become the apes the took over the world whereas the chimps continued life as the LCA did (as far as we can tell). The evolution of our athleticism is why we have a lean body with the right morphology for endurance running and associated movements. In fact, the evolution of our brain size hinged on a reduction in our fat depots (Navarette, Schaik, and Isler, 2011).
One of the largest differences you can see between the two species is how we walk. Chimps are “specially adapted for supporting weight on the dorsal aspects of middle phalanges of flexed hand digits II–V” (Tuttle, 1967). Meanwhile, humans are specifically adapted for bipedality due to the change in our pelvis over the course of our evolution (Gruss and Schmitt, 2015). Due to staying more arboreal than venturing on the ground, chimp morphology over the course of the divergence became more and more adapted to life in the trees.
Our modern gait is associated with physiologic and anatomic adaptations throughout our evolution, and are not ‘primitive retentions’ from the LCA (Schmitt, 2003). There are very crucial selective pressures that need to be looked at to see which selection pressures caused us to become athletes. Parts of Austripolithicenes still live on in us today, most notably in our lower leg/foot (Prang, 2015). Further, our ancestor, the famous Lucy had the beginnings of a modern pelvis, which was the beginning of the shift to the more energetically efficient bipedality, one thing that fully separates Man from the rest of the animal kingdom.
Of course, no conversation about human evolution would be complete without talking about Erectus. Analysis of 1.5 million-year-old footprints shows that Erectus was the first to have a humanlike weight transfer while walking, confirming “the presence of an energy-saving longitudinally arched foot in H. Erectus.” (Hatala et al, 2016). We have not yet discovered a full Homo erectus foot, but 1.5 million-year-old footprints found in Kenya show that whatever hominin made those prints had a long, striding gait with a full arch (Steudel-Numbers, 2006; Bennett et al, 2009). The same estimates from Steudel-Numbers (2006) show that Erectus nearly halved its travel costs compared to australopithecines. This is due to a longer stride which was much more Manlike than apelike due to a humanlike pelvis and gluteus maximus (Lieberman et al, 2006).
However, the most important adaptations that Erectus evolved was the ability to keep cool while walking long distances. Loss of hair loss specifically allowed individuals to be active in hot climates without overheating. Our ancestors’ hair loss facilitated sweating (Ruxton and Wilkinson, 2011b), which allowed us to become the proficient hunters—the athletes—that we would become. There is also thermoregulatory evidence that endurance running may have been possible for Homo erectus, but not any other earlier hominin (Ruxton and Wilkinson, 2011a) which was the beginnings of our selection to become athletes. The evidence reviewed in Ruxton and Wilkinson (2011a) shows that once hair loss and sweating ability reached human levels, thermoregulation was then possible under the midday sun.
Moreover, our modern gait and bipedalism is 75 percent less costly than quadrupedal/bipedal walking in chimpanzees (Sockel, Raichlen, and Pontzer, 2007), so this extra energy that was conserved with our physiologic and anatomic adaptations due to bipedalism could have gone towards other pertinent metabolic functions—like fueling a bigger brain (more energy could be used to feed more neurons).
Born to run
Before getting into how we are able to run so efficiently, I need to talk about what made it possible for us to be able to have the energy to sustain our distance running. That one thing is eating cooked food (meat). This one seemingly simple thing is the ‘prime mover’ so to speak, of our success as athletes. Eating cooked food significantly increases the amount of energy obtained during digestion. That we could extract more energy out of cooked food—no matter what type of food it was—can not be overstated. This is what gave us the energy to hunt and scavenge. We are, of course, able to hunt/scavenge while fasted, which is an extremely useful evolutionary adaptation which increases important hormones to have us search for food. The hormones released during a fasted state aid in human physiologic/metabolic functioning allowing one who is searching for food more heightened sensibilities.
We are evolutionarily adapted to be endurance runners. Endurance running is defined as the ability to run more than 5 km using aerobic metabolism (Lieberman and Bramble, 2007). Since we are poor sprinters, the idea is that our body has evolved for walking. However, numerous anatomical changes in our phenotypes in comparison to our chimp ancestors have left us some clues. In the previous section, I talked about physical changes that occurred after Man and Chimp diverged, well those evolutionary changes are why we evolved to be athletic.
Endurance running first evolved, most likely due to scavenging and hunting (Lieberman et al, 2009). Through natural selection—survival of the ‘good enough’, those who had better physiologic and anatomic adaptations could reach the animal carcass before other scavengers like vultures and hyenas could get to it. Over time, this substantially changed how we would look. Numerous physiologic changes in our lineage attest to the evolution of our endurance running. The nuchal ligament, as well as the radius of the semicircular canal is larger in Homo sapiens than in chimpanzees or australopithecines. This stabilizes our head while running—something that our ancestors could not do because they didn’t have a canal our size (Bramble and Lieberman, 2004).
Skeletal evidence that points to our evolution as athletes consists of (but not limited to):
- The Nuchal ligament—stabilizes the head
- Shoulder and head stabilization
- Limb length and mass (we have legs longer than our torsos which decreases energy used)
- Joint surface (we can absorb more shock when our feet hit the ground due to a larger surface area)
- Plantar arch (generates spring for running but not walking)
- Calcaneal tuber and Achilles tendon (shorter tuber length leads to a longer Achilles heel stretch, converting more kinetic energy into elastic energy)
So people who had anatomy closer to this in our evolutionary past had more of a success of getting to that animal carcass, divvying it amongst his family/tribe, ensuring the passage of his genes to the next generation. Man had to be athletic in order to be able to run for long distances. Where this would have come in handy the most would have been the Savanna in our ancestral past. Man could now use persistence hunting—chasing animals in the heat of the day—and kill them when they tired out. The evolutionary adaptation sweating due to the loss of our fur is the only reason this is possible.
One of the most important adaptations for endurance running is thermoregulation. All humans are adapted for long range locomotion rather than speed and to dump rather than retain heat (Lieberman, 2015). This is one of the most important adaptations we evolved that had us become successful endurance runners. We could chase down prey and wait for our prey to become exhausted/overheat and then we would move in for the kill. Of course, intelligence and sociality come into play as we needed to create hunting bands, but without our superior endurance running capabilities—that no other animal in the animal kingdom has—we would have gone down a completely different evolutionary path than the one we went down. Our genome has evolved to support endurance running (Mattson, 2012). Since there is an association between too much sitting and all-cause mortality (Biddle et al, 2016), this is yet more evidence that we evolved to be mobile, not sedentary hominins.
Further evidence that we evolved to be athletic is in our hands. When you think about our hands and how we can manipulate our environments with them—what sets us apart from every other species—then, obviously, in our evolutionary past, those who were more successful would have had a higher chance of reproducing. Aggressive clubbing and throwing are thought to be one of the earliest hominin specializations. If true, then those who could club and throw best would have the best chance of passing their genes to the next generation, thusly selecting for more efficient hands (Young, 2003). While we may have evolved more efficient hands over time warring with other hominins, some are more prone to disk herniation.
Plomp et al (2015) propose the ‘ancestral shape hypothesis’ which is derived from studying bipedalism. They propose that those who are more prone to disk herniation preferentially affects those who have vertebrae “towards the ancestral end of the range of shape variation within H. sapiens and therefore are less well adapted for bipedalism” (Plomp et al, 2015). One of the most amazing things they discovered was that humans with signs of intervertebral disc herniation are “indistinguishable from those of chimpanzees.” Of course, due to this, we should then look towards evolutionary biology in regards to a lot of human ailments (which I have also argued here on dietary evolutionary mismatches as well as on obesity).
Of course there are some naysayers arguing that endurance running didn’t drive our evolution. He wrongly states that it’s about what drove the evolution of our bipedalism; however, what the endurance running hypothesis argues is that there are certain physiologic and anatomic changes that only could have occurred from endurance running. Better endurance runners got selected for over time, leading to novel adaptations that stayed in the gene pool and got selected for. One thing is a larger gluteus maximus. A humanlike pelvis is found in the fossil record as far back as 1.9 mya in Erectus (Lieberman et al, 2006). Furthermore, longer toes had a larger mechanical cost, and were thusly selected against, which also helped in the evolution of our endurance running (Rolian et al, 2009). All in all, there are too many adaptations that our bodies have that can only be explained by adapting to endurance running. Just because we may have gotten to the weaker animals sometimes doesn’t falsify the hypothesis; Man still needed to sweat and persist in the hot mid-day temperatures chasing prey.
Brain size and aerobic physical capacity
When speaking about the increase in our brain size/neuronal count, fire/cooking, the social brain hypothesis, and other theories are brought up first. Erectus had a lot of humanlike qualities, including the ability to control/use fire (Berna et al, 2012), and the appearance of our modern gait/stride which first appeared in Erectus (Steudel-Numbers, 2006; Bennet et al, 2009). This huge change also occurred around the time our lineage began cooking meat/using fire. Without the increased energy from cooking, we wouldn’t be able to hunt for too long. However, we do have very important specific adaptations during a fasted state—the release of hormones such as catecholamines (adrenaline and noradrenaline) which have as react faster to predators/possible prey. Though, a plant-based diet wouldn’t cut it in regards to our daily energy requirements to feed our huge brain with a huge neuronal count (Fonseca-Azevedo and Herculano-Houzel, 2012). Cooked meat is the only way we’d be able to have enough energy required to hunt game.
What kind of an effect did it have on our cranial capacity/evolution?
Four groups of mice selectively bred for high amounts of “voluntary wheel-running”, ran 3 times further than the controls which increased Vo2 max in the mice. Those mice had higher levels of BDNF (Brain Derived Neurotrophic Factor) several days after the experiment concluded as well as also showing greater cell creation in the hippocampus when allowed to run compared to the controls. In two lines of selected mice, the hormone VEGF (Vascular Endothelial Growth Factor) which was correlated with higher muscle capillary density compared to controls. This shows that the evolution of endurance running in mice leads to important hormonal changes which then affected brain growth (Raichlen and Polk, 2012).
The amount of oxygen our brains use increased by 600 percent compared to 350 percent for our brain size over the course of our evolutionary history. This is important. What would cause an increase in oxygen consumption to the brain? Endurance running. There was further selection in our skeleton for endurance running in our morphology such as the semicircular canal radii. The first humanlike semicircular canal radii were found in Erectus (Spoor, Wood, and Zonneveid, 1994). This meant that we had the ability for running and other agile behaviors which were then selected for. There is also little to no activation of the gluteus medius while walking (Lee et al, 2014), implying that it evolved for more efficient endurance running.
Controlling for body mass in humans, extinct hominins and great apes, Raichlen and Polk (2012) found significant positive correlations with encephalization quotient and hindlimb length (0.93), anterior and posterior radii (0.77 and 0.66 respectively), which support the idea that human athletic ability is tied to neurobiological evolution. A man that was a better athlete compared to another would have a better chance to pass on his genes, as physical fitness is a good predictor of biological fitness. Putting this all together, selection improved our aerobic capacity over our evolutionary history by specifically altering signaling systems responsible for metabolism and oxygen intake (BDNF, VEGF, and IGF-1 (insulin-like growth factor 1), responsible for the regulation of growth hormone), which are important for blood flow, increased muscle capillary density, and a larger brain.
Putting this all together, selection improved our aerobic capacity over our evolutionary history by specifically altering signaling systems responsible for metabolism and oxygen intake (BDNF, VEGF, IGF-1). More evidence is needed to corroborate Raichlen and Polk’s (2012) hypothesis. However, with what we know about aerobic capacity and the hormones that drive it and brain size, we can make inferences based on the available data and say, with confidence, that part of our brain evolution was driven by our increased aerobic capacity/morphology, with the catalyst being endurance running. Though with our increased proclivity for athleticism and endurance running, when we became ‘us’, this just shifted the competition and athletic competition—which, hundreds of thousands/millions of years ago would mean life or death, mate or no mate, food or no food.
Clearly, without the evolution of our bipedalism/athleticism we wouldn’t have evolved the brains we have and thus we would be something completely different today.
Sport and evolutionary history
We crowd into arenas to watch people compete against each other in athletic competition. Why? What are the evolutionary reasons behind this? One view is that sport (and along with it playing) was a way for men to get practice hunting game, with playing also affecting children’s ability to assess the strength of others (Lombardo, 2012).
In an evolutionary context, sports developed as a way for men to further develop skills in order to better provide for his family, as well as assessing other men’s physical strength so he can adapt his fighting to how his opponent fights in a possible future situation. Men would then be selected for these advantageous traits. You see people crowd into arenas to watch their favorite sports teams. We are ‘wired’ to like these types of competitions, which then leads to more competition. Since we evolved to be athletes, then it would stand to reason that we would like to watch others be athletic (and hit each other as hard as they can), as a type of modern-day gladiator games.
Better hunters have better reproductive success (Smith, 2004). Further, hunter-gatherer men with lower-pitched voices have more children, while men with higher-pitched voices had higher child mortality rate (Apicella, Feinberg, and Marlowe, 2007). This signals that the H-G men with more children have higher testosterone than others, which then attracts more women to them. Champion athletes, hunters, and warriors all obtain high reproductive success. Women are sexually attracted to certain traits, which events of human athleticism show. However, men follow sports more closely than women (Lombardo, 2012), and for good reason.
Men may watch sports more than women since, in an evolutionary context, they may learn more about potential allies and who to steer clear from because they would get physically dominated. Further, men could watch the actions of others at play and mimic their actions in an attempt to gain higher status with women. Another reason is a man’s character: you can see a man’s character during sports competition and by watching one’s actions closely during, for instance, playing, you can better ascertain their motivations during life or death situations. Men may also derive thrills from watching “idealized men” perform athletic activities. These are consistent with Lombardo’s (2012) male lek hypothesis, “where male physical prowess and the behaviors important in conflict and cooperation are displayed by athletes and evaluated primarily by male, not female, spectators.”
Testosterone changes based on whether one’s favorite sports team wins or loses (Bernhardt et al, 1998). This is important. Testosterone does change under stressful/group situations. Testosterone is also argued to have a role in the search for, and maintenance of social status (Eisenegger, Haushofer, and Fehr, 2011). Testosterone responses to competition in men are also related to facial masculinity (Pound, Penton-Voak, and Surrin, 2009). Male’s physical strength is also signaled through facial characteristics of dominance and masculinity, considered attractive to women (Fink, Neave, and Seydel, 2007). Since testosterone fuels both competition, protectiveness and confidence (Eisenegger et al, 2016), a woman would be attracted to a man’s athleticism/strength, which would then be correlated with his facial structure further signaling biological fitness to possible mates. Testosterone doesn’t cause prostate cancer, as is commonly stated (Stattin et al, 2003; Michaud, Billups, and Partin, 2015). Testosterone is a beneficial hormone; you should be worried way more about low T than high T. Further, young men interacting with similar young men increases testosterone while interacting with dissimilar men decreases testosterone (DeSoto et al, 2009). This lends credence to the hypothesis that testosterone raises in response to male-male competition.
Since testosterone is correlated with the above traits, and since athletes have higher testosterone than non-athletes (Wood and Stanton, 2011) then certain types of males would be left in the dust. Athleticism can be looked at as a way to expend excess energy. Those with more excess energy would be more sexually attractive to women and mating opportunities would increase. This is why it’s ridiculous to believe that we evolved to be the ‘nerds’ of the animal kingdom when so much of our evolutionary success has hinged on our athleticism and superior endurance running and other athletic capabilities.
Playing
Child’s play is how children feel out the world in a ‘setting’ in which there are no real-world consequences so they can get a feel for how the world really is. Human babes are born helpless, yet with large heads. Natural selection has lead to large brains to care for children, causing earlier childbirths and making children more helpless, which selected for higher intelligence causing a feedback loop (Piantadosi and Kidd, 2016). They show that across the primate genera, the helplessness of an infant is an extremely strong predictor of adult intelligence.
Indeed, a lot of the crucial shaping of our intelligence and motor capabilities are developed in our infancy and early childhood, which we have over chimpanzees. Blaisdell (2015) defines play as: “an activity that is purposeless in that it tends to be detached from the outcome, is imperfect from the goal-directed form of the activity, and that tends to occur when the individual is in a non-stressed state.” Playing is just a carefree activity that children do to get a feel for the world around them. During this time, skills are honed that, in our ancestral past, allowed us to survive and prosper during times of need (persistence hunting, scavenging, etc).
Anthropological evidence also suggests that the existence of extended childhood in humans adapted to establish the skills and knowledge needed to be a proficient hunter-gatherer. Since there are no real-world outcomes to playing (other than increased/decreased pride), a child can get some physical experience without suffering the real life repercussions of failing. Studies of hunter-gatherers show that play fosters the skills needed to be proficient in tool-making and tool-use, food provisioning, shelter, and predator defense. Play time also hones athletic ability and the brain-body connection so one can be prepared for a stressful situation. In fact, children’s fascination with ‘why’ questions make them ‘little philosophers’, which is an evolutionary adaptation to prepare for possible future outcomes.
Think of play fighting. While play fighting, the outcome has no important real life applications (well, the loser’s pride is hit) and what is occurring is the honing of skills that are useful to survival. During our ancestral evolution, play fighting between brothers could have honed the skills needed during a life our death situation when another band of humans was encountered. As you begin to associate certain movements with certain events, you then become better prepared subconsciously for when novel situations occur. The advantage of an extended childhood with large amounts of play time allow the brain and body to make certain connections between things and when these situations arise during a life or death situation, the brain-body will already have the muscle memory to handle the situation.
Conclusion
Studying our evolution since the divergence between Man and chimp, we can see the types of adaptations that we have incurred over our evolutionary history that have lead to us being specifically adapted for long-term endurance running. The ability to sweat, which, as far as we know began with Erectus, was paramount in our history for thermoregulation. Looking at the evolution of our pelvis, toes, gluteal muscles, heads, shoulders, brains, etc all will point to how they are adapted to a bipedal ape that is born to run—born to be an athlete. Without our athleticism, our intelligence wouldn’t be possible. We have a brain-body connection, our brain isn’t the only thing that drives our body, the two work in concert giving each other information, reacting to familiar and novel stimuli. That’s for another time though.
We didn’t evolve to be Homo nerdicus, we evolved to be Homo athleticus. This can be seen with how exercise has such a huge impact on cognition. We can further see the relationship between our athletic ability and our cognition/brain size. Without the way our evolution happened, Man—along with everything else you see around you—would not be here today. In a survival situation—one in which society completely breaks down—one who has better control over his body and motor functions/capabilities will outlast those who do not. Ultimate and conscious control over our bodies, reacting to stimuli in the environment is fostered in our infancy during our play time with others. Playing allows an individual to get experience in a simulated event, getting important muscle memory to react to future situations. The brain itself, of course, is being molded during playing as well. This just attests to the large part that playing has on cognition, survival skills and athletic ability over our evolutionary history.
Aerobic capacity throughout our evolutionary history beginning with Erectus was paramount for what we have become today. Without the evolution of certain muscles like our gluteus maximus along with certain appendages that gave us the ability to trek/run long distances, we would have lost a very important variable in our brain evolution. Aerobic activity increases blood flow to the brain and so the more successful endurance runners/hunters would increase their biological fitness (as seen in Smith, 2004) and thusly those who were more athletically successful would have more children, increasing selection for important traits for endurance running/athleticism throughout our evolutionary history.
We still play sports today since we love competition. Testosterone fuels the need for competition and sports is the best way to engage in competition in the modern day. Women are much more attracted to men with higher levels of testosterone which in turn means a more masculinized face which signals dominance and testosterone levels during competition. Women are attracted to men with higher levels of testosterone and a more masculinized face. This just so happens to mirror athletes, who have both of these traits. However, being in top physical condition is not enough; an athlete must also have a strong mental background if, for instance, they wish to break world records (Lippi, Favaloro, and Guidi, 2008).
The evolution of human playing ties this together. These sports competitions that we have made hearken back to our evolutionary past and show who would have fared best in the past. When we play, we are feeling our competition and who we can possibly make allies with/watch out for due to their actions during playing. One would also see who he would likely need to avoid and form an alliance with as to not get on his bad side and prevent a loss of status in his band. This is what it really comes down to—loss of status. Higher-status men do have higher levels of testosterone, and by one losing to a more capable person, they show that they aren’t fit to lead and they fall in the social hierarchy.
To fully understand human evolution and how we became ‘us’ we need to understand the evolution of our morphology and how it pertains to things such as our cognition and overall brain size and what advantages/disadvantages it afforded us. Whatever the case may be, it’s clear that we have evolved to be athletic and any change in that makeup will lead to a decrease in quality of life.
Homo athleticus, not Homo nerdicus, best describes Man.
References
Apicella, C. L., Feinberg, D. R., & Marlowe, F. W. (2007). Voice pitch predicts reproductive success in male hunter-gatherers. Biology Letters,3(6), 682-684. doi:10.1098/rsbl.2007.0410
Biddle, S. J., Bennie, J. A., Bauman, A. E., Chau, J. Y., Dunstan, D., Owen, N., . . . Uffelen, J. G. (2016). Too much sitting and all-cause mortality: is there a causal link? BMC Public Health,16(1). doi:10.1186/s12889-016-3307-3
Bennett, M. R., Harris, J. W., Richmond, B. G., Braun, D. R., Mbua, E., Kiura, P., . . . Gonzalez, S. (2009). Early Hominin Foot Morphology Based on 1.5-Million-Year-Old Footprints from Ileret, Kenya. Science,323(5918), 1197-1201. doi:10.1126/science.1168132
Berna, F., Goldberg, P., Horwitz, L. K., Brink, J., Holt, S., Bamford, M., & Chazan, M. (2012). Microstratigraphic evidence of in situ fire in the Acheulean strata of Wonderwerk Cave, Northern Cape province, South Africa. Proceedings of the National Academy of Sciences,109(20). doi:10.1073/pnas.1117620109
Bernhardt, P. C., Jr, J. M., Fielden, J. A., & Lutter, C. D. (1998). Testosterone changes during vicarious experiences of winning and losing among fans at sporting events. Physiology & Behavior,65(1), 59-62. doi:10.1016/s0031-9384(98)00147-4
Blaisdell, A. P. (2015). Play as the Foundation of Human Intelligence: The Illuminating Role of Human Brain Evolution and Development and Implications for Education and Child Development. Journal of Evolution and Health,1(1). doi:10.15310/2334-3591.1016
Bramble, D. M., & Lieberman, D. E. (2004). Endurance running and the evolution of Homo. Nature,432(7015), 345-352. doi:10.1038/nature03052
Desoto, M. C., Hitlan, R. T., Deol, R. S., & Mcadams, D. (2010). Testosterone Fluctuations in Young Men: The Difference between Interacting with like and Not-Like others. Evolutionary Psychology,8(2), 147470491000800. doi:10.1177/147470491000800203
Eisenegger, C., Haushofer, J., & Fehr, E. (2011). The role of testosterone in social interaction. Trends in Cognitive Sciences,15(6), 263-271. doi:10.1016/j.tics.2011.04.008
Eisenegger, C., Kumsta, R., Naef, M., Gromoll, J., & Heinrichs, M. (2016). Testosterone and androgen receptor gene polymorphism are associated with confidence and competitiveness in men. Hormones and Behavior. doi:10.1016/j.yhbeh.2016.09.011
Fink, B., Neave, N., & Seydel, H. (2006). Male facial appearance signals physical strength to women. American Journal of Human Biology,19(1), 82-87. doi:10.1002/ajhb.20583
Fonseca-Azevedo, K., & Herculano-Houzel, S. (2012). Metabolic constraint imposes tradeoff between body size and number of brain neurons in human evolution. Proceedings of the National Academy of Sciences,109(45), 18571-18576. doi:10.1073/pnas.1206390109
Gruss, L. T., & Schmitt, D. (2015). The evolution of the human pelvis: changing adaptations to bipedalism, obstetrics and thermoregulation. Philosophical Transactions of the Royal Society B: Biological Sciences,370(1663), 20140063-20140063. doi:10.1098/rstb.2014.0063
Hatala, K. G., Roach, N. T., Ostrofsky, K. R., Wunderlich, R. E., Dingwall, H. L., Villmoare, B. A., . . . Richmond, B. G. (2016). Footprints reveal direct evidence of group behavior and locomotion in Homo erectus. Scientific Reports,6, 28766. doi:10.1038/srep28766
Lee, S., Lee, S., & Jung, J. (2014). Muscle Activity of the Gluteus Medius at Different Gait Speeds. Journal of Physical Therapy Science,26(12), 1915-1917. doi:10.1589/jpts.26.1915
Lieberman, D. E., Raichlen, D. A., Pontzer, H., Bramble, D. M., & Cutright-Smith, E. (2006). The human gluteus maximus and its role in running. Journal of Experimental Biology,209(11), 2143-2155. doi:10.1242/jeb.02255
Lieberman, D. E., & Bramble, D. M. (2007). The Evolution of Marathon Running. Sports Medicine,37(4), 288-290. doi:10.2165/00007256-200737040-00004
Lieberman, D. E., Bramble, D. M., Raichlen, D. A., & Shea, J. J. (2009). Brains, Brawn, and the Evolution of Human Endurance Running Capabilities. Vertebrate Paleobiology and Paleoanthropology The First Humans – Origin and Early Evolution of the Genus Homo, 77-92. doi:10.1007/978-1-4020-9980-9_8
Lieberman, D. E. (2015). Human Locomotion and Heat Loss: An Evolutionary Perspective. Comprehensive Physiology, 99-117. doi:10.1002/cphy.c140011
Lippi, G., Favaloro, E. J., & Guidi, G. C. (2008). The genetic basis of human athletic performance. Why are psychological components so often overlooked? The Journal of Physiology,586(12), 3017-3017. doi:10.1113/jphysiol.2008.155887
Lombardo, M. P. (2012). On the Evolution of Sport. Evolutionary Psychology.
Mattson, M. P. (2012). Evolutionary aspects of human exercise—Born to run purposefully. Ageing Research Reviews,11(3), 347-352. doi:10.1016/j.arr.2012.01.007
Michaud, J. E., Billups, K. L., & Partin, A. W. (2015). Testosterone and prostate cancer: an evidence-based review of pathogenesis and oncologic risk. Therapeutic Advances in Urology,7(6), 378-387. doi:10.1177/1756287215597633
Moffit, D. M., & Swanik, C. B. (2011). The Association between Athleticism, Prenatal Testosterone, and Finger Length. Journal of Strength and Conditioning Research,25(4), 1085-1088. doi:10.1519/jsc.0b013e3181d4d409
Moorjani, P., Amorim, C. E., Arndt, P. F., & Przeworski, M. (2016). Variation in the molecular clock of primates. doi:10.1101/036434
Navarrete, A., Schaik, C. P., & Isler, K. (2011). Energetics and the evolution of human brain size. Nature,480(7375), 91-93. doi:10.1038/nature10629
Patterson, N., Richter, D. J., Gnerre, S., Lander, E. S., & Reich, D. (2006). Genetic evidence for complex speciation of humans and chimpanzees. Nature,441(7097), 1103-1108. doi:10.1038/nature04789
Piantadosi, S. T., & Kidd, C. (2016). Extraordinary intelligence and the care of infants. Proceedings of the National Academy of Sciences,113(25), 6874-6879. doi:10.1073/pnas.1506752113
Pound, N., Penton-Voak, I. S., & Surridge, A. K. (2009). Testosterone responses to competition in men are related to facial masculinity. Proceedings of the Royal Society B: Biological Sciences,276(1654), 153-159. doi:10.1098/rspb.2008.0990
Plomp, K. A., Viðarsdóttir, U. S., Weston, D. A., Dobney, K., & Collard, M. (2015). The ancestral shape hypothesis: an evolutionary explanation for the occurrence of intervertebral disc herniation in humans. BMC Evolutionary Biology,15(1). doi:10.1186/s12862-015-0336-y
Prang, T. C. (2015). Rearfoot posture of Australopithecus sediba and the evolution of the hominin longitudinal arch. Scientific Reports,5, 17677. doi:10.1038/srep17677
Raichlen, D. A., & Polk, J. D. (2012). Linking brains and brawn: exercise and the evolution of human neurobiology. Proceedings of the Royal Society B: Biological Sciences,280(1750), 20122250-20122250. doi:10.1098/rspb.2012.2250
Rolian, C., Lieberman, D. E., Hamill, J., Scott, J. W., & Werbel, W. (2009). Walking, running and the evolution of short toes in humans. Journal of Experimental Biology,212(5), 713-721. doi:10.1242/jeb.019885
Ruxton, G. D., & Wilkinson, D. M. (2011). Avoidance of overheating and selection for both hair loss and bipedality in hominins. Proceedings of the National Academy of Sciences,108(52), 20965-20969. doi:10.1073/pnas.1113915108
Ruxton, G. D., & Wilkinson, D. M. (2011). Thermoregulation and endurance running in extinct hominins: Wheeler’s models revisited. Journal of Human Evolution,61(2), 169-175. doi:10.1016/j.jhevol.2011.02.012
Schmitt, D. (2003). Insights into the evolution of human bipedalism from experimental studies of humans and other primates. Journal of Experimental Biology,206(9), 1437-1448. doi:10.1242/jeb.00279
Schulkin, J. (2016). Evolutionary Basis of Human Running and Its Impact on Neural Function. Frontiers in Systems Neuroscience,10. doi:10.3389/fnsys.2016.00059
Smith, E. A. (2004). Why do good hunters have higher reproductive success? Human Nature,15(4), 343-364. doi:10.1007/s12110-004-1013-9
Sockol, M. D., Raichlen, D. A., & Pontzer, H. (2007). Chimpanzee locomotor energetics and the origin of human bipedalism. Proceedings of the National Academy of Sciences,104(30), 12265-12269. doi:10.1073/pnas.0703267104
Spoor, F., Wood, B., & Zonneveld, F. (1994). Implications of early hominid labyrinthine morphology for evolution of human bipedal locomotion. Nature,369(6482), 645-648. doi:10.1038/369645a0
Stattin, P., Lumme, S., Tenkanen, L., Alfthan, H., Jellum, E., Hallmans, G., . . . Hakama, M. (2003). High levels of circulating testosterone are not associated with increased prostate cancer risk: A pooled prospective study. International Journal of Cancer,108(3), 418-424. doi:10.1002/ijc.11572
Steudel-Numbers, K. L. (2006). Energetics in Homo erectus and other early hominins: The consequences of increased lower-limb length. Journal of Human Evolution,51(5), 445-453. doi:10.1016/j.jhevol.2006.05.001
Tuttle, R. H. (1967). Knuckle-walking and the evolution of hominoid hands. American Journal of Physical Anthropology,26(2), 171-206. doi:10.1002/ajpa.1330260207
Wood, R. I., & Stanton, S. J. (2012). Testosterone and sport: Current perspectives. Hormones and Behavior,61(1), 147-155. doi:10.1016/j.yhbeh.2011.09.010
Young, R. W. (2003). Evolution of the human hand: the role of throwing and clubbing. Journal of Anatomy,202(1), 165-174. doi:10.1046/j.1469-7580.2003.00144.x
Racial Differences in Muscle Fiber Typing Cause Differences in Elite Sporting Competition
1050 words
Blacks are, on average, better at sports than whites. Why? The answer is very simple: muscle fiber typing. Most individuals have an even proportion of muscle fibers, skewing about 5 to 10 percent less on type II fibers. However, when it comes to elite competition, race—and along with it muscle fiber typing—come into play more. Who is stronger? Why? Who is faster? Why? Who is better at endurance running? Why? The answers to these questions lie in muscle fiber typing, somatype, and, of course, grit and determination. Today I will provide yet more evidence for my argument that whites are stronger than blacks.
Muscle fiber typing by race
I’ll be quick here since I’ve covered this extensively.
Blacks have more type II muscle fibers in comparison to whites who have more type I muscle fibers. This difference in fiber typing causes differences in aerobic capacity which lead to higher rates of cardiorespiratory diseases such as type II diabetes, heart disease, and hypertension.
There are two types of muscle fibers with two divisions: Type I and Type II with the divisions being in the slow twitch fiber, further broken down into Type IIa and Type II x. Type I fibers fire slowly and possess greater aerobic metabolic capacity due to higher levels of lipid, myoglobin, mitochondrial and capillary content. Type II fibers, on the other hand, fire faster, have reduced aerobic capacity (and all that comes with it) and are better equipped for anaerobic activity (explosive sports). Type IIa possesses more aerobic potential than IIx, but less anaerobic potential than type I fibers. Some evidence exists showing that it’s possible to train type II fibers to have a similar aerobic capacity to type I, but I don’t really buy that. It is possible to make aerobic capacity similar to the aerobic capacity that type I fibers have, but type II will not be fully like them.
Blacks have more type II fibers while whites have more type I fibers. Type II fibers predispose people to a myriad of cardiometabolic diseases which are also associated with grip strength.
Differences in fiber typing in elite athletes
Now comes the fun part. How do muscle fibers differ between elite athletes? A few studies have been done but, as expected in physiology studies, they have a low n, but they still do show physiologic differences when compared to the control subjects, physiologic differences that were predicted due to what we know about muscle fiber typing.
Type IIa fibers possess more aerobic potential than IIx, therefore, power lifters have a higher proportion of IIa fibers compared to IIx fibers. It should also be noted that powerlifters have the same amount of type I fibers as the general population (Fry et al, 2003a), so knowing this fact, since blacks have a lower proportion of type I muscle fibers as noted in Caeser and Hunter (2015), this explains why there are very few black power lifters: they have the opposite type II fiber type while having less type I fiber.
Furthermore, Olympic lifters also use a higher percentage of type IIa fibers (Fry et al, 2003b). This also explains the lower amount of blacks in weight lifting as well. Fiber types don’t explain everything, but at elite levels, they do mean a lot and looking at the racial variation explains racial differences in elite sporting competition.
Explaining racial differences in sprinting competitions is easy as well. Type IIx fibers combined with the ACTN3 gene=elite human performance (Mills et al, 2001). The gene ACTN3 was discovered to explain explosive power, and it just so happened to vary by race. William Saletan writes:
the relative frequency of the X allele is 0.52 in Asians, 0.42 in whites, 0.27 in African-Americans, and 0.16 in Africans. If you break out the data further, the frequency of the XX genotype is 0.25 in Asians, 0.20 in European whites, 0.13 in African-Americans, and 0.01 in African Bantu. Conversely, the frequency of RR (the genotype for speed and power) is 0.25 in Asians, 0.36 in European whites, 0.60 in African-Americans, and 0.81 in African Bantu. Among Asians, you can expect to find one RR for every XX. Among whites, you can expect nearly two RRs for every XX. Among African-Americans, you can expect more than four RRs for every XX.
This allele is responsible for explosive power. Explosive power is needed to excel in events such as sprinting, football, basketball and other sports where power is needed in short bursts. However, where blacks have an advantage in explosive power sports, the advantage is lost once events like swimming, power lifting (described above), Olympic lifting (differing fiber type) etc.
Conclusion
Racial differences in elite sporting competition come down to a lot of genetic factors, largely influenced by hormones, genes, and muscle fiber typing. Population variation between known fiber typings/hormones/genes that affect certain types of athletic performance explains a lot of the variation within, and especially between populations. Due to anatomical differences, blacks excel at some sports and suffer at others. The same also holds for whites; there is considerable variation in somatype, some somatypes are better for strongman/powerlifting competitions than others. These differences affect the outcomes of elite sporting competition as well.
Blacks have a higher amount of type II fibers, which accounts for a lot of their disease acquisition (Caesar et al, 2015). Due to this physiologic difference, this is why blacks excel at some sports, and not others.
Once again: Blacks are not stronger than whites.
(Note: Click here for discussion on Kenyan distance running.)
References
Ceaser, T., & Hunter, G. (2015). Black and White Race Differences in Aerobic Capacity, Muscle Fiber Type, and Their Influence on Metabolic Processes. Sports Medicine,45(5), 615-623. doi:10.1007/s40279-015-0318-7
Fry, A. C., Webber, J. M., Weiss, L. W., Harber, M. P., Vaczi, M., & Pattison, N. A. (2003). Muscle Fiber Characteristics of Competitive Power Lifters. The Journal of Strength and Conditioning Research,17(2), 402. doi:10.1519/1533-4287(2003)017<0402:mfcocp>2.0.co;2
Fry, A. C., Schilling, B. K., Staron, R. S., Hagerman, F. C., Hikida, R. S., & Thrush, J. T. (2003). Muscle Fiber Characteristics and Performance Correlates of Male Olympic-Style Weightlifters. Journal of Strength and Conditioning Research,17(4), 746-754. doi:10.1519/00124278-200311000-00020
Mills, M., Yang, N., Weinberger, R., Vander Woude, D., Beggs, A., Easteal, S., & North, K. (2001). Differential expression of the actin-binding proteins, alpha-actinin-2 and -3, in different species: implications for the evolution of functional redundancy. Human Molecular Genetics,10(13), 1335-1346. doi:10.1093/hmg/10.13.1335
Racial Differences in Grip Strength
1700 words
Strength differences between the races are of big interest to me. Not only due to the evolutionary perspective, but also due to how it relates to health and disease. Hand grip strength (HGS) in men is a good predictor of: Parkinson’s disease (Roberts et al, 2015); lower cardiovascular health profile (Lawman et al, 2016); Alzheimer’s disease (Buchman et al, 2007) and other chronic diseases in men, not in women (Cheung et al, 2013). HGS also predicts diabetes and hypertension (Mainous 3rd et al, 2015), as well as death from all causes, cardiovascular disease (CVD) and cancer in men (Gale et al, 2006). Due to these associations, the study of HGS in men is well warranted. However, here too, we find racial differences and they just so happen to follow trends and corroborate with other data on the mortality of men with lower grip strength.
Araujo et al (2010) obtained data from the Boston Community Health/Bone (BACH/Bone) Survey which included 1,219 randomly selected black, white and ‘Hispanic’ men to assess lean mass, muscle strength, and physical function. Though out of this sample, 10 men didn’t have a DXA performed and 49 men missing data on lean mass, fat mass and Physical Activity for the Elderly (PASE), which left 1,157 men to be analyzed. These studies, however, leave a lot to be desired in how they measure strength (for the purposes that I’m interested in) but they will have to do, for now. Unlike the bench pressing study I wrote about yesterday in which calipers were used to assess body fat, in this study they measured body fat with the DXA scan to assess lean mass. That way, there won’t be any potential confounds, possibly skewing lean mass/fat comparisons. The age of the cohort ranged from 30 to 79 with a mean age of 48.
Table 1 shows the results of the DXA scan, anthropometric data and lean and fat mass. Blacks’ mean lean mass of 124 pounds (mean weight 193 pounds), ‘Hispanics” lean mass was 114 pounds (mean weight 179 pounds) and whites had a mean lean mass of 122 pounds (mean weight 196 pounds). Blacks had a mean grip strength of 89.826 pounds while ‘Hispanics’ had a mean grip strength of 82.698 pounds and whites had a mean grip strength of 88.528 pounds. Blacks had a higher lean mass index than whites by 5 percent, but had a composite physical function score 20 percent lower than whites.
White men had a 25 percent higher average composite physical functioning score, which, when indexed by lean mass and grip, white men had grips 10 percent stronger. White men also scored higher on physical function and lean mass. White men had lower levels of lean muscle mass than blacks and ‘Hispanics’ after controlling for confounding factors, yet whites were still stronger. Since lean mass is related to strength, blacks and ‘Hispanics’ should have had a stronger grip, yet they didn’t. Why?
The authors stated that the reason was unknown since they didn’t test for muscle quality or strength exerted for each unit of muscle. I have proven that whites, on average, are stronger than blacks. If the it were true that blacks were stronger, which is what you see upon first glance viewing table 1 of Araujo et al (2010), then the black population would have lower rates of morbidity and mortality due to higher levels of strength. The black population doesn’t have lower levels of morbidity or mortality. Therefore blacks are not stronger than whites.
Muscular strength is associated with mortality in men (Ruiz et al, 2008; Volaklis, Halle, and Meisenger, 2015), so if the strongest race of men has lower incidences of the above diseases mentioned above along with a higher life expectancy, then there is a good chance that muscular strength is a good predictor of disease within and between race and ethnicity as well. Muscular strength is inversely associated with death from all causes and cancer in men even after adjusting for cardiorespiratory factors. The findings from Ruiz et al (2008) are valid for young and old men (aged 20-82), as well as normal and overweight men.
There are clear associations between muscular strength/hand grip strength and mortality. These differences in mortality are also seen in the United States between race. In 2012, the death rate for all cancer combined was 24 percent higher in black men than in white men. Life expectancy is lower for blacks at 72.3 years compared to 76.7 years for white men (American Cancer Society, 2016). As shown above, men with lower levels of muscular strength have a higher risk of mortality.
As I have asserted in the past, blacks have differing muscle fiber typing (type II) on average when compared to whites (who have type I fibers). Type II muscle fibers are associated with a reduced Vo2 max, which has implications for the health of black Americans. Blacks have lower aerobic capacity along with a greater percentage of type II skeletal muscle fiber (Caesar and Hunter, 2015).
Slow twitch fibers fire through aerobic pathways. Fast twitch (Type II) fibers fire through anaerobic pathways and tire quicker than slow twitch. Each fiber fires off through different pathways, whether they be anaerobic or aerobic. The body uses two types of energy systems, aerobic or anaerobic, which then generate Adenosine Triphosphate, better known as ATP, which causes the muscles to contract or relax. Depending on the type of fibers an individual has dictates which pathway muscles use to contract which then, ultimately, dictate if there is high muscular endurance or if the fibers will fire off faster for more speed.
Differences in muscle fiber typing explain why whites had a stronger grip than non-whites in the BACH/Bone survey. Testing the fiber typings of the three ethnies would have found a higher percentage of type II fibers in blacks, which would account for the lower grip strength despite having higher levels of lean mass when compared to whites.
The apparent ‘paradox’ seen in Araujo et al (2010) is explained by basic physiology. However, in our politically correct society, such differences may be suppressed and thusly people won’t be able to receive the help they need. Race is an extremely useful marker in regards to medicine. By denying average racial differences in numerous anatomical/metabolic/physiologic traits, we deny people the right help they need. Common sense dictates that if such relationships are found, then further research must occur in order to find the cause and a possible solution to the problem.
This study by Araujo et al shows that we need to pay more attention to race when it comes to disease. By denying racial differences we are dooming people to a lower quality of life due to the implicit assumption that we are all the same on the inside (farrrrr from the truth). These average differences in metabolism, anatomy, and physiology do account for some of the variation in disease between race and ethnicity, so this warrants further research. If only we, as a country, can acknowledge racial differences and get people the correct help. Maybe one day we can stop assuming that all races are equal on the inside and when you notice a trend within a particular racial group you find out the cause and whether or not there is any way to ameliorate it.
Muscular strength adds to the protective effect of cardiorespiratory fitness and risk of death in men. That blacks have lower levels of strength than whites, have different muscle fiber typing than whites on average, a lower life expectancy than whites, and higher rates of cancer show that they do not have the physical strength that whites do. What really seals the deal is the fact that blacks have more type II muscle fibers (Caesar and Hunter, 2015). Muscular strength/grip strength is a great predictor of disease in men. Since blacks have lower grip strength yet higher levels of lean mass compared to whites, this show that the difference is due to muscle fiber typing, which, as I have covered in the past, are also associated with cardiometabolic disease and obesity.
Blacks have the highest rate of obesity in America. Looking at obesity rates in America, we see that 69 percent of black men are overweight or obese (remember that black Americans with more African ancestry are less likely to be obese), 71.4 percent of white men are overweight or obese, and 78.6 percent of ‘Hispanic’ men are overweight or obese (Ogden et al, 2016).
Blacks are not stronger than whites. I have compiled enough data to prove that fact. This adds further support for my contention.
References
American Cancer Society. Cancer Facts & Figures for African Americans 2016-2018. Atlanta: American Cancer Society, 2016.
Araujo, A. B., Chiu, G. R., Kupelian, V., Hall, S. A., Williams, R. E., Clark, R. V., & Mckinlay, J. B. (2010). Lean mass, muscle strength, and physical function in a diverse population of men: a population-based cross-sectional study. BMC Public Health,10(1). doi:10.1186/1471-2458-10-508
Buchman, A. S., Wilson, R. S., Boyle, P. A., Bienias, J. L., & Bennett, D. A. (2007). Grip Strength and the Risk of Incident Alzheimer’s Disease. Neuroepidemiology,29(1-2), 66-73. doi:10.1159/000109498
Ceaser, T., & Hunter, G. (2015). Black and White Race Differences in Aerobic Capacity, Muscle Fiber Type, and Their Influence on Metabolic Processes. Sports Medicine,45(5), 615-623. doi:10.1007/s40279-015-0318-7
Cheung, C., Nguyen, U. D., Au, E., Tan, K. C., & Kung, A. W. (2013). Association of handgrip strength with chronic diseases and multimorbidity. Age,35(3), 929-941. doi:10.1007/s11357-012-9385-y
Gale, C. R., Martyn, C. N., Cooper, C., & Sayer, A. A. (2006). Grip strength, body composition, and mortality. International Journal of Epidemiology,36(1), 228-235. doi:10.1093/ije/dyl224
Lawman, H. G., Troiano, R. P., Perna, F. M., Wang, C., Fryar, C. D., & Ogden, C. L. (2016). Associations of Relative Handgrip Strength and Cardiovascular Disease Biomarkers in U.S. Adults, 2011–2012. American Journal of Preventive Medicine,50(6), 677-683. doi:10.1016/j.amepre.2015.10.022
Mainous, A. G., Tanner, R. J., Anton, S. D., & Jo, A. (2015). Grip Strength as a Marker of Hypertension and Diabetes in Healthy Weight Adults. American Journal of Preventive Medicine,49(6), 850-858. doi:10.1016/j.amepre.2015.05.025
Ogden C. L., Carroll, M. D., Lawman, H. G., Fryar, C. D., Kruszon-Moran, D., Kit, B.K., & Flegal K. M. (2016). Trends in obesity prevalence among children and adolescents in the United States, 1988-1994 through 2013-2014. JAMA, 315(21), 2292-2299.
Roberts, H. C., Syddall, H. E., Butchart, J. W., Stack, E. L., Cooper, C., & Sayer, A. A. (2015). The Association of Grip Strength With Severity and Duration of Parkinson’s. Neurorehabilitation and Neural Repair,29(9), 889-896. doi:10.1177/1545968315570324
Ruiz, J. R., Sui, X., Lobelo, F., Morrow, J. R., Jackson, A. W., Sjostrom, M., & Blair, S. N. (2008). Association between muscular strength and mortality in men: prospective cohort study. Bmj,337(Jul01 2). doi:10.1136/bmj.a439
Volaklis, K. A., Halle, M., & Meisinger, C. (2015). Muscular strength as a strong predictor of mortality: A narrative review. European Journal of Internal Medicine,26(5), 303-310. doi:10.1016/j.ejim.2015.04.013
