
Human Physiological Adaptations to Climate
1750 words
Humans are adapted to numerous ecosystems on earth. This is only possible due to how our physiological systems interact with the environment in a homeodynamic way. This allowed us to spread across the globe, far away from our ancestral home of Africa, and thusly certain adaptations evolved in those populations—which was driven by our intelligent physiology. I will touch on human cold and hot adaptations, how physiology adapts to the two climates and what this means for the populations that make up Mankind.
Physiological adaptations to Arctic climates
The human body is one of the most amazing and complex biological systems on earth. The human body lives and dies on its physiology and how it can adapt to novel environments. When Man first trekked out of Africa into novel environments, our physiology adapted so we could survive in novel conditions. Over time, our phenotypes adapted to our new climates and humans began looking different from one another due to the climatic differences in their environments.
There is a large body of work on human cold adaptation. Thermal balance in humans is maintained by “vasodilation/vasoconstriction of the skin and peripheral tissues within the so-called thermo-neutral zone” (Daanen and Lichtenbelt, 2016). Two other adaptations occur in the cold: shivering thermogenesis (ST) and non-shivering thermogenesis (NST) and one in the heat (the evaporation of sweat). Humans are not Arctic animals by nature, so, therefore, venturing into novel environments would incur new physiological adaptations to better deal with the cold.
Heat is induced by the body in cold climates by shivering (Tikuisis, Bell, and Jacobs, 1991; Daanen and Lichtenbelt, 2016). So, therefore, people in colder climates will have higher metabolisms than people in tropical environments, to generate more body heat for vital functioning. People living in Arctic environments have fewer sweat glands than people who live in the tropics. Sweating removes heat from the body, so having more sweat glands in colder climates would not be conducive for survival.
People who evolved in Arctic climates would also be shorter and have wider pelves than people who evolved in the tropics. This is seen in Neanderthals and is an example of Cold adaptations also show up in the Greenlandic Inuit due to extinct hominins like the Denisova (Fumagalli et al, 2015).
We can see natural selection at work in the Inuits, due to adaptation to Arctic climates (Galloway, Young, and Bjerregaard, 2012; Cardona et al, 2014; Ford, McDowell, and Pierce, 2015; NIH, 2015; Harper, 2015; Tishkoff, 2015). Climate change is troubling to some researchers, with many researchers suggesting that global warming will have negative effects on the health and food security of the Inuit (WHO, 2003; Furgal and Seguin, 2006; Wesche, 2010; Ford, 2009, 2012; Ford et al, 2014, 2016; McClymont and Myers, 2012; Petrasek, 2014; Petrasek et al, 2015; Rosol, Powell-Hellyer, and Chan, 2016). This Inuit are the perfect people to look to to see how humans adapt to novel climates—especially colder ones. They have higher BMIs which is better for heat retention, and larger brains with wider pelves and a shorter stature.
Metabolic adaptations also occur due to BMI, which would occur due to diet and body composition. Daanen and Lichtenbelt, (2016) write:
Bakker et al.,48 however, showed that Asians living in Europe had lower BAT prevalence and exhibited a poorer shivering and non-shivering response to cold than Caucasians of similar age and BMI. On the other hand, subjects living in polar regions have higher BMI, and likely more white fat for body energy reserves and insulation.49 This cannot be explained by less exercise,50 but by body composition51 and food intake.49
Basal metabolic rate (BMR) also varies by race. Resting metabolic rate is 5% higher in white women when compared to black women (Sharp et al, 2002). Though low cardiovascular fitness explains 25 percent of the variance in RMR differences between black and white women (Shook et al, 2014). People in Arctic regions have a 3-19 higher BMR than predicted on the basis of the polar climates they lived in (Daanen and Lichtenbelt, 2016). Further, whites had a higher BMR than Asians living in Europe. Nigerian men were seen to have a lower BMR than African-American men (Sharp et al, 2002). So, whites in circumpolar locales have a higher BMR than peoples who live closer to the equator. This has to do with physiologic and metabolic adaptations.
Blacks also show slower and lower cold induced vasodilation (CIVD) than whites. A quicker CIVD in polar climates would be a lifesaver.
However, just our physiologic mechanisms alone aren’t enough to weather the cold. Our ingenuity when it comes to making clothes, fire, and finding and hunting for food are arguably more important than our bodies physiologic ability to adapt to its present environment. Our behavioral plasticity (ability to change our behavior to better survive in the environment) was also another major factor in our adaptation to the cold. Then, cultural changes would lead to genetic changes, and those cultural changes—which were due to the cold climates—would then lead to more genetic change and be an indirect effect of the climate. The same, obviously, holds for everywhere in the world that Man finds himself in.
Physiologic changes to tropical climates
Physiologic changes in tropical climates are very important to us as humans. We needed to be endurance runners millions of years ago, and so our bodies became adapted for that way of life through numerous musculoskeletal and physiologic changes (Lieberman, 2015). One of the most important is sweating.
Sweating is how our body cools itself and maintains its body temperature. When the skin becomes too hot, your brain, through the hypothalamus, reacts by releasing sweat through tens of millions of eccrine glands. As I have covered in my article on the evolution of human skin variation, our loss of fur (Harris, 2009) in our evolutionary history made it possible for sweat to eventually cool our body. Improved sweating ability then led to higher melanin content and selection against fur. Another hypothesis is that when we became bipedal, our bodies were exposed to less solar radiation, selecting against the need for fur. Yet another hypothesis is that trekking/endurance running led to selection for furlessness, selecting for sweating and more eccrine glands (Lieberman, 2015).
Anatomic changes include long and thin bodies with longer limbs as heat dissipation is more efficient. People who live in tropical environments have longer limbs than people who live in polar environments. These tall and slender bodies are what is useful in that environment. People with long, slender bodies are disadvantaged in the cold. Further, longer, slender bodies are better for endurance running and sprinting. They also have narrower hips which helps with heat dissipation and running—which means they would have smaller heads than people in more northerly climes. Most adaptations and traits were once useful in whichever environment that organism evolved in tens of thousands of years ago. And certain adaptations from our evolutionary past are still evident today.
Since tropical people have lower BMRs than people at more northerly climes, this could also explain why, for instance, black American women, have higher rates of obesity than women of other races. They have a lower BMR and are sedentary and eat lower-quality food so food insecurity would have more of an effect on that certain phenotype. Africans wouldn’t have fast metabolisms since a faster metabolism would generate more heat.
Physiologic changes due to altitude
The last adaptation I will talk about is how our bodies can adapt to high altitudes and how it’s beneficial. Many human populations have adapted to the chronic hypoxia of high latitudes (Bigham and Les, 2014) which, of course, has a genetic basis. Adaptation to high altitudes also occurred due to the introgression of extinct hominin genes into modern humans.
Furthermore, people in the Andean mountains, people living in the highlands of Kenya and people living on the Tibetan plateau have shown that the three populations adapted to the same stress through different manners. Andeans, for instance, breathe the same way as people in lower latitudes but their red blood cells carry more oxygen per cell, which protects them from the effects of hypoxia. They also have higher amounts of hemoglobin in their blood in comparison to people who live at sea level, which also aids in counterbalancing hypoxia.
Tibetans, on the other hand, instead of having hematological adaptations, they have respiratory adaptations. Tibetans also have another adaptation which expands their blood vessels, allowing the whole body to deliver oxygen more efficiently to different parts. Further, Ethiopians don’t have higher hemoglobin counts than people who live at sea level, so “Right now we have no clue how they do it [live in high altitudes without hematologic differences in comparison to people who live at sea level]”.
Though Kenyans do have genetic adaptations to live in the highlands (Scheinfeldt et al, 2012). These genetic adaptations have arisen independently in Kenyan highlanders. The selective force, of course, is hypoxia—the same selective force that caused these physiologic changes in Andeans and Tibetans.
Conclusion
The human body is amazing. It can adapt both physiologically and physically to the environment and in turn heighten prospects for survival in most any environment on earth. These physiologic changes, of course, have followed us into the modern day and have health implications for the populations that possess these changes. Inuits, for instance, are cold-adapted while the climate is changing (which it constantly does). So, over time, when the ice caps do melt the Arctic peoples will be facing a crisis since they are adapted to a certain climate and diet.
People in colder climates need shorter bodies, higher body fat, lower limb ratio, larger brains etc to better survive in the cold. A whole slew of physiologic processes aids in peoples’ survival in the Arctic, but our ability to make clothes, houses, and fire, in conjunction with our physiological dynamicness, is why we have survived in colder climates. Tropical people need long, slender bodies to better dissipate heat, sweat and run. People who evolved in higher altitudes also have hematologic and respiratory adaptations to better deal with hypoxia and less oxygen due to living at higher elevations.
These adaptations have affected us physiologically, and genetically, which leads to changes to our phenotype and are, therefore, the cause of how and why we look different today. Human biological diversity is grand, and there are a wide variety of adaptations to differing climates. The study of these differences is what makes the study of Man and the genotypic/phenotypic diversity we have is one of the most interesting sciences we have today, in my opinion. We are learning what shaped each population through their evolutionary history and how and why certain physical and physiologic adaptations occurred.
Diet and Exercise: Don’t Do It?
1800 words
On Twitter, JayMan linked to a video about a time traveling dietician who travels back to the 70s to give nutritional advice to a couple. He kept going back on what he said, re eggs and cholesterol, Paleo diet, etc. Then at the end of the video, the ‘time traveling dietician’ says “It turns out it’s genetic. It doesn’t matter whether you exercise or what you eat.”
I then asked JayMan if he was advising people to not diet or exercise—and if he was doing so—what credentials does he have to give such advice? “Appeal to authority!” So if some random guy gave me legal advice and I asked his credentials, is that an appeal to authority? Similarly, if someone is trying to give me medical advice, is asking where he got his medical license an appeal to authority? The thing is, people have specialties for a reason. I wouldn’t take diet and exercise advice from some anon blogger with no credentials, just like I wouldn’t take legal advice from a biologist. Anyway, I’ll review some studies on exercise, dieting, and sitting in regards to all-cause mortality.
Sitting and all-cause mortality
Listening to such advice—like not dieting or exercising—will lower your quality of life and life expectancy. The longer you sit, the more likely you are to have rolled shoulders among other postural imbalances. One of the biggest reasons that sitting is related to all-cause mortality (Chau et al, 2013; Biddle et al, 2016). So listening to this shitty advice to ‘not exercise’ will lead an individual to having a lower QoL and lower life expectancy.
Sitting is associated with all-cause mortality because if, say, one is sitting at a desk for 8 hours per day then goes home and sits for the rest of the day, circulation will not get not get to the lower extremities. Furthermore, even mild-to-moderate exercise attenuates the situation (Chau et al, 2013). Further, reducing sedentary behavior (and of course, watching less TV) can possibly raise life expectancy in the US (Katzmarzyk and Lee, 2012). They found that cutting daily sitting time to less than three hours can increase life expectancy by two years (and, of course, quality of life). There is a large body of research on sitting and all-cause mortality (Stamatakis et al, 2013). It’s also worth noting that too much sitting decreases life expectancy—even with exercise. So JayMan’s (unprofessional) advice will lead to someone having a shitty life quality and lower life expectancy.
Dieting, and all-cause mortality
This is a bit trickier. I know that dieting for weight loss doesn’t work (Aamodt, 2016; Fung, 2016)—that is, traditional dieting (high-carb diets). The traditional advice is to eat high-carb, low-fat and moderate protein—this is due to what occurred in the 70s—the demonization of fat and the championing of carbs. This, clearly, is wrong. This has led to the obesity epidemic and the cause is our evolutionary novel environments. The main reason is that we have constructed environments for ourselves that are novel, and thus we’ve not had enough time to adapt to what we eat/how we live our new lives in our modernized world.
Indeed, even hunter-gathers don’t have our disease rates that we have—having low to no cases of our diseases of civilization (see Taubes, 2007 for a review). Why is this? It’s because they are physically active and they do not eat the same processed carbohydrates that we in first-world societies do.
In regards to exercise and all-cause mortality, people who exercise more often have a lower chance of dying from all causes than more sedentary people (Oja et al, 2016; O’Donovan et al, 2017). So it’s becoming clear that JayMan is just talking out out his ass here. I’d love to hear any MD say to a patient “Don’t diet, don’t exercise. Don’t eat well. It doesn’t work.” Because that MD will be a shill for Big Food.
Further, when I say ‘diet’, I don’t mean eating below the BMR. Your ‘diet’ is what you eat, and by changing your diet, you’re changing to healthier habits and eating higher-quality foods. People like JayMan make it seem like you should eat whatever you want and not to exercise. Following this advice, however, will lead to deleterious consequences.
It DOES matter what you put into your body; it DOES matter if you exercise or not. If you do not, you will have a lower life expectancy than who does exercise and eats well.
On a side note, I know that dieting does not work for weight loss. Traditional dieting, that is. Dr. Jason Fung, world-renowned obesity, diabetes and intermittent fasting expert, has people lose and keep their weight off. He actually understands what causes obesity—insulin. Higher insulin levels are also tied to the obesity pathway through lack of glucagon receptors (Lee et al, 2014). Why is this important? First, we have to understand what insulin does in the body. Once you understand what insulin does in the body then you will see why JayMan is wrong.
Insulin inhibits the breakdown of fat in the adipose tissue by inhibiting the lipase that hydrolyzes (the chemical breakdown of a compound due to a reaction with water) the fat out of the cell. Since insulin facilitates the entry of glucose into the cell, when this occurs, the glucose is synthesized into glycerol. Along with the fatty acids in the liver, they both are synthesized into triglycerides in the liver. Due to these mechanisms, insulin is directly involved with the shuttling of more fat into the adipocyte. Since insulin has this effect on fat metabolism in the body, it has a fat-sparing effect. Insulin drives most cells to prefer carbohydrates for energy. Putting this all together, insulin indirectly stimulates the accumulation of fat into the adipose tissue.
Does this physiologic process sound that you can ‘eat whatever you want’? Or does it tell you that you should lower your carb intake as to not induce blood glucose spikes which lead to an increase in insulin? Over time, these constant blood glucose/insulin spikes lead to insulin resistance which has the body produce more insulin due to the insulin resistance resulting in a vicious cycle.
So, it seems that in order to have a higher QoL and life expectancy, one must consume processed carbs very sparingly.
These behaviors of over consuming processed carbohydrates come down to the environments we have constructed for ourselves—obesogenic environments. An obesogenic environment “refers to an environment that helps, or contributes to,
obesity” (Powell, Spears, and Rebori, 2010).
Our current obesogenic environment also contributes to dementia and cognitive impairment. What makes environments ‘obesogenic’ “is the increased presence of food cues and the increased consumption of a diet which compromises our ability to resist those cues” (Martin and Davidson, 2015). So if our obesogenic environments change, then we should see a reduction in the number of overweight/obese people.
Diet is very important for Type II diabetics. For instance, TII diabetics can manage, and even reverse, their disease with a low-carb ketogenic diet (LCKD) lowering their hBA1c, having a better lipid profile, cardiac benefits, weight loss etc (Westman et al, 2008; Azar, Beydoun, and Albadri, 2016; Noakes and Windt, 2016; Saslow et al, 2017). I wonder if JayMan would tell TII diabetics not to diet or exercise…. That’d be a recipe for disaster. TII diabetics need to keep their insulin down and eating an LCKD will do that; taking JayMan’s ‘advice’ not to diet or exercise will quickly lead to more weight gain, an exacerbation of problems and, eventually, death due to complications from not correctly managing the disease. JayMan needs to learn the literature and understand these papers to truly understand why he is wrong.
Exercise and all-cause mortality
The relationship between vigorous exercise and all-cause mortality is well studied. Gebel et al (2015) conclude that “Independent of the total amount of physical activity, engaging in some vigorous activity was protective against all-cause mortality. This finding applied to both sexes, all age categories, people with different weight status, and people with or without cardiometabolic disease.” Reduced exercise capacity also causes higher all-cause mortality rates (McAuley et al, 2016).
Unfit thin people had two times higher mortality rate than normal weight fit people. Further, overweight and obese fit people had similar mortality rates when compared to normal weight fit people (Barry et al, 2013). Clearly, physical activity needs to be heightened if one wants to live a longer, higher quality life. This runs completely opposite of what JayMan is implying.
Exercise into old age is also related to higher cognition and lower mortality rate in when compared to individuals who do not exercise. Exercise also protects against cognitive degeneration in the elderly (Bherer, Erikson and Lie-Ambrose, 2013; Carvalho et al, 2014; Paillard, 2015). If you want to keep your cognition into old age and live longer, it seems like your best bet is to exercise at a young age in order to stave off cognitive degeneration.
Strength and mortality
Finally, one last thing I need to touch on is strength and mortality. Strength is, obviously, increased through exercise. Stronger men live longer—and are protected from more disease such as cancer—than weaker men, even when controlling for cardiorespiratory fitness and other confounds (Ruiz et al, 2008).
As I have covered in the past, differences in grip strength account for differences in mortality in men—which also has a racial component (Araujo et al, 2010; Volkalis, Halle, and Meisinger, 2015). The stronger you are, the less chance you have of acquiring cancer and other maladies. Does the advice of ‘don’t exercise’ sound good now? It doesn’t, and I don’t know why anyone would seriously imply that dieting and exercise doesn’t work.
Conclusion
Dieting (meaning eating a higher quality diet, not attempting to lose weight) and exercise do work to increase life expectancy. The advice of “don’t do anything, it’s genetic” makes no sense at all after one sees the amount of literature there is on eating mindfully and exercising. I know that exercise does not induce weight loss, but it does contribute to living longer and staving off disease.
People should stay in their lane and leave things to the professionals—the people who are actually working with individuals every day and know and understand what they are going through. The canard of ‘eat whatever, don’t exercise, it’s genetic’ is very dangerous, especially today when obesity rates are skyrocketing. JayMan needs to learn the literature and how and why exercise and eating right leads to a higher quality of life and life expectancy. Thankfully, people like JayMan who say not to diet or exercise have no pull in the real world.
Clearly, to live longer, eat right, don’t sit for too long (because even if you exercise, sitting too long will lower your life expectancy) and exercise into old age and your chance of acquiring a whole slew of deleterious diseases will be lessened.
Did we come from Australasia?
by Phil78 3179 words
In a recent response to the MCU7 genetic admixture from Archaic, it has been argued that if this entered the Sub Saharan Genome at 145 kya, every population by OOA standards should have it.
Not necessarily, as the study noted how their findings conform to recent findings that actually ground African Origins.
Our finding agrees with recent reports of such an introgression in
sub Saharan African populations (Hammer et al. 2011; Hsieh et al. 2016), as well as the
unexpectedly old human remains (Hublin et al. 2017) and lineages (Schlebusch et al. 2017).
In other words, what I’m thinking is that this connects somewhere with the Basal human component model for West Africans and some LSA finds, though that is for another day.
Now, as for the alternative model that I’ve seen advertise by the site RedIce, we now come to a recent newcomer, Bruce Fenton.
Now, before I begin my criticism of his premise of a new “paradigm”, I like to say that the reviews I’ve seen (Amazon) he certainly seems to have talent in writing. However, reading this article, and other summaries of his model, I must say I’m not tempted to buy his book based on his confidence of his basic model “filling in holes” in OOA and treating it debunked, especially when his sources all more or less can be conformed into OOA 2.
First, let us go into how he rules out both Africa and Europe due to recent Neanderthal DNA from Neanderthals from Spain.
Research by the geneticists Benoit Nabholz, Sylvain Glémin, and Nicolas Galtier has revealed significant problems with scientific studies that rely heavily on genetic material alone, divorced from the physical examination of fossils (especially in the accuracy of dating by molecular clocks).[i] We are however fortunate to have a 2013 research project from Indiana University, headed by well-respected evolutionary biologist Aida Gómez-Robles at our disposal: a comparative analysis of European hominin fossil teeth and jawbones. The Indiana University project concluded that all the fossil hominins in Europe were either Neanderthals or directly ancestral to Neanderthals – not ancestors of Homo sapiens. We must understand that while respective groups in Africa match European hominin populations, this revelation discounted all known African hominins as being ancestors of modern humans. The morphological research also provided further shock – the divergence between Homo sapiens and Neanderthals had apparently begun as early as one million years before present.
Odd how he made that leap when the researcher he cites actually says otherwise on Africa as a candidate.
From the new study’s results, Gómez-Robles says that “we think that candidates have to be looked for in Africa.” At present, million-year-old fossils attributed to the prehistoric humans H. rhodesiensis and H. erectus look promising.
Fenton then further mention Denisovan diverging, using DNA, as 800k and the places the ancestor of all three between 700-900.
His Response? This finding from China.
The first possible answer to this ‘where to look’ question came in July 2016 with scientist Professor Zhao Lingxiain, whose research group announced they had identified modern human fossil remains at the Bijie archaeological site ranging up to 180,000 years old.[i] Not only were they digging up fragments of modern humans, but also evidence of other mysterious hominin forms. The Chinese paleoanthropologists suspected that some of the recovered fossils might even be from the mysterious Denisovans, previously identified in Siberia.[i] Could modern humans have first emerged in East Asia? It has certainly begun to look like this might be the case. My independent investigative research carried out over the last several years, however, disagrees: my work places the first Homo sapiens in Australasia.
For the context of how this can still conform to OOA, the actual range was 112k to 178k, and while this muddies the typical 50k to 80k migration it can still fit in the 90k to 130k Migration of the Levant that was presumed to have all been wiped out.
Back in 1982, two of the most renowned evolutionary scientists of the modern age, Professor Alan Wilson and his understudy, Rebecca Cann, discovered compelling evidence for an Australasian genesis for modern humans. These controversial findings never emerged in any of their academic papers; in fact, they only appear in a short transcript included in a book published in the same year by two British research scientists, The Monkey Puzzle: A Family Tree. Silence does not change facts, and the fact remains that there is compelling DNA evidence pointing towards Australasia as the first home of Homo sapiens. Indeed, so much data exists that it eventually led to my controversial new book, The Forgotten Exodus: The Into Africa Theory of Human Evolution. My research colleagues and myself have uncovered overwhelming evidence that places the first modern humans in Australasia, and with them several other advanced hominin forms.
There might be some temptation to dismiss this matter out of hand, as it can be difficult accepting that leading academics have got it so wrong. It is, however, important to understand that in every case the opposing arguments against the current consensus position are based on, or supported by, peer-reviewed studies or statements given by consensus academics. Could it be that the year 2016 will one day be known as the year that the Out of Africa paradigm died?
If 2016 becomes associated with the end of one scientific paradigm, then 2017 may become related to the emergence of a new model for human origins, one that I am proposing and have termed ‘Into Africa’. My Into Africa theory is closely related to the ‘Out of Australia’ theory formulated by two of my Australian collaborators, Steven and Evan Strong, but goes significantly further down the rabbit hole of our evolutionary story.
I’d wish he supported this unreplicated genetic study (as far as I know) with actual archaeological continuity in Australasia because so far, pre-sapiens people there are generally Erectus-like, his own sources on the matter supporting that view.
He summarizes both Multiregional and OOA theory (single recent origin), then proceeds to his own.
[UPDATE– Something that I pondered was exactly what pattern of migration did Cann produce? Well, based on two articles produced by Steve Strong, who I believe is an associate of Fenton, shows that my suspicions were correct.
The pattern found was Australoids- Mongoloids- Caucasians, Negroids/SSA, the opposite of Fenton’s Framework. I figured that, regardless of where Australians fit, the affinity of groups wouldn’t change. Strong has another article in which he uses a paper linking origins to Australia which was covered on this blog here as well as covering Denisovans which, as I shown in this post, to fit fine in OOA 2 aside from some complications in mapping precisely the nature of smaller migration into SE Asia.
Regarding Cain’s findings as a whole, the sample size of the study was one among many that were small and covered a week range of the Native’s populations in general, as discussed and somewhat ameliorated here.
With that realized, study after study after study places them in a 50k-55k Time Frame, more or less consistent with Archaeological dates, may LM3 (Mungo Man) be either 40k or 60k. It must also be kept in mind that Cann’s findings existed prior to the knowledge of Denisovan admixture, which possibly could’ve skewed divergence dates, as explained by Dienekes. This gives a good reason for Cann’s findings to be seen as erroneous. In regards to Strong’s citing of Vanderburg, it shows his specialty in this sort of work if “unique haplotypes” aren’t a natural result of human differentiation.
Regarding Archaeology from both articles, Strong makes the point of even earlier findings not popularly reported in Australia, ranging from 60-135k for fossils, older for tools and scorching. Not only are these younger than the currently oldest Sapiens in Africa, but also in the time frame of a currently known exodus into SE Asia discussed in the post, even if they were legit as I’ll dive into detail.
Reference of certain sites of >100k estimates has been shown to be much more recent, being originally confounded by less accurate techniques. The same could apply to cremated bones listed as well. This leaves the mysterious “Lake Eyre Skullcap” by Steve Webb which, as far as I can tell, has been only scarcely covered. However, only in that source is it reported as that old, as both newspapers and scientific newsletters reports at that time reported it as 60-80 years old using Fluorine-dating, referring specifically to Megafauna that was believed to have existed 30k-40k years ago that it may have coexisted with.
Webbs wrongly compares the Flourine dates relative to the values of the Mungo remains, when this type of dating works best for relative ages on specimens that are on the same site or comparable conditions, of similar density (he describes them as more Robust than Mungo remains), similar size (Uses Large and small animals, but logically it would also apply to mere fragment to more whole remains), and for humans particularly Ribs or Cortical bone layers should be compared.
But an even odder argument of his is how the earliest tools in Australia, being found to be less advanced than other tools of the same time frame mean people sailed from Australia. What this could more likely mean is that they were “simplified” based on Lifestyle, as covered in a previous blog post on Expertise, Brain size, and Tool complexity.]
In my model, I offer compelling evidence for three key migrations of Homo sapiens heading out of Australasia. The first migrations began around 200,000 years ago, during a period of intense climatic problems and low population numbers, with a small group making their way to East Africa.[i] The remains of some of these first Africans have been discovered close to one key entry point in the east of the continent (400km), known as the Bab-el-Mandeb straights.[i]
I then identify a second migration event 74,000 years ago, following the eruption of the Lake Toba super volcano.[i] Small groups of survivors to the north of Lake Toba, finding themselves unable to move south to safety, were then forced to head west to escape the devastating nuclear winter and toxic clouds that followed the disaster. The lucky few that could move fast enough eventually made their way into Africa and found safety in the south of the continent. I suggest that some of these few moved along the coasts of Asia, and others sailed the open ocean to Madagascar and hit the coast of South Africa – I associate these refugees with cave sites including Borders Cave, Klasies River Caves and the Blombos Cave.[i]
The problem with this is due to the previously mentioned finds in Morocco making Sapiens much older in Africa and further West. Though climate conditions, by the way, based on his link provides no reason for it to be centered at Australasia as it was described to affect Africa’s interior.
Second, the South African caves he describes contains specimens, likely to have contributed to modern South Africans, show deeper genetic roots than what he suggests when they diverged.
But the most glaring problem is that none of his sources shows Sapiens skeletons or activity prior to that in Africa, Indonesia clearly not having a confounding enough preservation problem due to its Erectus sites.
The third migration event identified in my research is arguably of greatest interest because it involved the direct ancestors of all non-African people alive today. As the global environment recovered from the Lake Toba eruption 60,000 years ago, a trickle of modern humans (calculated to be just under 200 individuals) moved out of Australasia into Southeast Asia, slowly colonising the Eurasian continent.[i] These adventurous men and women were the forebears of every non-African and non-Australian person living on Earth today. This Australasian colonisation of the world is very well supported by the study of both mitochondrial and Y-chromosomal haplogroups, and given further credence by the location and dating of several fossils.
This oddly enough goes against what we show with “180k” teeth of a modern human in China, that’s not accounted for in his sequence of African-Eurasian dispersal from Australasia.
He also goes against an earlier point he made by “relying on genetic material”, as he himself has yet to provided H.sapiens being present in the Area.
The model I offer represents a radical revision to the current evolutionary narrative, and is perhaps revolutionary. It will not be easy for academics to accept such bold claims from someone whom is neither a paleoanthropologist or an evolutionary biologist. Why, then, should one take this work seriously?
The Into Africa theory is firmly based on real-world evidence, data that anyone can freely access and examine for themselves. My argument incorporates a great wealth of peer reviewed academic papers, well accepted genetic studies, and opinions offered by the most respected scientific researchers. Indeed, rather ironically, many of my key sources derive from scientists that stand opposed to this model (being vocal supporters of the Out of Africa theories).
Well the irony doesn’t necessarily come off strong when you don’t argue in this article why the findings contradict their views, nor have the sources you provided so far actually firmly grounds your theory by placing human origin into Australasia, the two that do being an unreplicated study and a volcano incident in a vicinity with little fossil continuity with Modern humans from its early hominids.
Recent scientific studies have begun to change the landscape of paleoanthropological research. Examination of the recent conclusions associated with the analysis of Homo erectus skulls in the Georgian Republic confirms that several species of hominins in Africa are in fact nothing more than expected variance within the greater H. erectus population.[i]
Elsewhere in Southeast Asia, there is growing suspicion among scientists that Homo floresiensis evolved from a lineage of hominins that lived much earlier than the immediate ancestors of Homo sapiens.[i] Detailed analysis of Neanderthal and Denisovan ancestry convincingly places their founder populations in Southeast Asia and Australasia. There seems little about the currently accepted academic narrative that has not yet come under fire.
He in turns uses a source that supports his later claim of early humans (homo) in India by 3 million (actually 2.6 million based on the source, I believe I’m seeing a trend here), Though the claim he refers to shows continuity with ancestral populations in Africa and has hardly much to do with OOA as of current status hence why there was “no fire”.
[Update-3/18/19 The Indian study he uses, like I mentioned, supported African origins of Homo/Homan clade based on chronology at about 4.5 mya. However, it speculates on an alternative involving data used by “Red Ape” Schwartz. More on that in a future article soon.]
Fenton, furthermore, provided no evidence of his claims of Denisovan-Neanderthal origins in Australasia.
As of 2016, we have finds that place early humans in India 3 million years ago (Masol), and Homo erectus populations ranging from Indonesia to the Georgian Republic 2 million years ago (Dmanisi).[i] On the Australasian island of Guinea, we find the only signature for interbreeding between Denisovans and modern humans dating to 44,000 years ago. This interbreeding occurred long after Australia’s supposed isolation, as claimed by the consensus narrative.[i] How do entirely isolated populations interbreed with other human groups?
See here.
We computed pD(X) for a range of non-African populations and found that for mainland East Asians, western Negritos (Jehai and Onge), or western Indonesians, pD(X) is within two standard errors of zero when a standard error is computed from a block jackknife (Table 1 and Figure 1). Thus, there is no significant evidence of Denisova genetic material in these populations. However, there is strong evidence of Denisovan genetic material in Australians (1.03 ± 0.06 times the New Guinean proportion; one standard error), Fijians (0.56 ± 0.03), Nusa Tenggaras islanders of southeastern Indonesia (0.40 ± 0.03), Moluccas islanders of eastern Indonesia (0.35 ± 0.04), Polynesians (0.020 ± 0.04), Philippine Mamanwa, who are classified as a “Negrito” group (0.49 ± 0.05), and Philippine Manobo (0.13 ± 0.03) (Table 1 and Figure 1). The New Guineans and Australians are estimated to have indistinguishable proportions of Denisovan ancestry (within the statistical error), suggesting Denisova gene flow into the common ancestors of Australians and New Guineans prior to their entry into Sahul (Pleistocene New Guinea and Australia), that is, at least 44,000 years ago.24,25 These results are consistent with the Common Origin model of present-day New Guineans and Australians.26,27 We further confirmed the consistency of the Common Origin model with our data by testing for a correlation in the allele frequency difference of two populations used as outgroups (Yoruba and Han) and the two tested populations (New Guinean and Australian).The f4 statistic that measures their correlation is only |Z| = 0.8 standard errors from zero, as expected if New Guineans and Australians descend from a common ancestral population after they split from East Asians, without any evidence of a closer relationship of one group or the other to East Asians. Two alternative histories, in which either New Guineans or Australians have a common origin with East Asians, are inconsistent with the data (both |Z| > 52).
Here we analyze genome-wide single nucleotide polymorphism data from 2,493 individuals from 221 worldwide populations, and show that there is a widespread signal of a very low level of Denisovan ancestry across Eastern Eurasian and Native American (EE/NA) populations. We also verify a higher level of Denisovan ancestry in Oceania than that in EE/NA; the Denisovan ancestry in Oceania is correlated with the amount of New Guinea ancestry, but not the amount of Australian ancestry, indicating that recent gene flow from New Guinea likely accounts for signals of Denisovan ancestry across Oceania. However, Denisovan ancestry in EE/NA populations is equally correlated with their New Guinea or their Australian ancestry, suggesting a common source for the Denisovan ancestry in EE/NA and Oceanian populations. Our results suggest that Denisovan ancestry in EE/NA is derived either from common ancestry with, or gene flow from, the common ancestor of New Guineans and Australians, indicating a more complex history involving East Eurasians and Oceanians than previously suspected.
We are finding anomalies in all areas of evolutionary studies, whether we look at the mitochondrial and Y-chromosonal data, the datings associated with human archaeological sites, or analysis of hominin morphology. Rather than continuing with the attempt to fit square pegs into a round hole, it is time to face the fact that holes are round and that our story of human origins has been significantly wrong.
Well, studies such as the ones above have reworked hypotheses on migrations theories, the paper you cite on Denisovan admixture being among the many smaller scale migration already being debated and shifting as my second link mentions. So while rethinking ideas in light of evidence is a good thing, there should be clear limits on what to discredit.
Overall I wish I could like the idea as a competing idea to OOA, but this if this paper is to serve any impression of the book, using various studies on hominids and human genetic at different scales showing no clear pattern center towards South East Asia in both Archaeology AND genetics but with just enthusiasm of creating a new idea and to fill holes, then I’m disappointed.
With that said, if anyone with better knowledge and citations from the book (Fenton mentions research from close colleagues of his) then I may be more inclined to accept new finds if they are in favor of shifting human origins from Africa to Australasia.
Origins and the Relationship between West Africans and Hunter-Gatherer Populations
by Phil78 1802 words
(1/22/20 Edit: Khoi-san populations are found to diverge around 200k in light of the Ballito results and their own in context of the modern Khoi-San.)
Many casual members of HBD may not be completely aware of the population history West Africans and hunter-gathers like Pygmies beyond, say, the Bantu Migration.
Those who frequent articles by population genetics bloggers such as Dienekes or Razib Khan ought to be aware of how, in the sense of Macro races, the two clusters are distinct despite their relatively close association in a human cladistic sense to the confusion of others.
Fortunately enough, two recent finds in both genes and fossils this year not only paint the history of these two groups but also humanity as a whole, with the evolutionary timeline of Sapiens being pushed back to 300k, possibly further according to Chris Springer.
Hublin–one of the study’s coauthors–notes that between 330,000 and 300,000 years ago, the Sahara was green and animals could range freely across it.
While the Moroccan fossils do look like modern H sapiens, they also still look a lot like pre-sapiens, and the matter is still up for debate. Paleoanthropologist Chris Stringer suggests that we should consider all of our ancestors after the Neanderthals split off to be Homo sapiens, which would make our species 500,000 years old. Others would undoubtedly prefer to use a more recent date, arguing that the physical and cultural differences between 500,000 year old humans and today’s people are too large to consider them one species.
(The morphological characteristics of these hominids will come into play latter.)
Taking in this information in, we now ought to have a better context to place the divergence of HG populations and the rest of mankind (including West Africans) being more than 260,000 years ago.
[Edit– Razib has recently posted a short piece recalling expert criticism on the reported date, suggesting that it is an overestimate. While quite possible, as he compares it to claims of a 25k split between European and NE asians and no neanderthal admixture in Europeans. With that said, he has also alludes to a similar suggestion on African lineages that I’ve outlined here. If this is the case, then why do they range so close to Modern West Africans? The reason, for the most part, being that this finding technically refers to it’s ancient primary cluster and not it’s modern composition as a whole.]

So in terms of proportions, 30% of the composition of West African people contain the human ancestors of the Ballito Boy, a specimen believed in turn to represent the ancestors of modern Khoisan people without the genetic admixture of either Bantu or East African Pastoralists. (Which this study finds to range from 9% to 22% in all modern Khoisan Groups).
[*Edit- When I say HG’s people association with West Africans, I’m referring to the relative position the two populations have compared the actual East African cluster exemplified the most by Nilotic people, not “Horners”. I realized this confusion when I look at genetic distance test and found Bushmen populations ranking closest to Ethiopians, this is probably just a result of their admixture with Ethiopians as later studies \accounted for the confound and gave more accurate results, West African’s closest cluster being both Nilotics and Ethiopians with Pygmies and San clustering closer than before, though Mbuti are rather intermediate with San than sharing a branch.
This seems to dampen earlier but plausible ideas suggestion of highland Ethiopians having a San-like African profile explain their affinity to each other, but this helps illustrate the nature of the cline in affinity of Native African clusters as Razib covered later that year both between each other and relative to non African populations. Here, we see that the San have closer affinities to West Africans than to Nilotics, though the pygmies groups having an odd relationship. Not only are Biaka people closer to West Africans than Mbuti are, but in general are closer to West Africans than to Mbuti. This is likely connected to these findings.
The findings also illustrate that oddly, next to my knowledge at least, how though the San and Mbuti share similarly deep splits from non-africans, both of their smallest distances are with the Biaka than with each other despite the Biaka being closest to West Africans who are as distant as the Mbuti are to the San. Clearly imagining pygmies as merely as a cline between San and Bantus doesn’t work without considering a either considering them their own cluster altogether or to isolation. I’m considering the former idea for the most part.
Mainly because Mbuti are the smallest Pygmies, with height in that region being correlated with Pygmy ancestry versus Bantu, and Biaka pygmies have been shown to be only 18.5% to 30% “pygmy”, if assuming Mbutis are pure and Bantus are the outside group. Though the latter point explains the overall association they have with West Africans, there is still the remote position of the Mbuti. According to Cavalli Sforza, the San and Bushmen don’t necessarily share a particularly close relationship but both their lifestyles and apparent divergence from Bantus makes the idea rather convincing.
Based on the new study, which is though scant on including pygmies, comparing Mbuti dates to San shows similar dates to what was estimated at the high range of the previous 90k-195k split, if not a little higher. This is also consistent with the pygmies (in pure form) being intermediate between West African ancestors and San in the 1994 study and the new date for the Khoi-san. Their more or less genetic isolation may’ve played a role as well in their similar position with other African due to limited geneflow compared to the Khoisan and Biaka being connected through the Bantu Expansion, undermining the affinity Khoisan and Mbuti have through common ancestry. Basically similar to the relationship of Sardinians and mainland Italians which reflects a similar distance relationship with. ]
Now, the first thought crime most are pondering at this point is whether or not the Khoisan are fully human in the context of genetics and recent anthropology? John Hawks already discussed the position of the ancient moroccans in our evolutionary tree and expresses the authors’ comments on how, despite their archaic features restrain them from being clearly modern, they and similar finds play the role as the founding lineage to contribute to modern Sapiens.
In Hublin and colleagues’ “pan-African” hypothesis, every African fossil that had parted ways with Neanderthals is part of a single lineage, a stem population for modern humans. They connect the evolution of these early H. sapiens people to a new form of technology, the Middle Stone Age, which was found in various regions of Africa by 300,000 years ago.
So how many other archaic groups were in Africa? Under the Hublin model, there may have been none. Every fossil sharing some modern human traits may have a place within the “pan-African” evolutionary pattern. These were not river channels flowing into the desert, every channel was part of the mainstream.
But there may be a problem. Geneticists think there were others.
To which he alludes to Iwo Eleru findings, found to be closest to Early AMH (120k levant)
Now, as for cranial representatives that the Ballito Boy likely is associated with, there has been indeed quite a few earlier skulls fitting the profile that were classed separate of more archaic types of similar geography like Florisbad, and thus would be classed away from the Moroccans as well.
An example being this rather interesting analysis of the Border Cave skull (which I believe is 50k, at a site which bushman-like tools dated at 46k).
When all (six rather than just three) discriminants are
considered, Border Cave in fact lies closest to the Hottentot
centroid and is contained within the .05 limits of this distribution.
The fossil also approaches the Venda and Bushman male
centroids but falls beyond the .05 limits of these groups. This
is new information, not principally because of the Hottentot
identification, which is dubious, but because Border Cave is
shown emphatically to be well within the range of modern
African variation for the measurements used. The cranium is
heavily constructed, but it is hardly archaic in the fashion of
Florisbad or Broken Hill.

border cave front view- yooniqimages.com

border cave skull lateral view- yooniqimages.com

Hottentot (Khoi pastorlist) skull, Lateral and Front, (for comparison)
And here’s the best primary reference of a “bushman skull” I could find to display it’s similarities and differences with more admixed Pastoralists. One listed trait that’s notable is the less prominent occipital protrusion of the Bushman skull despite being measured as more dolichocephalic, probably due to a narrower relative breadth but that cannot be seen here.

However the only one I know of that is linked with Khoisan with modern research , is the similar Fish Hoek specimen.

Humanitec-Anatomy of an intellectual triad

Primitive Man of the Peninsula. Cape Times (South Africa), October 26, 1927

One Hundred Skulls: OEC and Exploring Human Origins
In comparison to Jebel Irhoud 1

Zetaboards (Anthroscape), unknown source

front and lateral view Jebel Irhoud- yooniqimages.com
And Florisbad

Ira Block Photography

And comments from the study mentioned, which links Fish Hoek with modern Khoisan, comparing morphological differences among Stone age African Skulls, Bushman, Pygmies, and Bantu Farmers.
To summarize, therefore, the Pleistocene skulls from across Africa tend to be broad,long, with a broad face and broad, short orbits.By contrast, the skulls of the Khoisan (“Bushman”) population are relatively short,low, broad, narrow, with a comparatively intermediate nose.Pygmies are characterized by great variability, but they usually have small-sizedround skulls, and a balanced face. Their degree of dispersion, however, contradicts the findings of other studies, which have detected a strong homogeneity among Pygmy populations, even if these support the hypothesis that the typical features of these populations, including their short stature, took place after their geographical separation through convergent evolution. As is suggested by other more recent studies (Ramírez Rossi y Sardi, 2010; Anagnostou, 2010; Vigilant, 1989).The Bantu-speaking populations are mostly at the center of the graph, which rep-resents a common morphological tendency, but with a strong variability, whether they come from Southern, Eastern or Central Africa. This supports the idea of a common, more recent ancestor than that for the Pygmy and Khoisan groups, as well as a similar way of life founded on cattle breeding and farming, independent of their surrounding environment.The Late Peopling of Africa According to Craniometric Data. A Comparison of Genetic and Linguistic Models
For context, the specimen in the sample that exemplifies the traits associated with the Pleistocene group the most would be the Herto Skull, which is comparatively closer to modern humans than the Jebel Irhoud findings.

160,000-year-old skulls fill crucial gap in evolution- Telegraph
So despite their divergence being closer to the age of more archaic specimens, why do their likely less admixed ancestors and modern populations contrast clearly in phenotypical traits? This would, by my amateur speculation, leave two options. Either gracilization took place in convergence with other populations or a more plausible route that the archaeological finds don’t precisely place the specimen’s actually divergence, thus the more archaic forms likely have older splits than what their fossilized age suggest and the clear traits of “Modern human” phenotype possibly being older as well in that respect.
The West’s Sperm Decline: Is It True?
2200 words
Another day, another slew of articles full of fear mongering. This one is on sperm decline in the West. Is it true? I have recently covered on this blog that as of July 17th, 2017, the testosterone range for men decreased (more on that when I get access to the paper). I have also covered the obesity epidemic a bit, and that also factors in to lowered testosterone and, of course, low spermatoza count. Due to these environmental factors, we can logically deduce that sperm counts have fallen as well. However, as I will cover, it may not be so cut and dry due to analyzing numerous studies with different counting methodologies among numerous other confounds that will be addressed below. First I will cover the physiology of sperm production and what may cause decreases in production. Next, I will cover the new study that is being passed around. Finally, I will talk about why you should worry about this.
Physiology of sperm production
The accumulation of testosterone by ABP leads to the onset and rising rate of sperm production. So if testosterone production ceases or decreases, then subsequent decreases in sperm count and spermatogenesis should follow. If this change is drastic, infertility will soon follow. The process of sperm production is called spermatogenesis. It occurs in the seminiforous tubules and involves three main events: 1) remodeling relatively large germ cells into smaller mobile cells with flagella, 2) reducing the chromosome number by half, and 3) shuffling the genes so that each chromosome in the sperm carries novel gene combinations that differ from the parents. This is what ensures that a child will differ from their parents but still, at the same time, will be similar to them. The process by which this occurs is called meiosis, in which four daughter cells split which subsequently differentiate sperm (Saladin, 2010: 1063).
After the conclusion of meiosis I, each chromosome is still double stranded, except each daughter cell only has 23 chromosomes becoming a haploid while at the end of meiosis II, there are four haploid cells with 23 single-stranded chromosomes. Fertilization then combined the 23 chromosomes from the father and mother, which “reestablishes the diploid number of 46 chromosomes in the zygote“(Saladin, 2010: 1063-1064).
Spermatogonia divide by mitosis and then enlarge to become primary spermatocyte. The cell is then protected from the immune system since it is going to become genetically different from the rest of the cells in the body. Since the cells are guarded from the body’s immune system, the main spermatocyte undergoes meiosis I, giving rise to equal size haploid and genetically unique secondary spermatocytes. Then, each secondary spermatocyte undergoes meiosis II dividing into two spermatids with a total of four spermatogoniom. Lastly, the spermatozoa undergo no further division but undergoes spermiogenesis in which it differentiates into a single spermatozoon (Saladin, 2010: 1065-1066). Young men produce about 300,000 sperm per minute, about 400 million per day.
Sperm decrease?
The new study was published on July 25, 2017, in the journal Human Reproduction Update titled Temporal trends in sperm count: a systematic review and meta-regression analysis. Levine et al (2017) used 185 studies (n=42,935) and showed a sperm count (SC) decline of .75 percent per year, coming out to a 28.5 percent decrease between 1975 and 2011. Similar declines were seen in total sperm count (TSC) while 156 estimates of serum volume showed little change.
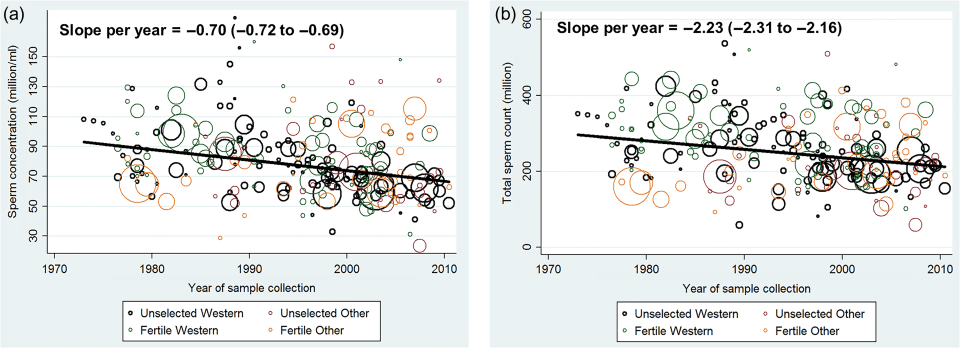
Figure 2a shows the mean sperm concentration between the years 1973 and 2011. Figure 2b shows the mean total sperm count between those same years.
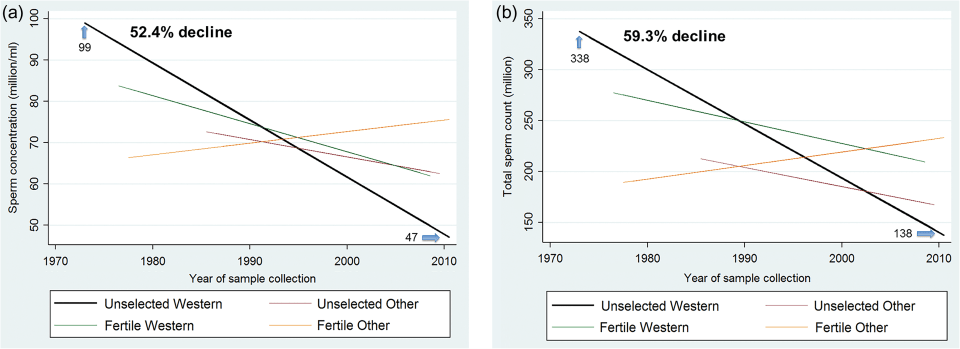
Figure 3a shows sperm concentration for the West (North America, Australia, Europe and New Zealand) vs Other (South America, Asia, and Africa), adjusted for potential confounders such as BMI, smoking etc. Figure 3b shows total sperm count by fertility and the West and Other. You can see that Fertile Other had a sharp increase, but the increase may be due to limited statistical power and a lack of studies of unselected men from those countries before 1985. There is a sharp increase for Other, however and so the data does not support as sharp of a decline as observed in Western countries.
If this is true, why is this happening? Factors that decrease spermatogenesis include (but are not limited to): obesity, smoking, exposure to traffic exhaust fumes, and combustion products. Though there is no data (except animal models) that lend credence to the idea that pesticides, food additives, etc decrease spermatogenesis (Sharpe, 2010). Other factors are known to cause lower SC which includes maternal smoking, alcohol, stress, endocrine disruptors, persistent and nonpersistent chemicals, and, perhaps most importantly today, the use of mobile phones and the wireless Internet (Virtanen, Jorgansen, and Toparri, 2017). Radiation exposure due to constant mobile phone use may cause DNA fragmentation and decreased sperm mobility (Gorpinchenko et al, 2014). Clearly, most of this decrease can largely be ameliorated. Exercise, eating right, and not smoking seem to be the most immediate changes that can and will contribute to an increase in SC in Western men. This will also increase testosterone levels. The cause is largely immobility due to the comfortable lifestyles that we in the West have. So by becoming more active and putting down smartphones, we can then begin to reverse this downward trend.
Saladin (2010: 1067) also states that pollution has deleterious effects on reproduction—and by proxy, sperm production. He states that the evidence is mounting that we are showing declining fertility due to “anatomical abnormalities” in water, meat, vegetables, breast milk and the uterus. He brings up that sperm production decreased in 15,000 men in 1990, decreasing from 113 million/ml in 1940 to 66 million/ml in 1990. Sperm production decreased more, he says, since “the average volume of semen per ejaculate has dropped 19% over this period” (Saladin, 2010: 1067).
Saladin (2010: 1067) further writes:
The pollutants implicated in this trend include a wide array of common herbicides, inseciticides, industrial chemicals, and breakdown products of materials ranging from plastics to dishwashing detergents. Some authorities think these chemicals act by mimicking estrogens by blocking the action of testosterone by binding to its receptors. Other scientists, however, question the data and feel the issue may be overstated. While the debate continues, the U.S. Environmental Protection Agency is screening thousands of industrial chemicals for endocrine effects.
Is it really true?
As seen above, the EPA is investigating whether thousands of industrial chemicals of effects on our endocrine system. If this is true, it occurs due to the binding of these chemicals to androgen receptors, blocking the production of testosterone and thusly sperm production. However, some commentators have contested the results of studies that purport to show a decrease in SC in men over the decades.
Sherins and Delbes are critical of such studies. They rightly state that most of these studies have numerous confounds such as:
1) lack of standardized counting measures, 2) bias introduced by using different counting methodologies, 3) inadequate within-individual semen sampling in the analysis, 4) failure to account for variable abstinence intervals and ejaculatory frequency, 5) failure to assess total sperm output rather than concentration, 6) failure to assess semen parameteres other than the number of sperm, 7) failure to account for age of subject, 8) subject selection bias among comparitive studies, 9) inappropriate statistical analysis, 10) ignoring major geographic differences in sperm counts, and 11) the causal equating of male ferility with sperm count per se.
Levine et al (2017) write:
We controlled for a pre-determined set of potential confounders: fertility group, geographic group, age, abstinence time, whether semen collection and counting methods were reported, number of samples per man and indicators for exclusion criteria (Supplementary Table S1).
So they covered points 1, 2, 4, 5, 6, 7, 8, 9, and 10. This study is very robust. Levine et al (2017) replicate numerous other studies showing that sperm count has decreased in Western men (Centola et al, 2015; Senputa et al, 2017; Virtanen, Jorgensen, and Toparri, 2017). Men Southern Spain show normal levels (Fernandez et al, 2010), while Southern Spanish University students showed a decrease (Mendiola et al, 2013). The same SC decrease has been noted in Brazil in the last ten years (Borges Jr. et al, 2015).
However, te Velde and Bonde (2013) in their paper Misconceptions about falling sperm counts and fertility in Europe contest the results of studies that argue that SC has decreased within the last 50 years stating that, for instance in Denmark, the median values remained between 40-45 million sperm per ml in the 15 years analyzed. They also state that declining birth rates can be explained by cultural and social factors, such as contraception, the female emancipation, and the second demographic transition. Clearly, ferility rates are correlated with the human development index (HDI) meaning that more developed countries have a lower birth rate in comparison to less developed countries. I believe that part of the reason why we in the West have lower birth rates is because there are too many things to for us to do to occupy our time, time that could be used to have children, like going to school to pursue Masters degrees and PhDs, to just wanting more ‘me time’.
Te Velde and Bonde (2013) conclude:
‘Whether the sperm concentration and human fecundity have declined during the past 50 years is a question we will probably never be able to answer’. This statement by Olsen and Rachootin in 200348 still holds for sperm concentration despite the report in 1992. In the meantime, we know that the results of oft-repeated studies from Copenhagen and Malmö do not indicate any notable change in sperm count during the last 10–15 years. Moreover, none of the available evidence points to a decline in couple fecundity during the last 30–40 years, including Denmark.28 Moreover, birth rates and TFRs instead of declining are on the increase in many EU countries, including the spectacular rise in Denmark.34
Echoing the same sentiments, Cocuzza and Esteves (2014) conclude “that there is no enough evidence to confirm a worldwide decline in sperm counts or other semen parameters. Also, there is no scientific truth of a causative role for endocrine disruptors in the temporal decline of sperm production as observed in some studies. We conjecture that a definite conclusion would only be achieved if good quality collaborative long-term research was carried out, including aspects such as semen quality, reproductive hormones, and xenobiotics, as well as a strict definition of fecundity.” Merzenich, Zeeb, and Blettner (2010) also caution that “The observed time trend in semen quality might be an artefact, since the methodological differences between studies might be time dependent as well. Intensive research will be necessary in both clinical and epidemiological domains. More studies are needed with strict methodological standards that investigate semen quality obtained from large samples of healthy men representative for the normal male population.”
Clearly, this debate is long and ongoing, and I doubt that even Levine et al (2017) will be good enough for some researchers.
Conclusion
There are various papers for and against a decrease in sperm production in the West, just like with testosterone. However, there are ways we can deduce that SC has fallen in the West, since we have definitive data that testosterone levels have decreased. This, then, would lead to a decrease in sperm production and then fecundity and number of children conceived by couples. Of course, sociocultural factors are involved, as well as immediate environmental ones that are immediately changeable. Even if there is no scientific consensus on industrial chemicals and effects on the endocrine system, you should stay away from those too. One major reason for the decrease in sperm production—if the decrease is true—is increased mobile phone usage. Mobile phone usage has increased and so this would lower SC over time.
Whether or not the decrease in SC is true or not, every man should take steps to lead a healthier lifestyle without their cell phone. Because if this decrease is true (and Other doesn’t show a decrease as well) then it would be due to the effects of our First World societies, which would mean that we need to change how we live our lives to get back on the right track. Clearly, we must change our diets and our lifestyles. I’ve written numerous articles about how testosterone is strongly mediated by the environment, and that testosterone production in men has decreased since Western men have been, in a way, feminized and not been as dominant. This can and does decrease testosterone production which would, in turn, decrease sperm production and decrease fertility rates.
Nevertheless, taking steps to leading a healthier lifestyle will ameliorate a ton of the problems that we have in the West, which are mainly due to low birth rates, and by ameliorating these problems, the quality of life will the increase in the West. I am skeptical of the decrease due to what was brought up above, but nevertheless I assume that it is true and I hope my readers do too—if only to get some fire under you to lead a healthier lifestyle if you do not do so already as to prevent these problems before they occur and lead to serious deleterious health consequences.
(I am undecided leaning towards yes. There are too many behaviors linked to lower SC which Western men partake in. There are numerous confounds which may have not been controlled for, however knowing the main reasons why men have lower sperm count and the increased prevalence in these behaviors, we can logically deduce that sperm count has fallen too. Look to the testosterone decrease, that causes both low sperm count and lower fertility.)
Your brain on poverty.
By Afrosapiens, 1163 words.
Poverty has long been associated with educational under-achievement and various behavioral issues. Although the underlying causes of these differences have been at the center of a nature vs.. Nurture debate for decades, it’s only recently that insights from neuroscience have allowed better understanding of how poverty affects the brain. Observations from MRI scans show slower brain growth in children growing up in low SES households (poor and near-poor) which results in reduced volume and grey matter thickness in the frontal and parietal cortices as well as lower amygdala and hippocampus size. All those affected brain areas are crucial to learning and social functioning as they govern cognitive and executive functions such as language, working and long-term memory, attention, impulse control, emotional management and information processing.
Although research using animal experiments indicate that the relationship between poverty and altered brain development is causal, it is yet not clear which aspect of poverty impacts which function the most. The most cited factors are stress, trauma, low stimulation, poor child-parent relationship, poor nutrition and poor health. Although it is also possible that genetics play a role in individual susceptibility to these factors, the idea that genetic background cause people to be poor in the first place and then have their brains damaged by environmental factors is not supported by science and belongs to pseudo-Darwinian creationism, especially since such deficits appear to be reversible to a substantial degree due to brain plasticity.
Various interventions to improve or prevent decrease in cognitive and executive function have shown good and lasting results in reducing behavioral issues and increasing school performance and job market participation. Interventions can take various forms, first of all, since poverty is lack of financial resources, income supports to families with children are an obvious means of limiting children’s exposure to poverty-related adversity. Although this is absolute common sense, conservative ideologues have managed to convince a large part of the public that pro-poor policies would in fact be harmful to the needy whereas pro-rich ones would mysteriously benefit them.
Besides redistribution, executive function coaching in the form of computer or non-computer games, aerobic exercise and sports, music, martial arts and mindfulness practices as well as improvements in school curricula and teaching methods have been shown to improve social and educational outcomes. One last type of intervention that yielded good results is nurse home visits to low-income mothers of young children which had the effect of improving developmental outcomes of children by teaching mothers parenting skills and healthy practices.
These interventions aren’t to be confused with efforts at increasing IQ that caused little improvement beyond temporarily increasing IQ scores, which has no relevance in terms of life outcomes. IQ can probably benefit from increased language skills and executive function but it doesn’t seem to be the target of remedial intervention on those underlying abilities of which IQ test performance would only be a byproduct.
Now you might wonder how big a problem child poverty and its neurological consequences are in contemporary societies. Although the most extreme and widespread child poverty is seen in developing countries, industrialized countries like the USA, Israel, Turkey, Chile and Spain have rates of prevalence above 20%, whereas countries in Western Europe tend to maintain rates around or below 10%.
While informative, reported child poverty rates only include those who live below an arbitrarily defined poverty threshold in a given year, but the effects on poverty likely affect those living only slightly above poverty line and do not meet their developmental needs and those who have experienced poverty in the past but were living above the threshold when the figures were reported.
Within the United States, significant differences in the prevalence and the nature of child poverty exist between ethnic groups with 34% of Native Americans, 13% of Asians/Pacific Islanders, 36% of African-Americans, 31% of Hispanics and 12% of European Americans living under poverty line in 2015.
Comparing African-Americans and European Americans, the nature of poverty differed markedly with 77% of African Americans experiencing poverty at least once in their childhood and 37% living in poverty for more than 9 years.In comparison, only 30% of European American children experienced poverty while growing up, including 5% for more than 9 years. 40% of black children and 8% of white children were poor at birth. Among those born poor, 60% of African Americans and 25% of European Americans were still poor at age 17, among those not born in poverty, 20% of black children and 5% of whites were poor at age 17.
With the effects of poverty worse felt at a younger age and during long periods of time, such interracial differences in prevalence and persistence of child poverty are one plausible large contributor to the observed gaps in educational and behavioral outcomes between the two groups.
Read more:
- Association of Child Poverty, Brain Development, and Academic Achievement
- The Effects of Poverty on Childhood Brain Development: The Mediating Effect of
- Caregiving and Stressful Life Events
- Family Poverty Affects the Rate of Human Infant Brain GrowthThe impact of poverty on the development of brain networks
- Effects of childhood poverty and chronic stress on emotion regulatory brain function in adulthood
- Poverty’s Most Insidious Damage: The Developing Brain
- Socioeconomic status and the brain: mechanistic insights from human and animal research
- Childhood Poverty, Chronic Stress, Self-Regulation, and Coping
- Socioeconomic status and structural brain developmentChildhood Poverty: Specific
- Associations with Neurocognitive Development
- POVERTY, PRIVILEGE, AND BRAIN DEVELOPMENT: EMPIRICAL FINDINGS AND ETHICAL IMPLICATIONS
- Neural correlates of socioeconomic status in the developing human brain
- Poverty, cultural disadvantage and brain development: a study of pre-school children in Mexico.
- Rethinking the Brain: New Insights into Early Development.Malnutrition, poverty and intellectual development
- State of the Art Review: Poverty and the Developing Brain
- Poverty Impedes Cognitive Function
- Brain Drain: A Child’s Brain on Poverty
- Poverty, Stress, and Brain Development: New Directions for Prevention and Intervention
- Effects of Socioeconomic Status on Brain Development, and How Cognitive Neuroscience May Contribute to Levelling the Playing Field
- Family income, parental education and brain structure in children and adolescents
- Neglected infections of poverty in the United States and their effects on the brain
- Brain on stress: How the social environment gets under the skin
- How Poverty Affects the Brain: An unprecedented study in Bangladesh could reveal how malnutrition, poor sanitation and other challenges make their mark on child development
- Interventions shown to aid executive function development in children 4 to 12 years old.
- Short-Term Music Training Enhances Verbal Intelligence and Executive Function
- The development of inhibitory control in preschool children: Effects of “executive skills” training
- Relating Effortful Control, Executive Function, and False Belief Understanding to Emerging Math and Literacy Ability in Kindergarten
- Competitive Versus Cooperative Exergame Play for African American Adolescents’ Executive Function Skills: Short-Term Effects in a Long-Term Training Intervention
- Training and transfer effects of executive functions in preschool children
- Effects of physical activity on children’s executive function: Contributions of experimental research on aerobic exercise
- Reflection training improves executive function in preschool-age children: Behavioral and neural effects
- Hot and Cool Executive Function in Childhood and Adolescence: Development and Plasticity
- Childhood Poverty Persistence: Facts and Consequences
- Child poverty OECD
Evolution and IQ Linkfest V
1850 words
Nutrition science isn’t broken, it’s just extremely hard (Of course nutrition science is hard, each individual body is unique in its own right; one body may not have a certain organ, while another may have a higher base blood pressure. Indeed, to make nutrition science respectable, the ideological spin needs to be taken out of it (like with everything in our lives). The same holds for the human sciences, and any other scientific field. Follow the data, draw conclusions based on said data and don’t twist and turn data to make it say what you want to say.)
Rethinking Mammalian Brain Evolution (Terrence Deacon has argued a lot over the years that brain size is the last refuge of progress in evolution. Indeed the overall size of our brains have increased over the years. But all the brain size fetishists do is proclaim ‘look at how big the brain has gotten!’ all the while they ignore the fact that the brains grow as bodies do. There is no ‘progress’ in mammalian brain evolution nor brain evolution as a whole.)
Fallacies of Progression in Theories of Brain Size Evolution (A paper full of fallacies in theories of brain size evolution. From the Bigger-is-smarter Fallacy, to the Numerology Fallacy, Deacon goes through a large list of fallacious reasoning in regards to the supposed brain size increase over time. Numerology fallacies are apparent correlations that turn out to be artifacts of numerical oversimplification. Numerology fallacies in science, like their mystical counterparts, are likely to be committed when meaning is ascribed to some statistic merely by virtue of its numeric similarity to some other statistic, without supportive evidence from the empirical system that is being described (Deacon, 1991b: 201). Most people just see a correlation and attempt to ascribe meaning to it and then fall down the rabbit hole of crappy theories all because of a correlate. Well…correlates don’t mean anything unless causation is show. Sure there is a relationship, but if you champion correlations all day every day and not discover causes, then you’d just end up being a psychologist. Brain size evolution is the last refuge for progressionists. Apparently, only looking at the size of the brain is enough to deduce that ‘progress’ has occurred. That will be covered at length in the future.)
Confusing size-correlated differences with phylogenetic “progression” in brain evolution (So-called brain size progress vanishes when effects of brain size and functional specialization are taken into account. That’s the final nail in the coffin for so-called progressive brain evolution. It’s funny how people still push this today when papers were written 30 years ago rebutting the same notion… I get it. Looking at the average size of brains, it did increase. But that’s not taking allometry into account and when allometry and functional specialization is taken into account, the relationship all but disappears. What’s funny is that this is literally a rebuttal to PumpkinPerson’s article ‘Marching up the evolutionary tree‘ which I rebutted here: Marching Up the ‘Evolutionary Tree’? Progressionists grasp on to whatever they can to attempt to ‘show’ that evolution is synonymous with ‘progress’, when natural selection is literally local change, and that’s what brain size evolution is; local change!)
Brain development, gender and IQ in children A volumetric imaging study (This one is sure to send brain size fetishists into a fervor. There seems to be a plateau and then, perhaps, a sharp decrease in the largest brains. This goes against the ‘bigger-is-better’ notion of some brain size fetishists. So it seems that after IQ 120, there is a sharp decrease in brain size… If IQ is meaningful for brain size, why is this so? Even then, larger brains have more myelinated axons and larger neurons connecting them, so larger brain size would not be expected to increase cognitive competence more than modestly. Fact of the matter is, brain size increased for expertise capacity, not IQ (Skoyles, 1999). This study lends credence to the fact that ‘bigger is not always better’. This is yet more ammo against the brain size fetishists clamoring that bigger brains actually mean something for having modern-day levels of intelligence.)
Evolution of the human brain: when bigger is better (Hofman argues that the theoretical maximum size capacity of the human brain is 3500 cc. That’s 3 times the size of our brains now! He states that after this enormous size, that cognitive power would begin to decrease. At a brain size of about 3500 cm3, corresponding to a brain volume two to three times that of modern man, the brain seems to reach its maximum processing capacity. The larger the brain grows beyond this critical size, the less efficient it will become, thus limiting any improvement in cognitive power. I don’t think it is physically possible for our brains to become that large. Imagine how large women’s hips would need to be to birth that monstrous head. Imagine how our bipedality and running would be affected. It’s a fun thought experiment, but it’s not realistic.)
Evolution evolves: physiology returns to centre stage (Evolution evolves. Once it was discovered that physiological systems can and do respond to the environment and make changes to the system, physiology was thrust back into the evolutionary spot light. Noble et al state that the Neo-Darwinian Modern Synthesis needs either extension or replacement (I argue replacement, will do so in a future article) since the gene is not the ‘star of the show’ so to speak. This also largely rebuts Dawkins and his Selfish Gene theory. That, too, will also be covered in the future.)
Physiology is rocking the foundations of evolutionary biology (And rightfully so. The gene-centered view (Dawkins’ view) is archaic and we need to move on from it. Selfish genes have no place in physiology. The selfish gene theory, anyway, is just a metaphor, a metaphor that has seeped into our popular culture and has permeated our lives. Physiology is rocking the foundations of evolutionary biology because genes are passive and do not do anything unless guided by the intelligent physiologic system that interacts with its environment and is homeodynamic in nature. This is a new and unique way of understanding the evolution of systems and organisms as a whole. The fact of the matter is, the organism is, again, front-and-center while the gene is relegated to where it belongs.)
Neo-Darwinism, the Modern Synthesis and selfish genes: are they of use in physiology? (No they are both obsolete in regards to physiology. Physiologist Denis Noble dissects Dawkins’ selfish gene theory through a physiologists point of view. He states that genes don’t do anything until directed by intelligent systems. DNA sequences only make sense in the context of the particular organism. Noble disagrees with Dawkins’ has contended that genes are ‘passengers’, while Denis Noble instead states that genes are ‘prisoners’ in our bodies (what Dawkins terms ‘vehicles’). Neo-Darwinists relegate the role of the organism as an ‘indispensable vehicle’. This is not true. I know that Dawkins and Gould had long back-and-forths on gene- and species-selection. However, it seems that Gould was in the right. Modern-day evolutionary physiology is proving the theory of Punctuated Equilibria correct. Noble concludes with this paragraph: “It is therefore time to move on and remove the conceptual barriers to integrating modern physiological science with evolutionary and developmental theory. The integrative approach can achieve this since it avoids the simplistic fallacies of the gene-centred differential approach and it is essentially what successful systems physiology has employed for many years.” The gene-centered view of evolution needs to go.)
Form and function remixed: Developmental physiology in the evolution of vertebrate body plans (heritable morphologic change can occur without a change in genes since physiology responds to what occurs in the environment. This is huge! The fact that there can be no change in gene frequency BUT heritable morphologic change occurs in species shows that intelligent physiology can take cues from the environment and direct development that way. This, too, lends credence to Eldredge and Gould’s Punctuated Equilbria theory. Species change DUE TO the environmental change which is DRIVEN by intelligent physiology, which is made up of smaller, intelligent cells. This stuff on intelligent physiology and evolutionary physiology is really blowing my mind the further I fall down this rabbit hole.)
As some of my readers may have noticed, I have changed a ton of my views in the past year. All of my view changes will be covered in a future article.
One of my problems with a lot of theories floating around is the concept of ‘reductionism’. There is a huge problem with reducing and dividing larger complex systems into smaller ‘more manageable’ parts.
Reductionism—in regards to the large complex physiologic and anatomic systems that make up the human body—is the theory that to understand human body (i.e. physiologic system), you must first understand its simplest, smallest parts. Of course, reductionism isn’t the only way to understand how complex physiologic systems work and interact with each other and the environment. Imagine looking at a bunch of car parts strewn across the floor. Looking at the simple parts of the car, you won’t be able to ascertain the inner workings of automobile transmission, the same can be said for the the human personality; you can never deduce how one’s personality would be with complete knowledge of the circuitry of the brain, nor the genetic sequence of DNA.
Holism is a complimentary theory that states that the whole system—and not the sum of its parts—should be looked at, to treat disease for instance.
So we must look at the whole of the system and not reduce things into a sum of smaller parts. Aristotle was hugely important to our understanding of the human body, but in regards to physiology and anatomy, holism makes more sense. I’m not informed on holism in regards to psychology, however. Here is a good article.
Reductionism and Holism in Psychology
I contend that physiologic systems are too complex to be reduced to a sum of smaller parts, and the whole physiologic system and organism must be studied to understand Y.
So why, for instance, does the human brain and body get ‘reduced’ to ‘simple parts’ when, to understand the nature of the whole system, the parts MUST be looked at working in unison with eachother? Imagine seeing a spleen on the floor. Sure, you may be able to guess at its use and function, but without actually seeing what it does in the body and how it interacts with other organs you’ll think something pretty underwhelming.
Reductionism has lead the way for holism—which is the study of the whole system and not the sum of its simpler parts. Studying whole organisms/systems and not their smaller, ‘simpler’ parts (genes) will lead to a better understanding of evolution as a whole and will prevent us from continuing to use metaphors such as the selfish gene. It now makes no sense to me to reduce the complex human physiological system—and the brain—into smaller parts to see how it works. The whole organism must be studied.
Sex and IQ
By Scott Jameson
800 words
Long and short of this issue is that something has to explain why most of the really, really smart people are men. There are two hypotheses: men have a higher mean, and men have a higher standard deviation. They don’t really have to compete, and so some people believe that both are true. Some believe neither, of course.
Let’s start with three facts:
- Women tend to get slammed by men on Raven’s Progressive Matrices; the second graph in the post linked above details this. It’s a difference of 5 IQ points on average, quite a bit, certainly more than on other IQ tests.
- Women tend to lose even harder in visuospatial measures. John Loehlin pointed out in The Handbook of Intelligence that the gap here was a whopping 13.5 points.
- Raven’s is so g loaded because your score is primarily driven by spatial and verbal-analytic abilities.
The biggest subtest difference is spatial, and I think that likely explains the abnormally large differences in Raven’s scores. Other IQ tests, like the SAT, hardly use visual abilities. Women do about as well as men on the SAT. I’ve also seen the White-Asian gap smaller on the SAT than in other IQ tests, and that gap is also driven in large part by spatial scores. Conversely you might expect the SAT to go better for a hypothetical demographic that scores well in math and verbal abilities, but not especially well in spatial. By hypothetically I mean that these people make up like a fifth of the kids at the Ivy Leagues, even more than you’d expect from an average IQ of, I don’t know, 111ish.
Off topic: these differences are probably going to be slighter still now that they’re fastidiously removing every useful element of the test in an effort to make it less “biased” by race. I wonder if colleges will just throw up their shoulders and start looking for kids who do well on the ACT. Moving on.
There are other sex differences in subtest scores. Pulling from Loehlin again: “females tend to have an advantage on verbal tests involving the fluent production of words belonging to a category, such as synonyms.” Women are known to do better on verbal than on math.
Loehlin also points out that girls do better at math in early childhood, but that boys outstrip them by the time it, uh, matters, when they take standardized tests in adolescence.
I have a wild hypothesis that men and women respectively being more oriented towards mathematical and verbal thought corresponds to observed differences in interests. Women are known to read more often than men on average, whereas male dominated activities like sports and video games often have a distinctly mathematical bent. My spurious hypothesis is that doing these different things differentially develops their abilities, constituting an example of crystallized intelligence rather than fluid intelligence; alternatively, they were differentially selected for ability to perform well on tasks that their respective sex does more of, in which case the abilities are innate.
Even if they aren’t innate, it’d be an instance of secondary heritability because evidence tends to show male-female personality differences as innate; in this scenario they are innately prone to practicing different abilities to different extents.
Loehlin points to Hedges and Nowell’s 1995 meta-analysis, showing a higher male variation in IQ and elucidating a few more small subtest differences. I’ve lifted a meaty bit here:
On average, females exhibited a slight tendency to perform better on tests of reading comprehension, perceptual speed, and associative memory, and males exhibited a
slight tendency to perform better on tests of mathematics and social studies. All of the effect sizes were relatively small except for those associated with vocational aptitude scales (mechanical reasoning, electronics information, and auto and shop information) in which average males performed much better than average females. The effect sizes for science were slightly to moderately positive, and those for perceptual speed were slightly to moderately negative. Thus, with respect to the effect size convention, these data suggest that average sex differences are generally rather small.
In summary:
- There are sex differences in scores of various IQ subtests, including but not limited to female orientation towards verbal and male orientation towards mathematical ability.
- The largest of these differences is a substantial male advantage in spatial ability.
- On any IQ test that doesn’t weight subtests such that men and women perform equally by default, men tend to score a hair better.
- Men also have a higher standard deviation in IQ.
There are more male geniuses, particularly with respect to mathematical genius. There are also more mentally retarded males. I just explained why men tend to populate CERN, NASA, Silicon Valley, and lists of who’s died in the Running of the Bulls.
Preliminary Thoughts on ‘Male-to-Female’ Transgenders in Sports
1500 words
(See my article on transvestic disorder and gender dysphoria for an intro on my view of transgenderism.)
I have been researching male-to-female (MtF) transgenders (TGs) in sports for the past few months. I, like we all do, have my own biases with what should be done with this problem (not letting them compete with women), however jumping to my initial bias there would not be fair so I’ve undertaken the task of reading as many journal articles on the matter as I possibly can. From my research on the matter, there is no direct consensus in the literature that I could come across. In this article, I will show some of the research I’ve found and how it is inconclusive (as well as interject my own thoughts on the matter, mainly speaking about bone density, somatype, and testosterone). (I will cover female-to-male (FtM) transgenders in a future article.)
One recent article making its way around the news is of a MtF who won a weightlifting competition. He (I will be referring to the people I reference by their biological sex) had a total of 590 pounds, besting the second place winner by 42 pounds. Hubbard (the weightlifter who ‘transitioned’) is 39 and has been ‘transitioning’ since his mid-30s. He has also had previous experience competing. The IOC (International Olympic Committee) has no guidelines that a TG athlete must undergo ‘sex-reassignment surgery’, however, they must be on hormone replacement therapy (HRT) for at least 12 months and demonstrate that they have testosterone levels ‘within acceptable limits’. Well, what are ‘acceptable limits’?
The IOC has a short paper on this matter, writing:
The athlete must demonstrate that her total testosterone level in serum has been below 10 nmol/L for at least 12 months prior to her first competition (with the requirement for any longer period to be based on a confidential case-by-case evaluation, considering whether or not 12 months is a sufficient length of time to minimize any advantage in women’s competition).
The athlete’s total testosterone level in serum must remain below 10 nmol/L throughout the period of desired eligibility to compete in the female category.
Compliance with these conditions may be monitored by testing. In the event of non-compliance, the athlete’s eligibility for female competition will be suspended for 12 months.
So the MtF athlete must have a testosterone level of less than 10 nanomoles and declare that they are ‘female’ for at least four years. The IOC states that the individual must be taking HRT for a year or two—whenever they are able to show that their testosterone levels are below that 10 nanomolar mark, they are then allowed to compete. However, other members of the IOC have stated that 10 nanomoles is too high (which is the lower end for males) while arguing that it should be reduced to 3 nanomoles per liter of blood (3 nanomoles is the upper-end for women).
10 nanomoles per liter of blood converts to about 288 ng/dl (nanograms per deciliter). Going with the lower end suggested by other members of the IOC, 3 nanomoles per deciliter of blood converts to 87 ng/dl. The range for women is 15 to 70 ng/dl. Now, the 10 nmol/l is, as you can see, way too high. However, 10 nmol/l converts to slightly higher than the lower end of the new testosterone guidelines for the average male in America and Europe (which I covered yesterday, the new levels being 264-916 ng/dl). As we can see, even 10 nmol/l is way too high and, in my opinion, will give an unfair advantage to these athletes (I know that there is no consensus on whether or not testosterone does give an inherent advantage to MtFs of to hyperandrogenic women; I provide evidence for that below).
In regards to women and hypoandrogenism, Stanton and Wood (2011) state that “excess production of endogenous testosterone due to inborn disorders of sexual development (DSD) may convey a competitive advantage.” The fact of the matter is, endogenous and exogenous testosterone does convey an advantage. So if having higher levels of testosterone conveys a physical advantage in said sport, then 10 nmol/l is way too high. Therefore, the only way (in the eyes of the IOC, not in my opinion) for MtFs to compete with women is to get ‘sex-reassignment surgery’, as the gonads will be removed and testosterone levels will plummet. But how by how much?
In a new review of the literature, Jones et al (2017) state that “there is no direct or consistent research suggesting transgender female individuals (or male individuals) have an athletic advantage at any stage of their transition (e.g. cross-sex hormones, gender-confirming surgery) and, therefore, competitive sport policies that place restrictions on transgender people need to be considered and potentially revised.” They further state that, in most instances, testosterone levels in MtFs “[tended] to be lower than average compared with cisgender women.” So they conclude that there is no evidence that MtFs have no inherent advantage since 1) most of them have lower levels of testosterone than ‘cis-gendered women’, and 2) that there is ‘no evidence’ of testosterone conferring an advantage in athletes (I beg to differ there). The review by Jones et al is a great starting point, however, I disagree with them on numerous things (which I will cover in greater depth in an upcoming, exhaustive research article).
Mueller et al (2011) studied a sample of 84 MtFs who were treated with 10 mg of oestradiol every ten days. They were “treated with subcutaneous injections of 3.8 mg goserelin acetate every 4 weeks to suppress endogenous sex hormone secretion completely.” Follow-ups then commenced at 12 and 24 months. It was found that their BMI, fat mass, and lumbar bone mineral density (BMD) had increased. Conversely, they had a significant decrease in lean mass with a concurrent increase in BMI, which would lead to strength decreases and increased range of motion (ROM), and there was no effect on femoral bone density. This is a larger study than most, most studies having ns of ~20, so the results are robust for this research.
Even if MtFs have a decrease in lean mass and gain in fat mass, they still have inherent biological advantages over women. Testosterone, of course, is not the only reason why men are superior to women in most sports (contrary to the literature). Muscle fiber distribution, cross-sectional area, leverages, etc all play a part in why men are better at sports than women (this is covered at length in Man the Athlete). To the best of my knowledge, cross-sectional area, muscle fiber distribution and leverages don’t change. This is another physical advantage that MtFs would have over ‘cis-gendered women’.
Hyperandrogenic women have also been the center of a lot of controversy (if you follow the Olympics, you may have heard about it occurring during the last Games). Hyperandrogenism affects 5-10 percent of women that are of reproductive age. Signs of hyperandrogenism include hirsutism (hairiness in women), androgenic alopecia (Price, 2003), acne, and virilization (the development of male body hair, bulk, and a deep voice, male-typical characteristics) (Yildiz, 2006). After Caster Semenaya’s dominating win in the middle distance run during last year’s Olympics, the IOC revised their regulations on hyperandrogenic women.
However, Karkazis et al (2016) argued against the IOC and IAAF (International Association of Athletics Federation) stating that “The current scientific evidence, however, does not support the notion that endogenous testosterone levels confer athletic advantage in any straightforward or predictable way.” I strongly disagree with the contention, which I will cover at length in the future. (See Cardinale and Stone, 2006; Wood and Stanton, 2012; Vanny and Moon, 2015.) Of course testosterone is not the only biological factor that confers an advantage, but the difference between hyperandrogenic women and normal women is large (hyperandrogenic women have three times the testosterone compared to normal women, so between 45 to 210 ng/dl). So should they be allowed to compete with women with average levels of testosterone?
Men are built differently than women. Even with HRT, MtFs people would still have an advantage over women. The differences are biological, physiological and anatomic in nature and surgery nor HRT will affect certain factors that would confer an advantage due to the sex the person was born as. That part, in my opinion, is the key factor at play. The difference between MtFs and women do not go away due to surgery and HRT (though some do), so since MtFs have certain biological, anatomical and physiological differences, they should not be allowed to compete with women. That is the one main factor in this debate that is being overlooked. And due to these inherent advantages, they should be barred from competing with women.
This then brings up some interesting implications. Should we segregate competitions by race since the races have strengths and weaknesses due to biology and anatomy, such as somatype? It’s an interesting question to consider, but I think we can all agree on one thing: Women should compete with women, and men should compete with men. Thus, transgenders should compete with transgenders. Even the IOC’s regulations are too high, and in my opinion (contra the literature), testosterone does confer an advantage to those who have it in higher levels (i.e. MtFs). Even then, disregarding testosterone, there are a slew of reasons as to why MtFs should not compete with women which will be covered more in the future.
Getting Omega 3s in the public diet
by Scott Jameson
An earlier post established that Omega 3 fatty acids are an important nutrient of which hardly anybody is getting enough, and that this deficiency is making us Westerners a bit dumber and a bit crazier on the whole. Description sometimes obligates prescription, so this post is where I spitball about possible solutions, and welcome you to join me in the comments.
I’m reminded of the gubbermint mandating the lacing of our salt with sorely needed iodine, or the enrichment of white flour with nutrients lost in the removal of the bran and germ as well as the bleaching of the endosperm.
For yourself and your family, fish oil pills are fine- kelp oil if you’re one of those people. But we need solutions that work for nearly everybody, and the brilliance of the examples I listed above is that everybody eats that stuff (bread and salt) and now it’s laced with nutrients they’ve been needing. So we could produce N3s at low cost and legally mandate that certain foods contain them. Chia is a promising source: it’s cheap, it’s loaded with N3s, and it doesn’t taste fishy. Flax also works, but it’s loaded with phytoestrogens. Tons of seeds have those, I think Chia as well, but I’ve been told (incorrectly?) that flax is a particularly bad offender. Anyway, how do we load Chia or a similar seed into people’s diets?
Omega 3 eggs are one way to go. Chickens metabolize plant ALA (such as from chia or flax) into DHA and store both in their eggs. Just as we made use of the auroch and tarpan’s efforts to have a brain, we can hijack the chicken’s futile attempts to provide brain-material for her nonexistent offspring, using her eggs as a vehicle to get N3s into ourselves. It’s as simple as a mandate that a certain percentage of all chicken feed must be N3 rich seeds and/or insects.
Another obvious place to look is the plant oils that go into our food. Check out the table on the Wikipedia page for ALA: soybean and rapeseed oils have a pathetic showing for ALA content, and they’re put in absolutely everything. The State mandates that all gas will be a bit ethanol: why not all soybean and canola be 10, 20% Chia or some comparably high ALA crop?
It’s worth pointing out that you can genetically modify ALA rich vegetable oil to be on a quality closer to par with fish oil, having some of the ALA converted into the more useful EPA. Forget any concerns about GMOs you may have because the oils I’m talking about lacing with GMOs are already themselves GMOs.
We also must mandate that all infant formula be laced with N3s: EPA and DHA in particular, and tested for stuff like mercury if it comes from fish. You probably know at least one person who is autistic because they were bottlefed.
Comment your potential solutions below. I want to hear them. Double points for anyone playing the game on hard mode: free market solutions (libertarians) or animal-free solutions (vegans). If you try both, you’re a masochist and you need help.
