
Sex Differences in Aggressive Behavior and Testosterone
1700 words
Many long-time readers may know of the numerous tirades of been on in regards to the “testosterone causes crime and aggression” myth. It’s a fun subject to talk about because the intelligent human physiological system is an amazing system. However, people who are not privy to the literature on testosterone in regards to race, aggression, crime, sex differences etc are only aware of whatever they read in pop science articles. So since they never read the actual papers themselves, they get a clouded view of a subject.
In my last article, I wrote about how there are no “testosterone genes”. In previous articles on the hormone, I have proven that there is no causal link between testosterone and aggression. But when comparing the sexes, how do the results look? Do they look the same with men being more violent while women—who have substantially less testosterone than men—do not have any higher levels of aggression or crime? The most recent study I’m aware of is by Assari, Caldwell, and Zimmerman (2014) titled: Sex Differences in the Association Between Testosterone and Violent Behaviors.
To make a long story short, there was no relationship between testosterone and aggression in men, but a significant relationship between testosterone and aggression in women. This data comes from the Flint Adolescent Study, a longitudinal study conducted between the years of 1994 to 2012. In regards to testosterone collection, saliva was used which has a perfect correlation with circulating testosterone. The eligibility to be included in the testosterone assay was “provided consent for the procedure, not being pregnant, not having anything to eat, drinking nothing except water, and not using tobacco, 1 hour prior to collection” (Assari, Caldwell, and Zimmerman, 2014).
The adolescent who contributed saliva gave a whole slew of demographic factors including SES, demographics, psychological factors, family relations, religion, social relations, behavior, and health. They were aged 14 to 17 years of age. They collected data during face-to-face interviews,
Age and SES were used as control variables in their multivariate analysis. For violent behaviors, the authors write:
Youths were asked how often they had engaged in the following behaviors; ‘had a fight in school’, ‘taken part in a rumble where a group of your friends were against another group’, injured someone badly enough to need bandages or a doctor’, ‘hit a teacher or supervisor at work (work supervisor)’, used a knife or gun or other object (like a club) to get something romantic a person’, ‘carried a knife or razor’, or ‘carried a gun’. All items used a Likert response, ranging from 1 (0 times) to 5 (4 or more times). Responses to each item were averages to calculate the behavior during the last year. Total score was calculated as the average of all items. Higher scores indicated more violent behaviors (a = 0.79). This measure has shown high reliability and validity and it has been used previously in several published reports.
This is a great questionnaire. The only thing I can think of that’s missing is fighting/arguing with parents.
In regards to testosterone assaying, they were assayed after 11 am to “control for changes due to diurnal rhythm” (Assari, Caldwell, and Zimmerman, 2014). I’m iffy on that since testosterone levels are highest at 8 am but whatever. This analysis is robust. Saliva was not taken if the subject had smoked or ingested something other than water or if a subject was pregnant. Assays should be taken as close to 8 am, as that’s when levels are highest. However one study does argue to extend the range to 8 am to 2 pm (Crawford et al, 2015) while other studies show that this only should be the case for older males (Long, Nguyen, and Stevermer, 2015). Even then assays were done at the higher end of the range as stated by Crawford et al (2015), so differences shouldn’t be too much.
86.4 percent of the sample was black whereas 13.4 percent were white. 41.2 percent of the subjects had some college education whereas 58.2 percent of the subjects lived with a partner or relative. 21.4 percent of the subjects were unemployed.
The mean age was 20.5 for both men and women, however, which will be a surprise to some, testosterone did not predict aggressive behavior in men but did in women. Testosterone and aggressive behavior were positively correlated, whereas there was a negative correlation between education and testosterone and aggressive behavior. Though education was associated with aggressive behavior in men but not women. So sex and education was associated with aggressive behavior (the sex link being women more privy to aggressive behavior while men are more privy to aggressive behavior due to lack of education). Females who had high levels of education had lower levels of aggressive behavior. Again: testosterone wasn’t associated with violent behavior in men, but it was in women. This is a very important point to note.
This was a community sample, so, of course, there were different results when compared to a laboratory setting, which is not surprising. Laboratory settings are obviously unnatural settings whereas the environment you live in every day obviously is more realistic.
This study does contradict others, in that it shows that there is no association between testosterone and aggression in men. However, still other research shows that testosterone is not linked to aggression or impulsivity, but to sensation-seeking, sexual experience or sociality (Daitzman and Zuckerman, 1980; Zuckerman, 1984). Clearly, testosterone is a beneficial hormone and due to the low correlation of testosterone with aggression (between .08 and .14; Book, Starzyk, and Quinsey, 2001; Archer, Graham-Kevan and Davies, 2005; Book and Quinsey, 2005). This paper, yet again, buttresses my arguments in regards to testosterone and aggressive behavior.
In regards to the contrast in the literature the authors describe, they write:
One of the many factors that may explain the inconsistency in these findings is the community versus clinical setting, which has been shown to be a determinant of these associations. Literature has previously shown that many of the findings that can be found in clinical samples may not be easily replicated in a community setting (36).
This is like the (in)famous, unreplicable stereotype threat (see Stroessner and Good). It can only be replicated in a lab, not in an actual educational setting. And it also seems that this is the case for testosterone and aggressive behavior.
Just because women have lower testosterone and are less likely to engage in aggressive behavior, that doesn’t mean that a relationship does not exist between females. “It is also plausible to attribute sex differences in the above studies to differential variations in the amount of testosterone among men and women” (Assari, Caldwell, and Zimmerman, 2014). This view supports the case that testosterone is linked to aggression in females, even though their range of testosterone is significantly lower than men’s, while it may also be easier to assay women for testosterone due to less diurnal variation in comparison to men (Book, Starzyk, and Quinsey, 2001).
Assari, Caldwell, and Zimmerman, (2014) also write (which, again, buttresses my arguments):
Age may explain some of the conflicting results across the studies. A meta-analysis of community and selected samples suggested that there might be only low to modest association between testosterone and aggression, with mean weighted correlations ranging from 0.08 to 0.14, in males. Overall, these meta-analyses suggest that the testosterone-aggression association is equally strong in 12 to 21-year-olds, as it is in 22 to 35-year-olds, but that it may be less strong in age groups younger than 12, than in those who are older.
So, testosterone may be associated with aggressive behavior and violence in women but not in men. In men, the significant moderator was education. It’s interesting to note that Mazur (2016) noted that young black males with little education had higher levels of testosterone than age-matched samples of other blacks. This, along with the evidence provided here, may be a clue that if the social environment changes, then so will higher levels of testosterone (as I have argued here).
They, perhaps taking too large of a leap here, argue that “aggressive behaviors may be more social and less biologically based among men” (Assari, Caldwell, and Zimmerman, 2014). Obviously social factors are easier to change than biological ones (in theory), so, they argue, preventative measures may be easier for men than women. More studies need to be done on the complex interactions between sex, testosterone, aggression, biology and the social environment which then shapes the aggressive behaviors of those who live there.
Testosterone and aggression studies are interesting. However, you must know a good amount of the literature to be able to ascertain good studies from the bad, what researchers should and should not have controlled for, time of assay, etc because these variables (some not in the author’s hands, however) can and do lead to false readings if certain variables are not controlled for. All in all, the literature is clearly points to, though other studies contest this at times, the fact that testosterone does not cause aggressive behavior in men. The myth needs to die; the data is piling up for this point of view and those who believe that testosterone causes aggressive behavior and crime (which I have shown it does not, at least for men) will soon be left in the dust as we get a better understanding of this pivotal hormone.
(In case anyone was going to use this as evidence that black women have higher levels of testosterone than white women, don’t do it because it’s not true. You’ll only embarrass yourself like this guy did. Read the comments and see him say that you don’t need scientific measurements, you only need to ‘observe it’ and through ‘observation’ we can deduce that black women have higher levels of testosterone than white women. This is not true. Quoting Mazur, 2016:
The pattern [high testosterone] is not seen among teenage boys or among females.
…
There is no indication of inordinately high T among young black women with low education.
Whoever still pushes that myth is an idealogue; I have retracted my article ‘Black Women and Testosterone‘, but idealogues just gloss over it and read what they think will bolster their views when I have provided the evidence to the contrary. It pisses me off that people selectively read things then cite my article because they think it will confirm their pre-conceived notions. Well too bad, things don’t work like that.)
Find the Genes: Testosterone Version
1600 words
Testosterone has a similar heritability to IQ (between .4 and .6; Harris, Vernon, and Boomsma, 1998; Travison et al, 2014). To most, this would imply a significant effect of genes on the production of testosterone and therefore we should find a lot of SNPs that affect the production of testosterone. However, testosterone production is much more complicated than that. In this article, I will talk about testosterone production and discuss two studies which purport to show a few SNPs associated with testosterone. Now, this doesn’t mean that the SNPs cause high/low testosterone, just that they were associated. I will then speak briefly on the ‘IQ SNPs’ and compare it to ‘testosterone SNPs’.
Testosterone SNPs?
Complex traits are ‘controlled’ by many genes and environmental factors (Garland Jr., Zhao, and Saltzman, 2016). Testosterone is a complex trait, so along with the heritability of testosterone being .4 to .6, there must be many genes of small effect that influence testosterone, just like they supposedly do for IQ. This is obviously wrong for testosterone, which I will explain below.
Back in 2011 it was reported that genetic markers were discovered ‘for’ testosterone, estrogen, and SHGB production, while showing that genetic variants in the SHGB locus, located on the X chromosome, were associated with substantial testosterone variation and increased the risk of low testosterone (important to keep in mind) (Ohlsson et al, 2011). The study was done since low testosterone is linked to numerous maladies. Low testosterone is related to cardiovascular risk (Maggio and Basaria, 2009), insulin sensitivity (Pitteloud et al, 2005; Grossman et al, 2008), metabolic syndrome (Salam, Kshetrimayum, and Keisam, 2012; Tsuijimora et al, 2013), heart attack (Daka et al, 2015), elevated risk of dementia in older men (Carcaillon et al, 2014), muscle loss (Yuki et al, 2013), and stroke and ischemic attack (Yeap et al, 2009). So this is a very important study to understand the genetic determinants of low serum testosterone.
Ohlsson et al (2011) conducted a meta-analysis of GWASs, using a sample of 14,429 ‘Caucasian’ men. To be brief, they discovered two SNPs associated with testosterone by performing a GWAS of serum testosterone concentrations on 2 million SNPs on over 8,000 ‘Caucasians’. The strongest associated SNP discovered was rs12150660 was associated with low testosterone in this analysis, as well as in a study of Han Chinese, but it is rare along with rs5934505 being associated with an increased risk of low testosterone(Chen et al, 2016). Chen et al (2016) also caution that their results need replication (but I will show that it is meaningless due to how testosterone is produced in the body).
Ohlsson et al (2011) also found the same associations with the same two SNPs, along with rs6258 which affect how testosterone binds to SHGB. Ohlsson et al (2011) also validated their results: “To validate the independence of these two SNPs, conditional meta-analysis of the discovery cohorts including both rs12150660 and rs6258 in an additive genetic linear model adjusted for covariates was calculated.” Both SNPs were independently associated with low serum testosterone in men (less than 300ng/dl which is in the lower range of the new testosterone guidelines that just went into effect back in July). Men who had 3 or more of these SNPs were 6.5 times more likely to have lower testosterone.
Ohlsson et al (2011) conclude that they discovered genetic variants in the SHGB locus and X chromosome that significantly affect serum testosterone production in males (noting that it’s only on ‘Caucasians’ so this cannot be extrapolated to other races). It’s worth noting that, as can be seen, these SNPs are not really associated with variation in the normal range, but near the lower end of the normal range in which people would then need to seek medical help for a possible condition they may have.
In infant males, no SNPs were significantly associated with salivary testosterone levels, and the same was seen for infant females. Individual variation in salivary testosterone levels during mini-puberty (Kurtoglu and Bastug, 2014) were explained by environmental factors, not SNPs (Xia et al, 2014). They also replicated Carmaschi et al (2010) who also showed that environmental factors influence testosterone more than genetic factors in infancy. There is a direct correlation between salivary testosterone levels and free serum testosterone (Wang et al, 1981; Johnson, Joplin, and Burin, 1987), so free serum testosterone was indirectly tested.
This is interesting because, as I’ve noted here numerous times, testosterone is indirectly controlled by DNA, and it can be raised or lowered due to numerous environmental variables (Mazur and Booth, 1998; Mazur, 2016), such as marriage (Gray et al, 2002; Burnham et al, 2003; Gray, 2011; Pollet, Cobey, and van der Meij, 2013; Farrelly et al, 2015; Holmboe et al, 2017), having children (Gray et al, 2002; Gray et al, 2006; Gettler et al, 2011); to obesity (Palmer et al, 2012; Mazur et al, 2013; Fui, Dupuis, and Grossman, 2014; Jayaraman, Lent-Schochet, and Pike, 2014; Saxbe et al, 2017) smoking is not clearly related to testosterone (Zhao et al, 2016), and high-carb diets decrease testosterone (Silva, 2014). Though, most testosterone decline can be ameliorated with environmental interventions (Shi et al, 2013), it’s not a foregone conclusion that testosterone will sharply decrease around age 25-30.
Studies on ‘testosterone genes’ only show associations, not causes, genes don’t directly cause testosterone production, it is indirectly controlled by DNA, as I will explain below. These studies on the numerous environmental variables that decrease testosterone is proof enough of the huge effects of environment on testosterone production and synthesis.
How testosterone is produced in the body
There are five simple steps to testosterone production: 1) DNA codes for mRNA; 2) mRNA codes for the synthesis of an enzyme in the cytoplasm; 3) luteinizing hormone stimulates the production of another messenger in the cell when testosterone is needed; 4) this second messenger activates the enzyme; 5) the enzyme then converts cholesterol to testosterone (Leydig cells produce testosterone in the presence of luteinizing hormone) (Saladin, 2010: 137). Testosterone is a steroid and so there are no ‘genes for’ testosterone.
Cells in the testes enzymatically convert cholesterol into the steroid hormone testosterone. Quoting Saladin (2010: 137):
But to make it [testosterone], a cell of the testis takes in cholesterol and enzymatically converts it to testosterone. This can occur only if the genes for the enzymes are active. Yet a further implication of this is that genes may greatly affect such complex outcomes as behavior, since testosterone strongly influences such behaviors as aggression and sex drive. [RR: Most may know that I strongly disagree with the fact that testosterone *causes* aggression, see Archer, Graham-Kevan and Davies, 2005.] In short, DNA codes only for RNA and protein synthesis, yet it indirectly controls the synthesis of a much wider range of substances concerned with all aspects of anatomy, physiology, and behavior.
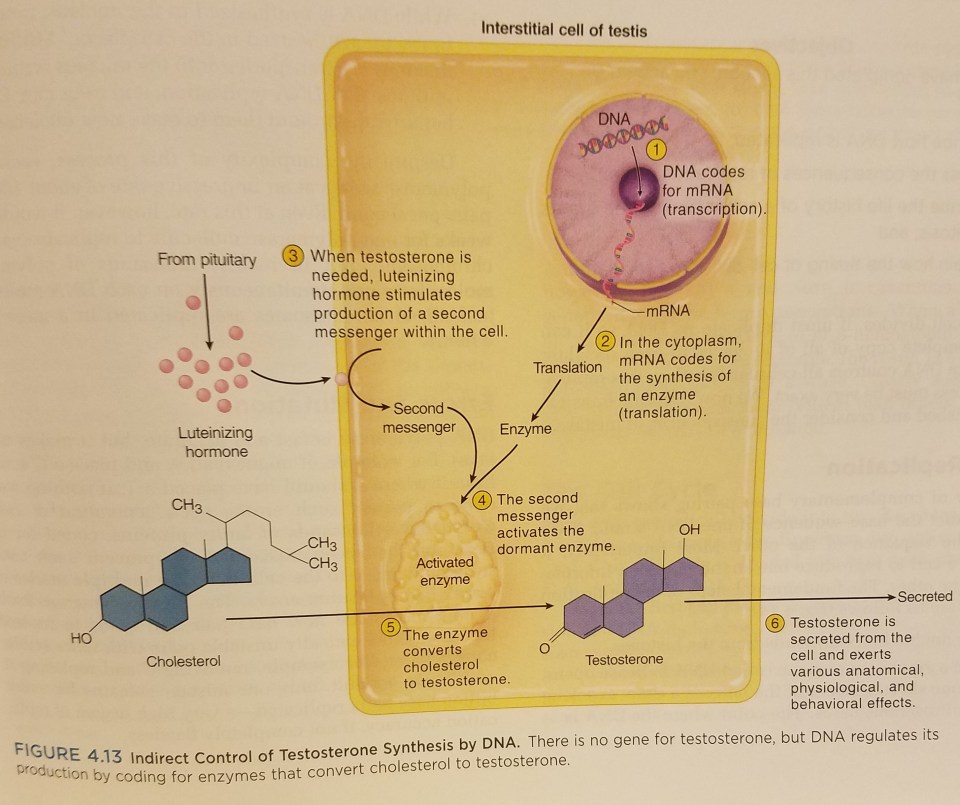
(Figure from Saladin (2010: 137; Anatomy and Physiology: The Unity of Form and Function)
Genes only code for RNA and protein synthesis, and thusly, genes do not *cause* testosterone production. This is a misconception most people have; if it’s a human trait, then it must be controlled by genes, ultimately, not proximately as can be seen, and is already known in biology. Genes, on their own, are not causes but passive templates (Noble, 2008; Noble, 2011; Krimsky, 2013; Noble, 2013; Also read Exploring Genetic Causation in Biology). This is something that people need to understand; genes on their own do nothing until they are activated by the system.
What does this have to do with ‘IQ genes’?
My logic here is very simple: 1) Testosterone has the same heritability range as IQ. 2) One would assume—like is done with IQ—that since testosterone is a complex trait that it must be controlled by ‘many genes of small effect’. 3) Therefore, since I showed that there are no ‘genes for’ testosterone and only ‘associations’ (which could most probably be mediated by environmental interventions) with low testosterone, may the same hold true for ‘IQ genes/SNPS’? These testosterone SNPs I talked about from Ohlsson et al (2011) were associated with low testosterone. These ‘IQ SNP’ studies (Davies et al, 2017; Hill et al, 2017; Savage et al, 2017) are the same—except we have an actual idea of how testosterone is produced in the body, we know that DNA is indirectly controlling its production, and, most importantly, there is/are no ‘gene[s] for’ testosterone.
Conclusion
Testosterone has the same heritability range as IQ, is a complex trait like IQ, but, unlike how IQ is purported to be, it [testosterone] is not controlled by genes; only indirectly. My reasoning for using this example is simple: something has a moderate to high heritability, and so most would assume that ‘numerous genes of small effect’ would have an influence on testosterone production. This, as I have shown, is false. It’s also important to note that Ohlsson et al (2011) showed associated SNPs in regards to low testosterone—not testosterone levels in the normal range. Of course, only when physiological values are outside of the normal range will we notice any difference between men, and only then will we find—however small—genetic differences between men with normal and low levels of testosterone (I wouldn’t be surprised if lifestyle factors explained the lower testosterone, but we’ll never know that in regards to this study).
Testosterone production is a real, measurable physiologic process, as is the hormone itself; which is not unlike the so-called physiologic process that ‘g’ is supposed to be, which does not mimic any known physiologic process in the body, which is covered with unscientific metaphors like ‘power’ and ‘energy’ and so on. This example, in my opinion, is important for this debate. Sure, Ohlsson et al (2011) found a few SNPs associated with low testosterone. That’s besides the point. They are only associated with low testosterone; they do not cause low testosterone. So, I assert, these so-called associated SNPs do not cause differences in IQ test scores; just because they’re ‘associated’ doesn’t mean they ’cause’ the differences in the trait in question. (See Noble, 2008; Noble, 2011; Krimsky, 2013; Noble, 2013.) The testosterone analogy that I made here buttresses my point due to the similarities (it is a complex trait with high heritability) with IQ.
IQ Test Construction, IQ Test Validity, and Raven’s Progressive Matrices Biases
2050 words
There are a lot of conceptual problems with IQ tests that I never see talked about. The main ones are how the tests are constructed (to fit a normal curve, no less); to the fact that there is no construct validity to the tests (IQ tests aren’t calibrated against a biological model like breathalyzers are calibrated against a model of blood in the blood stream); and how the Raven’s Progressive Matrices test is actually biased despite being touted as the most culture-free test since all you’re doing is rotating abstract symbols to see what comes next in the sequence. These three assumptions have important implications for the ‘power’ of the IQ tests, the most important being the test construction and validity.
I) IQ test construction
IQ tests are constructed with the assumption that we know what IQ tests test (we don’t) and with the prior ‘knowledge’ of who is or is not intelligent. Test constructors construct the tests to reveal presumed differences between individuals.
It is assumed that 1) IQ scores lie on a normal distribution (they don’t) and 2) few natural bio functions conform to this curve. Another problem with IQ test construction is the assumption that it increases with age and levels off after puberty. Though this, like the other things, has been built into the test by choosing items that an increasing proportion of children pass. You can, of course, reverse this effect by choosing items that older people do well on and younger people don’t.
Further, they keep 50 percent of items that children get right while keeping a smaller proportion of items that children get right, which, in effect, presupposes who is or is not intelligent.
Though, you never see those who believe that IQ is a ‘good enough’ proxy for intelligence ever being this up. Why? This is very important for the validity of these tests. Because if how the tests are constructed is wrong and test scores are not to fit a normal distribution when no normal distribution actually exists for most human mental (including IQ scores) and physiological traits, then the assumptions and conclusions drawn from them are wrong. IQ tests are constructed with the prior idea of who is or is not ‘intelligent’ and this is done by how the items are chosen—50 percent of the items that people get right are kept while the smaller proportion of items people get right or wrong are kept. This is how this so-called ‘normal curve’ appears in IQ tests and is why the book The Bell Curve has the name it has. But bell curve don’t exist for a modicum of traits including IQ!!
Simon (1997: 204) writes (emphasis mine):
There is another, and completely irrefutable, reason why the bell-shaped curve proves nothing at all in the context of H-M’s book: The makers of IQ tests consciously force the test into such a form that it produces this curve, for ease of statistical analysis. The first versions of such tests invariably produce odd-shaped distributions. The test-makers then subtract and add questions to find those that discriminate well between more-successful and less-successful test-takers. For this reason alone the bell-shaped IQ curve must be considered an artifact rather than a fact, and therefore tells us nothing about human nature or human society.
The analysis and selection of items that go on the tests are biased since there is no cognitive theory on which the analysis and selection of items are based. Carpenter, Just and Shell (1990: 408) note how John Raven, the creator of the Raven’s Progressive Matrices, even discussed this in his personal notes, writing “He used his intuition and clinical experience to rank order the difficulty of the six problem types. Many years later, normative data from Forbes (1964), shown in Figure 3, became the basis for selecting problems for retention in newer versions of the test and for arranging the problems in order of increasing difficulty, without regard to any underlying processing theory.”
II) IQ test validity
Another problem with IQ tests are its validity. People attempt to ‘prove’ its validity with correlating job performance success with IQ scores, though there are huge flaws in the studies purporting to show a .5 correlation between IQ and job performance (Richardson, 2002; Richardson and Norgate, 2015). IQ tests are not like, say, breathalyzers (which are calibrated against a model of blood alcohol) or white blood cell count (which is a proxy for disease in the body). Those two measures have a solid theoretical basis and underpinning; as blood alcohol rises, the individual had increased alcohol consumption. The same is true for white blood cell count. The same is not true for IQ tests.
One of the biggest measures used in regards to job performance and IQ testing (people attempt to use job performance to attempt to validate IQ tests) is supervisor rating. However, supervisory ratings are hugely subjective and a lot of factors that would have a supervisor be said to be a ‘good worker’ are not variables that entail just that job.
The only ‘validity’ that IQ test have is correlations with other IQ tests and tests like the SAT. This is not validity. Say the breathalyzer wasn’t calibrated against a model of blood alcohol in the body, would breathalyzers still be a valid tool to test people’s blood/alcohol level? On that same note let’s say that white blood cells wasn’t construct valid. Would we be able to reliably use white blood cell count as a valid measure for disease in the body? These very same problems plague IQ tests and people accept them as ‘proxies’ for intelligence, they test ‘enough of intelligence’ to be able to say that one is smarter than another because they scored higher in a test and therefore tap into this mystical ‘g’ that they have more of which is like a ‘power’ or ‘energy’.
These tests, therefore, are constructed with the idea of who is or is not intelligent and you can see that by looking at how the items are chosen for the test. That’s not scientific. So a true test of ‘intelligence’ may not even exist since these tests have this type of construct bias already in them.
IQ tests have no validity like breathalyzers and white blood cell count, and the so-called ‘culture-free’ IQ test Raven’s Progressive Matrices is anything but.
III) Raven’s and culture bias
I specifically asked Dr. James Thompson about Raven’s being culture-fair. I said that I recall Linda Gottfredson saying that people say that Ravens is culture-fair only because Jensen said it:
Yes, Gottfredson made that remark, and I remember her doing it at an ISIR conference.
So that’s one thing about Ravens that crumbles. A quote from Ken Richardson’s book Genes, Brains, and Human Potential: The Science and Ideology of Intelligence:
It is well known that families and subcultures vary in their exposure to, and usage of, the tools of literacy, numeracy, and associated ways of thinking. Children will vary in these because of accidents of background. …that background experience with specific cultural tools like literacy and numeracy is reflected in changes in brain networks. This explains the importance of social class context to cognitive demands, but is says nothing about individual potential.
(This argument on social class is much more complex than ‘poor people are genetically predisposed to be dumb and poor’.
Consider a recent GCTA study by Plomin et al., who reported a SNP-based heritability estimate of 35% for “general cognitive ability” among UK 12 year olds (as compared to a twin heritability estimate of 46%) [8]. According to the Wellcome Trust “genetic map of Britain,” striking patterns of genetic clustering (i.e. population stratification) exist within different geographic regions of the UK, including distinct genetic clusterings comprised of the residents of the South, South-East and Midlands of England; Cumbria, Northumberland and the Scottish borders; Lancashire and Yorkshire; Cornwall; Devon; South Wales; the Welsh borders; Anglesey in North Wales; Scotland and Ireland; and the Orkney Islands [8]. Now consider the title of a study from the University and College Union: “Location, Location, Location – the widening education gap in Britain and how where you live determines your chances” [9]. This state of affairs (not at all unique to the UK), combined with widespread geographic population stratification, is fertile ground for spurious heritability estimates.
Still Chasing Ghosts: A New Genetic Methodology Will Not Find the “Missing Heritability”
I think this argument is interesting, and it throws a wrench into a lot of things, but more on that another day.)
Richardson continues:
In other words, items like those in the Raven contain hidden structure which makes them more, not less, culturally steeped than any other kind of intelligence testing items, like the Raven, as somehow not knowledge-based, when all are clearly learning dependent. Ironically, such cultural-dependency testing is sometimes tacitly admitted by test users. For example, when testing children in Kuwait on the Raven in 2006, Ahmed Abdel-Khalek and John Raven transposed the items “to read from left to right following the custom of Arabic writings.” (Richardson, 2017: 99)
Finally, we have this dissertation which shows that urban peoples score better than hunter-gatherers (relevant to this present article):
Reading was the greatest predictor of performance Raven’s, despite controlling for age and sex. Attendance was also strongly correlated with Raven’s performance. These findings suggest that reading, or pattern recognition, could be fundamentally affecting the way an individual problem solves or learns to learn, and is somehow tapping into ‘g’. Presumably the only way to learn to read is through schooling. It is, therefore, essential that children are exposed to formal education, have the motivation to go/stay in school, and are exposed to consistent, quality training in order to develop the skills associated with improved performance. (pg. 83)
This is telling: This means that there is no such thing as a ‘culture-free’ IQ test and there will always be something involved that makes it culture un-fair.
People may say ‘It’s only rotating pictures and shapes to get the final answer, how much schooling could you need??’, well as seen above with the Tsimane, schooling is very important to IQ tests since they test learned skills. I’ve seen some people claim that IQ tests don’t test learned ability and that it’s all native, unlearned ability. That’s a very incorrect statement.
So although the symbols in a test like the RPM are experience-free, the rules governing their changes across the matrix are certainly not, and they are more likely to be already represented in the minds of children from middle-class homes, less so in others. Performance on the Raven’s test, in other words, is a question not of inducing ‘rules’ from meaningless symbols, in a totally abstract fashion, but of recruiting ones that are already rooted in the activites of some cultures rather than others. Like so many problems in life, including fields as diverse as chess, science and mathematics (e.g. Chi & Glaser, 1985), each item on the Raven’s test is a recognition problem (matching the covariation structure in a stimulus array to ones in background knowledge) before it is a reasoning problem. The latter is rendered easy when the former has been achieved. Similar arguments can be made about other so-called ‘culture-free’ items like analogies and classifications (Richardson & Webster, 1996). (Richardson, 2002: pg 292-292)
Everyday life is also more complex than the hardest items on Raven’s Matrices, while the test is not complex in its demands compared to tasks undertaken in everyday life (Carpenter, Just, and Shell, 1990). They conclude that the cause is differences in working memory, but that is an ill-defined concept in psychology. They do say, though, that “The processes that distinguish among individuals are primarily the ability to induce abstract relations and the ability to dynamically manage a large set of problem-solving goals in working memory.” So item complexity doesn’t make Raven’s items more difficult for others, since everyday life is more complex.
I’ll end with a bit of physiology. What physiological process is does IQ mimic in the body? If it is a physiological process, surely you’re aware that physiological processes *are not* static. IQ is said to be stable at adulthood, what a strange physiological process. Let’s say for arguments’ sake that IQ really does test some intrinsic, biological process. Does it seem weird to you that a supposed real, stable, biological, bodily function of an individual would be different at different times?
Conclusion
There are a lot of assumptions about IQ tests that are never talked about. The most important being how the tests are constructed to fit a normal curve when most traits important for survival aren’t normally distributed. IQ tests are constructed with the assumption of who is or isn’t intelligent just on the knowledge of how the items are prepared for the test. When you look at how the tests are constructed you can see how they are constructed to fit the normal curve because most of their assumptions and conclusions rest on the reality of the normal curve. There is no construct validity to IQ tests, they’re not like breathalyzers for instance which are calibrated against a model of blood alcohol or white blood cell count as a proxy for disease in the body. Raven’s—despite what is commonly stated about the test—is not unbiased, it perhaps is the most biased IQ test of them all. This highlights the problems with IQ tests that are rarely ever spoken about, and should have you call into question the ‘power’ of the IQ test which assumes who is or isn’t intelligent ahead of time.
My Response to (Ir)RationalWiki
1100 words
I was alerted to an article on the website (Ir)”RationalWiki” which in their own words “critique[s] and challenge[s] pseudoscience and the anti-science movement, explore[s] authoritarianism and fundamentalism, and analyze[s] how these subjects are handled in the media.” Unfortunately, it seems like the one who wrote this article (and is still adding to it) just selectively read certain articles and quote mined them.
The article on this website about me is an unfair mischaracterization of my views. Quotes will follow from the article with my comments.
In the opening paragraph they write:
NotPoliticallyCorrect is an Alt-right blog that promotes racialist pseudoscience and white nationalism; the owner posts as RaceRealist using the euphemism “racial realist” coined by the white supremacist J. P. Rushton who is extensively quoted on the blog.
- I’m not alt-right nor am I a white nationalist.
- I don’t promote ‘racialist pseudoscience’ nor do I promote ‘white nationalism’.
- Correct, Rushton did coin the term ‘race realist’, but he was not a ‘white supremacist’.
They continue, quoting an article of mine that I wrote almost two years ago titled Non-Western People are Abnormal to Our Society. I still stand by everything that I wrote in that article.
They continue:
A racist crank obsessed with controversial topics such as race and IQ and eugenics, RaceRealist argues in a 2016 blog essay “Non-Western People are Abnormal to Our [Western] Societies”[1] and its comments[2] that “MENA” and “SSA’s” (i.e. people from the Middle-East, North Africa and Sub-Saharan Africa) as well as other non-Westerners are somehow abnormal to the US and Europe:
They then quote me:
MENA and SSA people are abnormal to Western societies. It’s clear that, on average, full-on acclimation is not possible.
One only needs to look at what is occurring in Western European countries to see that, on average, this is true.
They continue:
In the same essay, RaceRealist goes on to post crude racism, such as “Negros” are biologically inferior:
Quoting me writing:
The same can be said for Negros[sic] in America as well. They are deviant, dysfunctional, they cause distress in our country and finally, they pose a danger to us, our families and societies as a whole. Just like those immigrants we have come into our countries who cannot assimilate because it’s not in their biology.
Except everything I wrote here was logically sound (last sentence notwithstanding). Look at the 4 d’s of abnormal psychology (which is the next quote they provide):
The “4 d’s of abnormality” and how they relate to our culture and the current culture/biology of those non-Western immigrants coming into our country is extremely telling. It’s clear that those people cannot assimilate into our societies because of differing biology and differing locations in which they evolved in. We chose our environments based on our biology. Environment increasingly depends on their genes, rather than being the cause of their exogenous behavior.
The 4 d’s of abnormality are deviance, dysfunction, distress and danger. Everything I wrote and then provided examples for in regards to the 4 d’s of abnormality are sound.
You can read my article Diversity in the Social Context for more evidence for this argument.
They then quote my article The Evolution of Jewish Nepotism writing:
RaceRealist is an anti-Semite who dislikes Ashkenazi Jews, accusing them of “derogating other ethnicities”; when discussing Ashkenazi Jews, he bizarrely maintains their higher average IQ is partly a product of “breeding with beautiful Roman women a few thousand years ago”,[3] for which there exists no evidence.
I admit it is conjecture. Evidence exists for Jewish men migrating to Rome to mate with Roman women (Atzmon et al, 2010). I never stated that I ‘dislike Ashkenazi Jews’. In regards to the derogation, it’s true. Close-knit ethnic groups derogate the out-group (Sampasivam et al, 2016). Further, oxytocin promotes human ethnocentrism, which caused in-group favoritism and out-group derogation (Drew et al, 2010). In-groups derogate out-groups. Read the literature.
And the final thing the page shows is my tweet saying that “I finally made it on (Ir)”RationalWiki””:
to which they wrote:
Twitter contributor Race Realist Eighty frickin’ Eight wishes to make it absolutely clear to everyone that he does not in fact consider himself “altright” and certainly not a “white nationalist”.[4]
Just because I have the numbers “88” in my handle doesn’t make me “alt-right” nor does it make me a “white nationalist.” I thought about changing it, then I realized that it’s good to weed out the people who aren’t serious about discussion and just look for things to discredit people that are meaningless to the conversation at hand. It tells you a lot about someone when they bring up irrelevant things. I’m not a white nationalist, nor am I an alt-righter. Just because I write about politics rarely and use them as an example (like in my article The Rise of Ethnocentrism and the Alt-Right: The Rebirth of Selfish Genes which I also disavow now that I realize that ‘selfish genes’ are a metaphor; Noble, 2011; Noble, 2013; Noble et al, 2014).
Take a look at the tags it tagged the article with: “Alt-righters, Pseudoscience, Racists, Internet kooks, Psuedoscience promoters, Alt-right, Internet Hate Sites.” Not an alrighter, I don’t push psuedoscience, I’m not a ‘racist’ (whatever that means). If you don’t like what I write, respond to any article you disagree with and explain why with logical, rational arguments. This piece is garbage and mischaracterizes my views using selective quotations (which, even then, failed to prove their point. No, numbers after a username are not evidence).
All in all, this article is garbage. It says that Rushton is ‘extensively quoted’, which is true for what I wrote in the beginning of this blog’s history, but not so for the past, say, 18 months. Rushton has been the target of my attacks on penis size, testosterone, and my personal favorite, r/K selection theory. But sure, go and dig in the archives for old articles to quote mine. This article written about me is dumb, doesn’t characterize my views correctly (calls me a ‘white nationalist’ and ‘alt-righter’). Selectively quote certain articles, assert that Rushton is ‘extensively quoted’ when I hardly discuss him anymore and when I do it’s about testosterone/to rebut him. (Ir)RationalWiki should think about reading a bit of my blog before characterizing me as something I’m not.
For the record, I don’t care about politics. I am not alt-right. I am not a white nationalist. I’m not an anti-semite. This will be updated to cover whatever else they decide to write about me. Hopefully it’s at least a bit closer to reality next time, because this article sucks.
Black-White Differences in Physiology
2050 words
Black-white differences in physiology can tell a lot about how the two groups have evolved over time. On traits like resting metabolic rate (RMR), basal metabolic rate (BMR), adiposity, heart rate, Vo2 max, etc. These differences in physiological variables between groups, then, explain part of the reason why there are different outcomes in terms of life quality/mortality between the two groups.
Right away, by looking at the average black and average white, you can see that there are differences in somatype. So if there are differences in somatype, then there must be differences in physiological variables, and so, this may be a part of the cause of, say, differing obesity rates between black and white women (Albu et al, 1997) and even PCOS (Wang and Alvero, 2013).
Resting metabolic rate
Resting metabolic rate is your body’s metabolism at rest, and is the largest component of the daily energy budget in modern human societies (Speakman and Selman, 2003). So if two groups, on average, differ in RMR, then one with the lower RMR may have a higher risk of obesity than the group with the higher RMR. And this is what we see.
Black women do, without a shadow of a doubt, have a lower BMR, lower PAEE (physical activity energy expenditure) and TDEE (total daily expenditure) (Gannon, DiPietro, and Poehlman, 2000). Knowing this, then it is not surprising to learn that black women are also the most obese demographic in the United States. This could partly explain why black women have such a hard time losing weight. Metabolic differences between ethnic groups in America—despite living in similar environments—show that a genetic component is responsible for this.
There are even predictors of obesity in post-menopausal black and white women (Nicklas et al, 1999). They controlled for age, body weight and body composition (variables that would influence the results—no one tell me that “They shouldn’t have controlled for those because it’s a racial confound!”) and found that despite having a similar waist-to-hip ratio (WHR) and subcutaneous fat area, black women had lower visceral fat than white women, while fasting glucose, insulin levels, and resting blood pressure did not differ between the groups. White women also had a higher Vo2 max, which remained when lean mass was controlled for. White women could also oxidize fat at a higher rate than black women (15.4 g/day, which is 17% higher than black women). When this is expressed as percent of total kcal burned in a resting state, white women burned more fat than black women (50% vs 43%). I will cover the cause for this later in the article (one physiologic variable is a large cause of these differences).
We even see this in black American men with more African ancestry—they’re less likely to be obese (Klimentidis et al 2016). This, too, goes back to metabolic rate. Black American men have lower levels of body fat than white men (Vickery et al, 1988; Wagner and Heyward, 2000). All in all, there are specific genetic variants and physiologic effects, which cause West African men to have lower central (abdominal) adiposity than European men and black women who live in the same environment as black men—implying that genetic and physiologic differences between the sexes are the cause for this disparity. Whatever the case may be, it’s interesting and more studies need to be taken out so we can see how whatever gene variants are *identified* as protecting against central adiposity work in concert with the system to produce the protective effect. Black American men have lower body fat, therefore they would have, in theory, a higher metabolic rate and be less likely to be obese—while black women have the reverse compared to white women—a lower metabolic rate.
Skeletal muscle fiber
Skeletal muscle fibers are the how and why of black domination in explosive sports. This is something I’ve covered in depth. Type II fibers contract faster than type I. This has important implications for certain diseases that black men are more susceptible to. Though the continuous contraction of the fibers during physical activity leads to a higher disease susceptibility in black men—but not white men (Tanner et al, 2001). If you’re aware of fiber type differences between the races (Ama et al, 1986; Entine, 2000; Caeser and Henry, 2015); though see Kerr (2010’s) article The Myth of Racial Superiority in Sports for another view. That will be covered here in the future.
Nevertheless, fiber typing explains racial differences in sports, with somatype being another important variable in explaining racial disparities in sports. Two main variables that work in concert are the somatype (pretty much body measurements, length) and the fiber type. This explains why blacks dominate baseball and football; this explains why ‘white men can’t jump and black men can’t swim’. Physiological variables—not only ‘motivation’ or whatever else people who deny these innate differences say—largely explain why there are huge disparities in these sports. Physiology is important to our understanding of how and why certain groups dominate certain sports.
This is further compounded by differing African ethnies excelling in different running sports depending on where their ancestors evolved. Kenyans have an abundance of type I fibers whereas West Africans have an abundance of type II fibers. (Genetically speaking, ‘Jamaicans’ don’t exist; genetic testing shows them to come from a few different West African countries.) Lower body symmetry—knees and ankles—show that they’re more symmetrical than age-matched controls (Trivers et al, 2014). This also goes to show that you can’t teach speed (Lombardo and Deander, 2014). Though, of course, training and the will to want to do your best matter as well—you just cannot excel in these competitions without first and foremost having the right physiologic and genetic make-up.
Further, although it’s only one gene variant, ACTN3 and ACE explain a substantial percentage of sprint time variance, which could be the difference between breaking a world record and making a final (Papadimitriou et al, 2016). So, clearly, certain genetic variants matter more than others—and the two best studied are ACTN3 and ACE. Some authors, though, may deny the contribution of ACTN3 to elite athletic performance—like one researcher who has written numerous papers on ACTN3, Daniel MacArthur. However, elite sprinters are more likely to carry the RR ACTN3 genotype compared to the XX ACTN3 genotype, and the RR ACTN3 genotype—when combined with type II fibers and morphology—lead to increased athletic performance (Broos et al, 2016). It’s also worth noting that 2 percent of Jamaicans carry the XX ACTN3 genotype (Scott et al, 2010), so this is another well-studied variable that lends to superior running performance in Jamaicans.
In regards to Kenyans, of course when you are talking about genetic reasons for performance, some people don’t like it. Some may say that certain countries dominate in X, and that for instance, North Africa is starting to churn out elite athletes, should we begin looking for genetic advantages that they possess (Hamilton, 2000)? Though people like Hamilton are a minority view in this field, I have read a few papers that there is no evidence that Kenyans possess a pulmonary system that infers a physiologic advantage over whites (Larsen and Sheel, 2015).
People like these three authors, however, are in the minority here and there is a robust amount of research that attests to East African running dominance being genetic/physiologic in nature—though you can’t discredit SES and other motivating variables (Tucker, Onywera, and Santos-Concejero, 2015). Of course, a complex interaction between SES, genes, and environment are the cause of the success of the Kalenjin people of Kenya, because they live and train in such high altitudes (Larsen, 2003), though the venerable Bengt Saltin states that the higher Vo2 max in Kenyan boys is due to higher physical activity during childhood (Saltin et al, 1995).
Blood pressure
The last variable I will focus on (I will cover more in the future) is blood pressure. It’s well known that blacks have higher blood pressure than whites—with black women having a higher BP than all groups—which then leads to other health implications. Some reasons for the cause are high sodium intake in blacks (Jones and Hall, 2006); salt (Lackland, 2014; blacks had a similar sensitivity than whites, but had a higher blood pressure increase); while race and ethnicity was a single independent predictor of hypertension (Holmes et al, 2013). Put simply, when it comes to BP, ethnicity matters (Lane and Lip, 2001).
While genetic factors are important in showing how and why certain ethnies have higher BP than others, social factors are arguably more important (Williams, 1992). He cites stress, socioecologic stress, social support, coping patterns, health behavior, sodium, calcium, and potassium consumption, alcohol consumption, and obesity. SES factors, of course, lead to higher rates of obesity (Sobal and Stunkard, 1989; Franklin et al, 2015). So, of course, environmental/social factors have an effect on BP—no matter if the discrimination or whatnot is imagined by the one who is supposedly discriminated against, this still causes physiologic changes in the body which then lead to higher rates of BP in certain populations.
Poverty does affect a whole slew of variables, but what I’m worried about here is its effect on blood pressure. People who are in poverty can only afford certain foods, which would then cause certain physiologic variables to increase, exacerbating the problem (Gupta, de Wit, and McKeown, 2007). Whereas diets high in protein predicted lower BP in adults (Beundia et al, 2015). So this is good evidence that the diets of blacks in America do increase BP, since they eat high amounts of salt, low protein and high carb diets.
Still, others argue that differences in BP between blacks and whites may not be explained by ancestry, but by differences in education, rather than genetic factors (Non, Gravlee, and Mulligan, 2012). Their study suggests that educating black Americans on the dangers and preventative measures of high BP will reduce BP disparities between the races. This is in-line with Williams (1992) in that the social environment is the cause for the higher rates of BP. One hypothesis explored to explain why this effect with education was greater in blacks than whites was that BP-related factors, such as stress, poverty and racial discrimination (remember, even if no racial discrimination occurs, any so-called discrimination is in the eye of the beholder so that will contribute to a rise in physiologic variables) and maybe social isolation may be causes for this phenomenon. Future studies also must show how higher education causes lower BP, or if it only serves as other markers for the social environment. Nevertheless, this is an important study in our understanding of how and why the races differ in BP and it will go far to increase our understanding of this malady.
Conclusion
This is not an exhaustive list—I could continue writing about other variables—but these three are some of the most important as they are a cause for higher mortality rates in America. Understanding the hows and whys of these variables will have us better equipped to help those who suffer from diseases brought on by these differences in physiological factors.
The cause for some of these physiologic differences come down to evolution, but still others may come down to the immediate obesogenic environment (Lake and Townshend, 2006) which is compounded by lower SES. Since high carbs diets increase BP, this explains part of the reason why blacks have higher BP, along with social and genetic factors. Muscle fiber typing is set by the second trimester, and no change is seen after age 6 (Bell, 1980). Resting metabolic rate gap differences between black and white women can be closed, but not completely, if black women were to engage in exercise that use their higher amounts of type II muscle fibers (Tanner et al, 2001). This research is important to understand differences in racial mortality; because when we understand them then we can begin to theorize on how and why we see these disparities.
Physiologic differences between the races are interesting, they’re easily measurable and they explain both disparities in sports and mortality by different diseases. Once we study these variables more, we will be better able to help people with these variables—race be dammed. Race is a predictor here, only because race is correlated with other variables that lead to negative health outcomes. So once we understand how and why these differences occur, then we can help others with similar problems—no matter their race.
Differing Race Concepts and the Existence of Race: Biologically Scientific Definitions of Race
2700 words
Do you need to look at genetic differences between races to see if race is real? Some may argue that you do, and when you do you’ll see that genetic variation is too small to say that race exists. However, other arguments exist that do not look at genetic differences between races, but look at geographic ancestry, reproductive isolation between races, and morphologic differences. Those three variables are enough to prove the existence of race without looking at genetic differences between races. They do correspond to genetic differences between races. The four concepts I will briefly lay out are from Michael Hardimon, professor of philosophy at University of California, San Diego. The concepts are the racialist concept of race, minimalist concept of race concept, populationist concept of race, and the socialrace concept of race. One doesn’t need to look at the racialist concept of race to prove the existence of race, which I will prove below.
Michael Hardimon published Rethinking Race: The Case for Deflationary Realism earlier this year. In the book, he makes the case that race exists if minimalist race exists (I will get into what minimalist race entails below). Nevertheless, race deniers will say that even by looking at variables such as morphology, reproductive isolation, and geographic ancestry, race as a concept is scientifically invalid. This is patently false.
Concepts of race
The racialist concept of race
Hardimon’s first race concept is the racialist concept. The racialist concept (keep in mind, this is, as Hardimon writes on page 17 of his book Rethinking Race “the specific concept I have dubbed “the racialist concept” which “is hierarchal“) as defined by Hardimon holds that “racialist race is the idea of a fundamental division between groups and individuals” (Hardimon, 2017: 17). I think that Hardimon strawmans the racialist concept as he as defined it, but that’s for another day.
He also says that the racialist concept “is closely associated with racism” while the terms racialism and racism are “sometimes used interchangeably” (Hardimon, 2017: 17).
His argument against the racialist concept of race (as he defines it) is as follows (Hardimon, 2017: 21):
A third line of argument starts from the idea that in order for racialist races to exist, certain things must be true of human genetics, namely the following:
(a) The fraction of human genetic diversity between populations must exceed the fraction of diversity between them.
(b) The fraction of human genetic diversity within populations must be small.
(c) The fraction of diversity between populations must be large.
(d) Most genes must be highly differentiated by race.
(e) The variation in genes that underlie obvious physical differences must be typical of the genome in general.
(f) There must be several important genetic differences between races apart from the genetic differences that underlie obvious physical differences.
Note: (b) says that racialist races are genetically racially homogeneous groups; (c)-(f) say that racialist races are distinguised by major biological differences.
Call (a)-(f) the racialist concept of race’s genetic profile.
Now that his argument against the racialist concept (as he defines it) is laid out, you can see why I said that I think he strawmans the racialist concept. But I’ll get into that another day.
He then cites Lewontin’s (1972) analysis of blood groups by race as evidence against the racialist concept. Lewontin found that 85.4 percent of total human variation fell within populations. He also found that populations that populations classically defined as human races (Caucasians, Africans, Mongoloids, South Asian Aborigines, American Indians, and Oceanians) accounted for 8.3 percent of total human variation. Total variation between the classically defined races accounted for 6.3 percent of the variance.
It’s worth noting that the numbers given by Lewontin are true; where he goes wrong is assuming that there is no taxonomic significance for race based on the data he got from his analysis. “Call this Lewontin’s cleaver,” writes Hardimon on page 22.
Then in 2002, 31 years after Lewontin published his analysis, A.W.F. Edwards published his paper Human Genetic Diversity: Lewontin’s Fallacy. (Edwards, 2003). In the paper, Edwards argues that Lewontin’s conclusion is incorrect. Edwards (2003: 800-801) writes in his conclusion (emphasis mine):
There is nothing wrong with Lewontin’s statistical analysis of variation, only with the belief that it is relevant to classification. It is not true that ‘‘racial classification is … of virtually no genetic or taxonomic significance’’. It is not true, as Nature claimed, that ‘‘two random individuals from any one group are almost as different as any two random individuals from the entire world’’, and it is not true, as the New Scientist claimed, that ‘‘two individuals are different because they are individuals, not because they belong to different races’’ and that ‘‘you can’t predict someone’s race by their genes’’. Such statements might only be true if all the characters studied were independent, which they are not.
Of course, Lewontin’s conclusion is fallacious because small genetic differences do not entail that racial classification that race has no taxonomic significance (Richard Dawkins accepts the taxonomic existence of race). As you can see from the quote from Edwards, he does not object to Lewontin’s analysis of the races, he objects to his conclusion—namely that races do not exist based on the within-race variation being greater than between-race variation.
On page 22-23, Hardimon writes about Edwards’ objection to Lewontin’s conclusion:
Lewontin’s locus-by-locus analysis (which does not consider the possibility of a correlation between individual loci) does not preclude the possibility that individual loci might be correlated in such a way that people could be grouped into traditional racial categories. The underlying thought is that racial classification would have “taxonomic significance” were it possible to group people into traditional racial categories by making use of correlations between individual loci. However, Lewontin’s argument that there are no racialist races because the component of within-race genetic variation is larger than the component of between-race variation is untouched by Edwards’s objection.
In 2002, Rosenberg et al, in their paper Genetic Structure of Human Populations confirmed Lewontin’s analysis. They looked at 377 autosomal loci in 1,056 individuals from 52 populations and found that within-population differences between major groups (Africa, Europe, Asia, the Middle East, Central and South Asia, East Asia, Oceania, and America) accounted for 3-5 percent of genetic variation while genetic differences between individuals accounted for 93-95 percent of genetic variation. So Rosenberg et al (2002) confirmed Lewontin’s (1972) analysis—though do recall that Lewontin’s conclusion is incorrect. According to Hardimon’s interpretation of the racialist concept of race, both Lewontin’s and Rosenberg et al’s analysis disprove the racialist concept of race, but that doesn’t mean that there is no scientific basis for the biological reality of race (Hardimon, 2012).
The minimalist concept of race
The minimalist concept of race is similar to the racialist concept, though there are some stark differences. It does not say that there are intrinsic differences between races—call them essences if you will), but it does say that you can distinguish races by patterns of different physical features such as skin color, hair type, nose shape, morphology, etc, which then correspond to differences in geographic ancestry in geographically, genetically isolated breeding populations.
The minimalist concept of race further states that (i) races are distinguised from other races by patterns of visible physical features; (ii) the members are linked by a common ancestry which is peculiar to members of the group; and (iii) this group must originate from a distinct location.
The minimalist concept of race does not require: that the fraction of human genetic diversity between minimalist races is larger than the fraction of diversity within them; it is compatible with within-race diversity being large and between-race diversity being small; it does not require most genes to be highly differentiated by race; it does not require the existence of a lot genetic differences between races that underlie more than the phenotypic differences already noticed; the concept does not imply that there can be predictions made from yet unstudied characteristics; it finally does not require any genetic differences between races other than those found in the genes that underlie differences in physical appearance between race. This is called the minimalist concept of biological race (Hardimon, 2017: 66) and it survives all objections from Lewontin’s and Rosenberg et al’s analysis of between-race genetic variation.
This is my favorite race concept, personally, because it covers any and all objections from the race-denialist crowd—people who deny any genetic differences between races—because the only genetic differences it counts on are those physical traits that are already noticed.
Hardimon (2017: 29) writes:
Such readers should feel free to regard the minimalist concept of race, that is, as a concept that, though in many respects similar to the ordinary concept, is nonetheless distinct from it. What I would insist on is that minimalist races (groups satisfying the minimalist concept of race) are *races* (that is races so properly called)—either because the minimalist concept of race just is the ordinary concept of race or because it captures enough of the ordinary concept of race for minimalist races to be counted as races. My view is that if it can be shown that minimalist races exist, races exist. And if it can be shown that *minimalist race* is real, race is real.
The populatonist concept of race
The populationist concept of race is a nonessentialist, non-hierarchical concept of race that slightly differs from the minimalist concept of race. The populationist concept of race can be said to be a scientific concept of race (as can the minimalist concept) because it characterizes races as groups belonging to different groups of biological descent, they are distinguished by patterns of phenotypic differences, and these phenotypic differences trace back to geographically separated and genetically isolated founding populations.
The populationist concept of race also holds that “A race is a subdivision of Homo sapiens—a group or population that exhibits a distinctive pattern of genetically transmitted phenotypic characters that corresponds to the group’s geographical ancestry and belongs to a biological line of descent initiated by a geographically separated and reproductively isolated founding population” (Hardimon, 2017: 99). So with these criteria, you can see that even if you do not accept the racialist concept of race (as Hardimon defines it), you can still be a race realist. The populationist concept is likely to exist, and if the populationist concept of race exists then race is real.
Defining race as geographically and reproductively isolated breeding populations that share a common line of biological descent with similar phenotypic characters is as barebones a concept of race as you can get—and it is perfectly in line with how most people view races on the basis of phenotypic characterization. The populationist concept of race supposes that numerous concepts from the racialist concept of race are true—but do not presuppose any to-be-studied differences between those races. The strength of the populationist argument, as you can see, is very strong and it holds up to numerous lines of criticism very well. Although both the populationist and minimalist race concepts do not presupposed any to-be-studied differences between races, this still is not good enough for race deniers.
It is clear that without even looking at the brain and physiological differences between races, that race does indeed exist and it does—contrary to popular belief—have implications for people’s health of certain races.
The socialrace concept of race
Finally, the last concept of race laid out by Hardimon is the concept of socialrace. The concept of socialrace takes a race to be a racialist race, it refers to a position that is occupied by a social group that is a socialrace, and the socialrace concept refers to the system of social positions that are socialraces. This concept of race is, clearly, different from the minimalist and populationist race concepts but does indeed correlate with popular notions of race (and would correlate with the minimalist and populationist concept of race very well). The socialrace concept is, basically, what is believed to be racialist races.
The concept of socialrace is a concept of race as a social group (Hardimon, The Ontology of Race: 31)
The socialrace concept differs from the minimalist and populationist concept of race in that it looks at so-called social—not biological—correlates of race. Though, still, the socialrace concept can be said to show the reality of race since how one socially defines themselves correlates almost perfectly with geographic ancestry (which is a prerequisite for the existence of the minimalist concept of race and the populationist concept of race) (Tang et al, 2005). They showed that self-identified racial categories lined up almost perfectly with geographic ancestry (99.86 percent of the time). So, as you can see, the concept of socialrace also gives credence to the existence of the minimalist and populationist concepts of race.
This concept of race—as its name implies—does not talk race is a biological manner, but a social one, as its name implies. However, due to the extremely high chance that one’s self-identified race (their socialrace) lines up with the geographic ancestry of the classical races, we can see that the socialrace concept further buttresses the argument for the existence for the reality of the minimalist concept of race and the populationist concept of race.
The socialrace concept is kind of like Templeton (2014) defines race: that human races exist in a cultural sense, but not biologic sense. I have shown, though, that races exist in a cultural, social, and biological sense with the arguments presented in this article. Socialrace, culturalrace, whatever you want to call it, it is evidence for the existence of race.
Conclusion
Race exists whether or not the racialist position of race (as Hardimon defines it) is true or not. The minimalist concept of race and populationist concept of race show that race is real while the concept of socialrace further lends credence to the biological models of the minimalist and populationist concept of race. Even still, people who deny race because the genetic distance between races is too small for their to be any meaningful differences between them do not accept that three arguments above (sans the racialist concept) for the existence of race. They’ll still talk about the genetic differences between them and, say, morphology, but the minimalist concept of race and the populationist concept of race define race in enough of a way that genetic differences do not need to be looked at—we can only look at reproductive isolation, morphology, geographic ancestry and physical differences between minimalist and populationist races such as hair, nose, and skin color along with morphological differences.
Minimalist and populationist races exist and are a biological reality. We can take those two concepts to be a scientific basis for race. While we can take the concept of socialrace not as a biological concept, but as a social concept and we can then say that socialrace is socially real while being a significant social reality. That social reality is manifested by noticing different racial phenotypes, along with differences in SES, educational attainment, etc, and placing different races in different average social positions, which would correlate with the concepts of race mentioned above. This also correlated nearly perfectly with geographic ancestry. So, I’m saying it again, the existence of race as a social reality is real; the existence of socialrace buttresses the arguments for both the existence of the minimalist concept of race and the populationist concept of race—both of which are scientific concepts of race.
Minimalist races exist, and is a superficial biological reality, populations races may exist and if they exist, they are a relatively superficial biological reality. Socialraces exist and are a social reality which also lend credence to the minimalist and populationist concepts. I personally am privy to the minimalist race concept because it is shown to be real, so race is real.
In sum, race exists whether you look at genetic differences between races or not, morphology, geographic ancestry, reproductive and genetic isolation are all you need to prove the existence of race. There is a scientific concept of race, and the minimalist and populationist race concepts provide the existence for it, while the socialrace concept does as well. It is clear that for a scientific concept of race, you only need phenotypic variation, morphologic variation between races,
(Also read the American Rennaisance review for the book, A Tactical Retreat for Race Denial. I think it is balanced and fairly written, though a bit biased and doesn’t account for Hardimon’s views well enough in my opinion.)
Evidence for Testosterone Influencing Sports Performance
1200 words
Back in July I wrote about how there is controversy on whether or not MtF transgenders should compete with ‘bio women’ and whether or not their anthropometry or hormones gave them an advantage over biological women (I am aware that T levels decrease once they go on HRT, just a lot of them still have T ranges in near the low end of the new numbers for men). Well I am reading The Sports Gene by Jerry Epstein and he brings up two (anecdotal) examples of MtF transgenders who take HRT and see a decrease in performance due to decreased T:
No scientist can claim to know the precise impact of testosterone on any individual athlete. But a 2012 study that spent three months following female athletes from a range of sports—including track and field and swimming—showed that elite-level competitors had testosterone levels that consistently remained more than twice as high as those of the nonelites. And there are powerful anecdotes as well.
Joanna Harper, fifty-five, is a medical physicist who was born a male and later transitioned to living as a woman. Harper also happens to be a nationally accomplished age-group runner, and when she started hormone therapy in August 2004 to suppress her body testosterone and physically transition to female [Note from RR: I, of course, do not agree with the use of ‘her’ and that ‘she’ ‘physically transition[ed] to female’] like any good scientist, she took data. Harper figured she would slow down gradually, but was surprised to find herself getting slower and weaker by the end of the first month. “I felt the same when I ran,” she says. “I just couldn’t go as fast.” In 2012, Harper won the U.S. national cross-country title for the fifty-five-to-fifty-nine age group, but age and gender-graded performance standards indicate that Harper is precisely as competitive now as a female as she was as a male. That is, as a female, Harper is just as good relative to women as she was relative to men before her transition, but she’s far slower than her former, higher-testosterone self.
In 2003, as a man, Harper ran Portland’s Helvetia Half-Marathon in 1:23:11. In 2005, as a woman, she ran the same race in 1:34:01. Harper’s male time was about fifty seconds faster than her female time. She has compiled data from five other runners who have transitioned from male to female, and all show the same pattern of precipitous speed decline. One runner competed in the same 5K for fifteen years straight, eight times as a man and then seven times as a woman following testosterone suppression therapy; always faster than nineteen minutes as a man, and always slower than twenty minutes as a woman. (Epstein, 2013: 78) [Keep in mind that I have the nook version so the physical copy may have this on a different page.
Yes this is anecdotal evidence that testosterone gave an advantage while ‘male’ and then when they ‘transitioned’ to ‘female’ it showed that they became weaker, but still at the top level of women’s performance. Knowing this—how this man had an advantage ‘as a man’ and kept the same relative advantage when he ‘transitioned to a woman’ is a large clue that testosterone does infer an inherent advantage to athletes who have more of the hormone surging through their body.
Testosterone is known to affect skeletal muscle growth, but the mechanisms by which testosterone affects muscle growth are not known (Bhasin, Woodhouse, and Storer, 2001). Also, women with very high androgen levels—whether it’s due to endogenous or exogenous testosterone—have a 2.5 to 5 percent advantage over women who have androgen levels in the normal range (Berman, 2017). So the difference in performance—between women at least—with high and low levels of testosterone is not too great, though that 2.5 to 5 percent advantage most likely would come into play at the very end of the race.
Also recall that I previously wrote that, per the IOC guidelines, a ‘MtF’ needs to ‘declare herself’ a woman for at least four years while taking HRT for 1-2 years to be able to compete with ‘the gender they think they are’. Well, the testosterone levels that the IOC states is ‘OK’ for ‘MtFs’ is still in the low range of the new testosterone guidelines for men! Testosterone most definitely does give an advantage in sports. Think of sports as a modern day test of survival. Basically, those good at sports—such as football and basketball for instance—would have been better able to form hunting parties in our evolutionary past. So while forming these parties, testosterone rose since testosterone raises while men are in groups as well as preparing for competition (Booth et al, 1989). So since our modern body plans sprang up around 2 mya with the appearance of Homo erectus in the fossil record, we can logically infer that cooperation and testosterone—among other things—were needed to be successful hunters.
So if you look at most sports as just a way for men to have a competitive spirit and simulate fighting/hunting with other men, then it makes it clear that testosterone does infer an advantage in sports. For instance, there is a clear relationship between testosterone and explosive jumping (Cardinale and Stone, 2006). These relationships are very clear, have large effects yet bodies like the IOC disregard these findings, allowing MtFs to compete with real women, even when the data and verbal argumentation against letting them compete are logically sound.
Studies do state, of course, that the relationship between high testosterone and athletic performance hasn’t been proven, they also haven’t been refuted either (Sudai, 2017). In fact, all you need to look at is traits that are influenced by testosterone—height, size of limbs, fat mass, shoulder width/size (the most androgen receptors lie in the shoulders and traps muscles, so to tell if someone is juicing, they will have low levels of body fat but ‘3-D delts’ and large traps) etc. So just by looking at a few simple traits and then comparing anatomy with females who have high testosterone compared to women who do not have high levels of testosterone, we can draw the logical conclusion that testosterone does increase sports performance for both men and women, and we have both anecdotal and experimental evidence for the assertion.
In sum, the anecdotal evidence from Epstein’s book is a good start. However, we will need more than anecdotal evidence to prove that testosterone truly does give individuals an advantage if they do have higher testosterone levels than their competition. As larger studies get done, these effects will begin to get teased out. I am certain that testosterone will be found to give a huge advantage in terms of sports, and since sports are a way for us to compete with each other, impress women, gauge other males’ fighting skills, and began as a way to hone skills used to hunt and fight (Lombardo, 2012). Sports began as a way for us to develop the skills needed to survive and hunt, among other things, and so, to hunt, you need to have high levels of testosterone to give that ‘boost’. So if sports began as a way to gauge potential rivals and allies, and as a way to hone/improve fighting skills, then we can logically state that testosterone does give an advantage in sports competition.
