
Home » Nutrition (Page 3)
Category Archives: Nutrition
Why Are Men Attracted To Low Waist-to-Hip Ratios?
3050 words
Why are men attracted to low waist-to-hip ratios (WHR)? Like with a lot of our preferences, there is an evolutionary reason why men are attracted to low WHR. I came across a paper the other day by M.D. William Lassek, “Assistant Professor of Epidemiology and Research Associate in the department of Anthropology at the University of California, Santa Barbara” and co-author P.h.D. Steven Gaulin, Professor of Anthropology with specific research interests in “evolutionary psychology, cognitive adaptations, the human voice, sexual selection, evolution of sex differences, lipid metabolism and brain evolution.” This paper fascinates me because it talks about the evolution of human intelligence through a lens of nutrition and micronutrients, something that I’m well-read on due to my career. First, I will discuss the benefits of fish oil and the main reason for taking them: omega-3 fatty acids and DHA. Then I will discuss the WHR/intelligence theory.
Fish Oils, DPA/EPA, and Omega-3 Fatty Acids
Misinformation about fish oils is rampant, specifically in the HBD-sphere, specifically with Steve Sailer’s article HBD and Diet Advice. The study he cites (with no reference) I assume is this study by Yano et al (1978) in which they found that Japanese men who ate more carbohydrates had less of a chance to die of cardiovascular heart disease (CHD). He says that the first generation ate mostly rice and no fat while the second generation “ate cheeseburgers and had higher rates of coronary disease than their parents.” He then says that these diet recommendations (low-fat, high-carb) were put onto all populations with no proven efficacy for all ethnies/racial groups. These diet recommendations began around two decades before the 80s, however.
He then quotes an article by the NYT science write, Carl Zimmer, talking about how the Inuit study has “added a new twist to the omega-3 fatty acid story”. Now, I read papers on nutrition every day due to my career, I don’t know what kind of literature they read on the subject, but fish oil, more specifically DPA/EPA and omega-3s are hugely important for optimal brain growth, health, and function.
Controlled studies clearly show that omega-3 consumption had a positive influence on n-3 (fatty acid) intake. N-3 has also been recognized as a modulator of inflammation as well as the fact that omega-3 fatty acids down-regulate genes involved in chronic inflammation, which show that n-3 is may be good for atherosclerosis.
An increase in omega-3 consumption leads to decreased damage from heart attacks.
Omega-3 may also reduce damage after a stroke.
Dietary epidemiology has also shown a link between n-3 and mental disorders such as Alzheimers and depression. N-3 intake is also linked to intelligence, vision and mood. Infants who don’t get enough n-3 prenatally are at risk for developing vision and nerve problems. Other studies have shown n-3’s effects on tumors, in particular, breast, colon and prostate cancer.
Omega-3’s are also great for muscle growth. Omega-3 intake in obese individuals along with exercise show a speed up in fat-loss for that individual.
Where do these people get their information from? Not only are omega-3’s good for damage reduction after a stroke and a heart attack, they’re also good for muscle growth, breast, colon and prostate tumor reduction, infants deficient in omega-3 prenatally are at risk for developing nerve and vision problems. Increase in omega-3 consumption is also linked to increases in cognition, reduces chronic inflammation and is linked to lower instances of depression.
Clearly, fish oils have a place in everyone’s diet, not only Inuits’.
This also reminds me of The Alternative Hypothesis’s argument that there are differing CHO metabolisms based on geographic origin (not true, to the best of my knowledge).
WHR and Intelligence
Most of the theories of the increase in brain size and intelligence have to do with climate, in one way or another, along with sexual selection. Though recently, I’ve been rethinking my position on cold winters having that big of an effect on intelligence due to some new information I’ve come across. The paper titled Waist-hip ratio and cognitive ability: is gluteofemoral fat a privileged store of neurodevelopmental resources? by Lassek and Gaudin (2008) posits a very sensible theory about the evolution of human intelligence: mainly that men prefer hour-glass figures due to an evolutionary adaptation.
Why may this be the case? One of the most important reasons I can think of is that women with high WHR have a higher chance of rate of death. The Nurses Health Study followed 44,000 women for 16 years and found that women who had waists bigger than 35 inches had a two times higher risk of dying from heart disease when compared to women with the lowest waist size of less than 28 inches. Clearly, men prefer women with low WHR since they will live longer, conceive more children and be around longer to take care of said children. So while a low WHR is not correlated with fertility per se, it is correlated with longevity, so the woman can have more children to spread more of her genes.
Lassek and Gaulin also bring up the ‘thrifty gene hypothesis’, which states that these genes evolved in populations that experienced nutritional stress, i.e., famines. I’ve read a lot of books on nutrition and human evolution (I highly recommend The Story of the Human Body: Evolution, Health, and Disease) over the years and most of them discredit the idea of the thrifty gene hypothesis. However, recent research has shown the existence of these ‘thrifty genes’ in populations such as the Samoans and ‘Native’ Americans. It’s simple, really. Stop eating carbohydrates and the problems will fade away. (Hunter-gatherers don’t have these disease rates that we do in the West; it’s clear that the only difference is our diet and lifestyle. I will cover this in a future post titled “Diseases of Civilization”.)
Lassek and Gaulin pursued the hypothesis that gluteofemoral fat (fat stored in the thighs and buttocks) was the cause for the difference in the availability of neurodevelopmental nutrients available to a fetus. If correct, this could show why men prefer women with a low WHR and could show why we underwent such rapid brain growth: due to the availability of neurodevelopmental nutrients in the mother’s fat stores. Gluteofemoral body fat is the main source of long-chain polyunsaturated fatty acids (LPUFA) for children, along with another pertinent nutrient for fetal development: DHA. Lassek and Gaulin also state that 10 to 20 percent of the fat stored by a young woman during puberty is gluteofemoral fat, obviously priming her for childbearing. Even with caloric restriction, the gluteofemoral fat is not tapped utilized until late pregnancy/lactation when the baby needs nutrients such as DPA/EPA and omega-3s.
Further, 10 to 20 percent of the dry weight of the brain is made up of LCPUFA, which shows how important this one nutrient is for proper brain development in-vitro as well as the first few years of life. Lassek and Gaulin state:
A recent meta-analysis estimates that a child’s IQ increases by 0.13 point for every 100-mg increase in daily maternal prenatal intake of DHA (Cohen, Bellinger, Connor, & Shaywitz, 2005), and a recent study in England shows a similar positive relationship between a mother’s prenatal consumption of seafood (high in DHA) and her child’s verbal IQ (Hibbeln et al., 2007).
Along with what I cited above about these nutrients and their effects on our bodies while we’re in our adolescence and even adulthood, this is yet another huge reason WHY we should be consuming more fish oils, not only for the future intelligence of our offspring, but for our own brain health as a whole. Lassek and Gaulin state on pg. 3:
Each cycle of pregnancy and lactation draws down the gluteofemoral fat store deposited in early life; in many poorly nourished populations, this fat is not replaced, and women become progressively thinner with each pregnancy, which is termed “maternal depletion” (Lassek & Gaulin, 2006). We have recently shown that even well-nourished American women experience a relative loss of gluteofemoral fat with parity (Lassek & Gaulin, 2006). In parallel, parity is inversely related to the amount of DHA in the blood of mothers and neonates (Al, van Houwelingen, & Hornstra, 1997).
That critical fatty acids are depleted with parity is also consistent with studies showing that cognitive functioning is impaired with parity. IQ is negatively correlated with birth order (Downey, 2001), and twins have decreased DHA (McFadyen, Farquharson, & Cockburn, 2001) and compromised neurodevelopment compared to singletons (Ronalds, De Stavola, & Leon, 2005). The mother’s brain also typically decreases in size during pregnancy (Oatridge et al., 2002).
This also could explain why first born children are more intelligent than their siblings: because they have first dibs on the neurodevelopmental nutrients from the gluteofemoral fat, which aids in their brain growth and intelligence. What also lends credence to the theory is how the mother’s brain size typically decreases during pregnancy, due to the neurodevelopmental nutrients going to the child. (I also can’t help but wonder if this has any effect on Chinese IQ, since they had a nice increase in intelligence due to the Flynn Effect from 1982 to 2012. I will cover that in the future.)
“This hypothesis,” the authors write, “thus unites two derived (evolutionarily novel) features of Homo sapiens: sexually dimorphic fat distributions and large brains. On this view, a low WHR signals the availability of critical brain-building resources and should therefore have consequences for cognitive performance.”
The authors put forth three predictions for their study: 1) that a woman’s WHR should be negatively correlated with the cognitive ability of her offspring, 2) a woman’s WHR should be negatively correlated with her own intelligence since a woman passes on DPA as well as her own genes for low WHR to female offspring and 3) “cognitive development should be impaired in women whose first birth occurred early as well as in her future offspring, but lower WHRs, which indicate large stores of LCPUFA should be significantly protective for both” the mother and the child.
Lassek and Gaulin used data from the NHANES (National Health and Nutrition Examination Survey) III which included over 16,000 females with a mean age of 29.9 years. Measurements were taken on waist and hip circumference, WHR, BMI, and body fat as measured from bioelectrical impedance.*
For 752 “nulligravidas” (medical term for a woman who has never been pregnant), WHR explained 23 percent of the variance in total body fat estimated from the bioelectrical impedance (ugh, such a horrible measure). Moreover, “controlling for age and race/ethnicity” showed an increase of “0.01 in WHR increases total body fat by .83 kg” (1.82 pounds in freedom units). They also discovered that WHR explains 28 percent of the variance in BMI, with an increase of .47 kg per square meter, increasing the WHR by 0.01. BMI also explained 89 percent of the variance in body fat (garbage ‘body fat measuring instrument’ aside) with an increase of 1 kg per square meter increasing fat by 1.8 kg (close to 4 pounds in freedom units), but when added to the regression model, WHR made no additional contribution.
Lassek and Gaulin’s first hypothesis was corroborated when they found that the mother’s WHR was negatively correlated with the child’s intelligence on 4 cognitive tests. WHR accounted for 2.7 percent of the variation in test scores, “with a decrease of 0.01 in the mother’s current WHR increasing the child’s mean cognitive score by 0.061 points”. In the first subsample, they controlled for mother’s age, parental education, family income and race/ethnicity. Even when these variables were controlled for, WHR was still negatively correlated with the cognitive score. When these variables were controlled for, a decrease of 0.01 in WHR increased the average score by 0.024 points.
Their second hypothesis was also confirmed: that women with lower WHR would be more intelligent than women with higher WHRs. In girls aged 14-16, the WHR accounted for 3.6 percent of the variance in the average of the four cognitive tests. Also discovered was that in women aged 18 to 49, WHR accounted for 7 percent of the variance in years of education and 6 percent of the variance in two tests of cognitive ability. Even when controlling for age, parity, family income, age at first birth, and race/ethnicity, the negative correlation was still seen in 14 to 16-year-old girls.
There is also competition neurodevelopmental resources between mother and child. As I showed earlier in this article, a woman’s brain size decreases during pregnancy. This decrease in brain size during pregnancy is due to the babe getting more of the neurodevelopmental nutrients for brain growth from the mother. Clearly, as the mother’s stores of brain-growing nutrients become depleted, so does her brain size as te nutrients from her stored fat goes to developing the fetuses’ brain.
Lassek and Gaulin confirmed their hypothesis that a woman with a lower WHR would be more intelligent as well as have more intelligent children. WHR predicts the cognitive ability of the offspring while BMI does not. However, controlling for family income and parental education decreases the effect of WHR on the child’s intelligence, the effect still remains giving strong support to the hypothesis that women with low WHR pass on genes for low WHR as well as nutrients needed for neurodevelopment. Further, controlling for parental cognitive ability may mask the effects of the WHR. It’s well known that the mother’s intelligence is the best predictor for her offspring’s intelligence, which is due to the mother and grandmother passing on genes that augment the effect of LCPUFAs, along with the genes for lower WHR.
Women with a lower WHR were found to be more intelligent, and a lower WHR helps to protect cognitive resources (neurodevelopmental nutrients) for the mother and child. The mother’s body has a dilemma, though: it has to store nutrients for the mother’s own cognition; store resources for future pregnancies; and provide nutrients for their growing fetus. Obviously, especially in young mothers, this poses a problem as there is a conflict for what the brain should do with the nutrients the mother ingests. Children born to teenaged mothers have lower cognitive test scores, but, they are protected from this fate if the mother has a low WHR. This shows, definitively, that young mothers who are still growing will show no negative effects on their growth when pregnant if they have a low WHR which signals they have a large amount of LCPUFAs and other essential neurodevelopmental nutrients for the baby’s brain growth.
LCPUFAs are scarce in human diets. Thusly, an evolutionary preference for low WHR evolved for men so their children can have optimal nutrients while growing in the mother’s womb. The study confirmed that large brains, and along with it higher intelligence, and sexually dimorphic fat distribution have a strong link. Clearly, if a mother doesn’t have adequate levels of LCPUFAs, neurodevelopment will be impeded since the babe will not be getting the optimal nutrients for brain growth. Moreover, diets low in omega-3s should have consequences for intelligence and brain size of a baby, since when a baby is in the womb that is the most important time for it to get optimal brain nutrients. Is there any type of environment we can make ourselves and lifestyle choices we can take for ourselves, spouses and children to foster higher intelligence in them? I will cover that in the future.
Men love hour-glass figures, a low WHR. As I’ve shown in this article, there is an evolutionary reason for this. Men were asked to rate women who had surgery to move fat to their buttocks. Body weight stayed the same, but the fat was redistributed. It was found in brain scans of the men that the same parts of the brain related to reward lit up, including regions associated with drugs and alcohol. (more information here)
Conclusion
I’ve long known of the tons of positive benefits of omega-3 fatty acids and fish oil on human brain development. Fish oils and the nutrients in them are imperative for a healthy and growing brain. Without it, brain development will suffer. As a man, I can say firsthand that a low WHR is the most attractive. Now I understand the evolutionary reason behind it: fostering high intelligence due to the mothers lower-body fat stores. Omega-3s and LCPUFA are extremely important for optimal fetal brain growth. Moreover, the current American diet is low in omega-3s, while high in omega-6s. There is evidence of high omega-6 intake being related to obesity, metabolic syndromes, a progressive increase in body fat over the generations. The omega-6 and -3 ratios in the body also play a role in obesity, with a lower omega-3 ratio and higher omega-6 ratio being related to obesity. This is due to adipogenesis, browning of the fat tissue, lipid homeostasis, and systemic inflammation. Clearly, as shown in this article, it’s imperative to have a balance of omega-3 and omega-6 fatty acids. This could also have to do with the hyperactivity of the cannabinoid system (which we all know what that’s involved with: eating more) and that could also be a cause for obesity with out-of-whack omega-6 to -3 fatty acid levels in the body. That’s for another day, though.
The totality of evidence is clear. If you want healthy children, choose a mate with a low WHR. She and her offspring will be more likely to be more intelligent. Clearly, if you’re reading this, you’re interested in intelligence as well as having the best possible life and life outcomes for your children. Well, choose a woman with a low WHR and you’ll be more likely to have more intelligent children!
* I have one problem with this study. They assessed body fat with bioelectrical impedance. The machine sends a light electrical current through the body and measures the degree of resistance to the flow of the current, which body fat can then be estimated. Problems with measuring body fat this way are as follows: it depends on how hydrated you are, whether you exercised that day, when you last ate, even whether your feet are calloused. Most importantly, they vary depending on the machine as well. Two differing machines will give two differing estimates. This is my only problem with the study. I would like if, in a follow-up study, they would use the DXA scan or hydrostatic weighing. These two techniques would be much better than using bioelectrical impedance, as the variables that prevent bioelectrical impedance from being a good way to measure body fat don’t exist with the DXA scan or hydrostatic weighing.
(Also see Eternal Curves by the Lassek and Gaulin and their book Why Women Need Fat for more information.)
Agriculture and Evolution: A Reply to The Alternative Hypothesis
2050 words
I love nutrition science. So much so that I read a new book on it every week. The Alternative Hypothesis has a pretty old video on agriculture and evolution. I strongly disagree with his main thesis. I strongly disagree with his denigration of Gary Taubes. Most of all, I strongly disagree with what he says about the East Asian rice eaters because since that video has been made, the carbohydrate/insulin hypothesis of obesity has changed to the insulin hypothesis of obesity.
In the very beginning of the video he brings up Gary Taubes’s research on low-carb diets and how people tend to be healthier than those who eat higher carb diets. He brings up the East Asians who eat a lot of rice. However, it’s clear he doesn’t know that the percent of carbohydrate intake is nowhere near as important as the absolute amount of carbohydrate consumed:
- They consume a fraction of the sugar we do. More sugar consumption leads to greater insulin resistance, more fat creation, less fat breakdown, and more fat accumulation.
- They consume less total glucose, AND the glucose they consume is accompanied by less sugar (and less omega-6 PUFA, if it matters).
- They consume a ratio of omega-6 to omega-3 PUFA that is much lower than we do. This mayfurther reduce any insulin resistance brought on by the glucose they do consume (in smaller doses and with less sugar).
The fact that East Asians didn’t have high rates of diabesity (diabetes and obesity) was a big blow to the carbohydrate insulin hypothesis. However, the East Asian rice paradox is simply explained by low, if non-existent, consumption of refined carbohydrates. Those populations actually consume fewer total carbohydrates than Western diets, and have lower levels of glycemic load as a result. To quote Mark Sisson:
Before recently, Asians ate less refined sugar and used animal fats for cooking. Sugar intake is rising now, of course, and cooking oils made from corn and soybean have largely replaced lard and tallow, but rice in the context of a low-sugar, no-HFCS (remember, the oft-cited 55/45 fructose/glucose breakdown for HFCS is highly misleading and actually quite often incorrect), low-vegetable oil, nose-to-tail nutrient-dense diet is (or was) acceptable. You can’t reduce a food down to its constituent parts and focus on, say, the bit of fructose in a blueberry and then condemn the entire berry because of it. Similarly, you can’t reduce a diet down to a single constituent food and condemn – or praise – it based on that single food. You have to look at the entire picture, and the Asian diet is largely a nutritious one.
These paradoxes where one population seems to disprove a certain hypothesis are pretty easily explainable with the existing data. There are numerous reasons why East Asian rice eaters have lower rates of diabesity. Dr. Jason Fung also explains why:
Wheat, particularly in the modern iteration may be particularly fattening for numerous reasons. The high level of amylopectin means that most of the starch contained in flour is efficiently converted to glucose. This deadly combination of wheat and sugar has been introduced into the Chinese diet. The result is a Chinese diabetes catastrophe. The prevalence of diabetes in China has now even outstripped the USA.
This is the answer to the paradox of the Asian Rice eater puzzle. Why didn’t the Chinese have a diabetes epidemic in 1990 with all their white rice? Well, because they didn’t eat any sugar (fructose), they were not developing insulin resistance. Because they were not snacking all the time, they had periods of low insulin level that helped prevent the development of insulin resistance. So the high rice intake by itself was not enough to cause either of diabetes or obesity.
Then he says that whites intake more total carbs in comparison to blacks and ‘Hispanics’ (1:32 in the video). This is wrong.
Diaz et al (2005) showed that minority populations are more likely to be affected by diabetes mellitus which may be due to less healthy diets and/or genetic factors. Using the National Health and Nutrition Survey for 1999-2000, they analyzed overweight, healthy adults, calculating dietary intake variables and insulin sensitivity by ethnicity. They characterized insulin resistance with fasted insulin, as those who are more likely to become insulin resistant have higher fasted insulin levels (levels taken after waking, with the subject being told not to eat the night before as to get a better reading of fasted insulin levels). Non-‘Hispanic’ whites had higher energy and fat intake while ‘Hispanics’ had higher carb intake with blacks having lower fiber intake. Blacks and ‘Hispanics’ were more likely to have lower insulin sensitivity. However, ‘Hispanics’ were more likely to have lower insulin sensitivity even after controlling for diet, showing that metabolic differences exist between ethnicities that affect carbohydrate metabolism which leads to higher rates of diabetes in those populations.
Diaz et al state in the results of the study:
Dietary differences are seen by ethnicity, with non-Hispanic whites having higherenergy, saturated fat and total fat intake, while Hispanics had higher carbohydrate intake and African-Americans had lower fibre intake.Both African-Americans and Hispanics had higher levels of fasting insulin, demonstrating lower insulin sensitivity in comparison with non-Hispanic whites.
So now that I’ve established that blacks and ‘Hispanics’ consume more total carbohydrates from refined foods, now I’ll show the physiologic effects of insulin.
Insulin inhibits the breakdown of fat in the adipose tissue by inhibiting the lipase that hydrolyzes (the chemical breakdown of a compound due to a reaction with water) the fat out of the cell. Since insulin facilitates the entry of glucose into the cell, when this occurs, the glucose is synthesized into glycerol. Along with the fatty acids in the liver, they both are synthesized into triglycerides in the liver. Due to these mechanisms, insulin is directly involved with the shuttling of more fat into the adipocyte. Since insulin has this effect on fat metabolism in the body, it has a fat-sparing effect. Insulin drives most cells to prefer carbohydrates for energy. Putting it all together, insulin indirectly stimulates the accumulation of fat into the adipose tissue.
Do you see why blacks and ‘Hispanics’ are more susceptible to obesity?
Another glaring error he commits is not separating refined carb consumption with natural carb consumption. Refined carbs spike insulin much more than those foods with natural carbohydrates. East Asians do not have a “higher carbohydrate tolerance than Europeans” (2:06 in the video). This one huge error he commits completely discredits his hypothesis.
He then goes on to talk about India’s diabetes rates. But why is it increasing? Because of Western diets. It’s not about a “lower carbohydrate tolerance” as he says at 3:07, it’s about consuming more refined carbohydrates.
Then at 5:05, he says that he’s “solved Gary Taubes’s race problem in regards to diet”. He did nothing of the sort.
I, of course, have no problem with his IQ data. I have a problem with the conclusions he jumps to in regards to carbohydrates and diabetes. He clearly didn’t look at other factors that would explain why East Asians have lower rates of diabesity (which is increasing as they adopt a Western lifestyle… Weird…). The same thing explains it with the Australian Aborigines.
I have absolutely no problem with the second half of his video. My problem is the first half of it–his denigration of Taubes, non-understanding of insulin spikes in comparison to the quality of carbohydrate ingested and not controlling for refined carbs– as it’s clear he didn’t do extensive research into these populations (which Taubes and others have) to show why they don’t have higher rates of diabesity.
What he doesn’t touch on are “obesogenic environments” which is defined as “the sum of influences that the surroundings, opportunities, or conditions of life have on promoting obesity in individuals or populations”. What a huge coincidence that most of the populations he cited today with higher rates of diabesity live in first-world nations, otherwise known as obesogenic environments.
He should have spoken about the Pima Indians and their rates of diabesity. They didn’t have rates of diabesity as high 100 years ago. Why? The introduction of the obesogenic environment. Prisancho (2003) in his study on the Pima and reduced fat oxidation in first-world countries showed how the Pima preferentially burn carbs and not body fat for energy. Fat-burning would account for 9 kcal lost and CHO for 4. Since they preferentially burn carbs for energy and not fat, this shows why they have higher rates of diabesity. It’s not that it’s a genetic susceptibility to burn CHO for energy over fat (there may be a small genetic component, but it doesn’t override the effects of the actual diet). I’ve shown insulin’s role in fat storage above, do you see why the Pima have this diabesity epidemic after the introduction of refined carbohydrates and the obesogenic environment?
Added sugars and salts in foods causes us to want more of those foods. As I alluded to above, food scientists continuously work to find out which combinations of sugar, salt and fat will be more hyperpalatable to us and make us eat them more. Whites nor East Asians have a ‘higher carb tolerance’, they just eat different types of carbs (mostly unrefined, in comparison to blacks and ‘Hispanics’ anyway). If any individual were to overeat on high carb foods they would become diabetic and obese. Whites nor East Asians are exempt from that.
In sum, he didn’t look at where the carbs came from, only total carb intake. Refined carbs and unrefined carbs do different things in the body. The whiter a processed food is, the more it is refined. The more a food is processed, the more its natural nutrients such as fiber are taken out. These low-fat refined foods are one cause of obesity. However, it’s way too complicated to say that only refined carbohydrates cause diabesity.
I strongly recommend he read Taubes’s and Fung’s books. If he did, he wouldn’t have said what he said about Taubes’s theory and completely disregard the absolute total amount of carb intake and not the total amount of carbohydrates ingested.
Are Flynn Losses in France Due to Immigration?
1850 words
Over a ten year period in France, from 1999 to 2008-9, IQ has declined in France by almost 4 points. What is the cause? Immigration? Dysgenics? A reversal of the Flynn Effect? No doubt that numerous people would attribute the decline in intelligence in France due to MENA and SSA immigration. But is this true?
Lynn and Dutton (2015) show how differing studies show both positive and negative gains in IQ. To prevent further evidence of these negative Flynn gains, they looked to the IQ of France from 1999-2009.
The WAIS-III was standardized in France in 1999 while the WAIS-IV was standardized in 2009. This was a great opportunity to see if the intelligence of the French dropped using the new WAIS-IV. The sample was of 79 people who were of a different sample than that of the broader WAIS-IV French standardization. The average age of the sample was 45, ranging between 30 and 63 years of age. Half of this sample took the WAIS-IV first while the other half took the WAIS-III first to control for practice effects. They used a separate sample to compare the norms of generated by the two standardizes samples.

The above table from the paper, table 3, shows the comparison between the two WAIS tests. Positive ds indicate lower scaled scores on the III in comparison to the IV and thusly higher scores. What these data show is that the IV is harder than the III and IQ declined because the test got ‘tougher’ (because full-scale intelligence declined). As noted above, this phenomenon of decreasing IQ scores has been noticed for about 20 years now. The symbol search showed the smallest decline while there was no change in digit span. The biggest gain was in vocabulary.
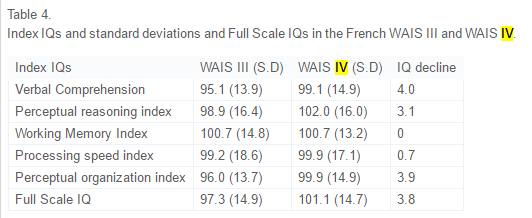
This is pretty shocking. In ten years, verbal comp decreased by 4 points, perceptual reasoning index by 3.1 points, no change in working memory index, processing speed index decreased by .7 points, perceptual organization index decreased by 3.9 and the whole full-scale IQ decreased by 3.8 points. Lynn and Dutton discuss the results:
In addition, the Full Scale IQ on the WAIS IV sample of 79 subjects was calculated based on a comparison with the WAIS IV sample of 876 subjects, which was representative of the French population on key variables such as education and region. The scores of this sample of 876 subjects were set at 100 and a comparison made with the sample of 79 subjects. As can be seen in Table 4, on this basis the IQ of the sample of 79 subjects was 101.1 with an SD of 14.7, where the French norm would be 100 and the SD 15. As such, the smaller sample can be regarded as representative of the French population in terms of intelligence.
So this small sample can be regarded as representative of the French population. Lynn and Dutton say that the digit span showing no increase corroborates findings from another researcher that showed that there was no change in forward or backward digit span in 85 years. They then say:
. . .improvements in the quality of nutrition during the twentieth century made a major contribution to increasing IQs. But it seems improbable that the quality of nutrition declined in recent years in France and in the other economically developed countries in which declining IQs have been reported.
So one possible cause is that nutrition has declined in France. From Dubuisson et al, 2010:
These repeated surveys highlighted the fact that trends in French food habits have moved towards an average European diet at the crossroads between Mediterranean and Northern diets, and that food consumption changes impacted, to a lesser extent, nutritional intake.
It shows that the French diet is in between Med and Nord diets. Really, as Lynn and Dutton asserted, there was no decline in nutritional quality for the French.
Another possible cause is a decrease in quality of schools. Flynn says a part of the reason for the rise in IQ was due to the advent of scientific thinking. However, this is not a good explanation either since school quality seems to not have been affected.
Flynn also talks about the media and its role. Lynn and Dutton say:
However, this would not explain declines in other forms of intelligence and, moreover, it might be argued that the desire and ability to read such literature would be underpinned by general intelligence and so a decline in the consumption of such literature would partly reflect a decline in general intelligence, as vocabulary is a measure of intelligence.
It is also worth noting that, apparently, reading may actually increase general intelligence (post coming on that soon).
Now, finally, the theory we’ve all been waiting for: Is it increased immigration?
Lynn and Dutton state:
This increase has occurred throughout western Europe and a number of studies have shown that immigrants from North Africa and south-west Asia typically have an average IQ of around 85 to 90 (Lynn, 2006, Lynn, 2008, Lynn and Vanhanen, 2012 and Rindermann and Thompson, 2014; for a large meta-analysis see te Nijenhuis, de Jong, Evers, & van der Flier, 2004). This conclusion has been confirmed by Kirkegaard (2013) who has shown that in Denmark the number of non-European immigrants increased from approximately 50,000 in 1980 to 400,000 in 2012 and the IQ of non-European immigrants in 18–19 year old military conscripts was 86.3, relative to 100 for indigenous Danes. These immigrants are likely to have had some impact on reducing the average IQ of the populations, but it is doubtful whether the increase in the number of immigrants with lower IQs has been sufficiently great to have had a major effect.
I personally don’t think that migration into Europe from MENA and SSA countries has been enough to put that big of a dent (over 1/3rd of an SD) in average IQ in France, and Europe as a whole. Since people are coming from areas closer to the equator and have higher rates of children since they are r-selected, could this be why France has seen a decrease in intelligence?
No.
Woodley of Menie and Dunkel (2015) reviewed Lynn and Dutton’s paper and said:
Replacement migration in France involving populations exhibiting lower means of IQ and higher rates of total fertility, such as Algerians, Moroccans, Tunisians and Roma (Čvorić, 2014 and Lynn and Vanhanen, 2012) may be increasing the rate of secular losses at the level of g, consistent with speculations advanced in Dutton and Lynn (2015), however the additional loss in g due to this process is anticipated to be very small. Based on a simulation, Nyborg (2012) estimates that in Denmark, replacement migration may be reducing heritable g by .28 points per decade, which would increase the overall loss in g to 1.51 points per decade ( Woodley of Menie, 2015), this still being only 37.75% of the loss observed in the French cohort.
An Environmental Explanation?
Since we still need an explanation for 62.25 percent of the 3.8 decrease in full-scale IQ other than dysgenic fertility, are there any environmental explanations? Environmental explanations can be anything from child abuse, to poor schooling, to poor nutrition, etc. Was there an increase in any of these or other variables that negatively affect IQ which would explain the 3.8 point decline in IQ?
One of the most likely candidates is nutrition. Lack of certain vitamins, especially in childhood, would prevent the brain from receiving the proper nourishment to grow.
The INCA study took record of food consumption from 2,373 people aged 4 to 92 from a 7-week period and from that they saw which nutrients they were deficient in (Touvier et al 2006). To measure if and how much they were nutrient deficient, they used the Estimated Average Requirement (EAR). The vitamins used were calcium, magnesium, iron, vitamins C, A, B6, and B12, thiamin, riboflavin, niacin, pantothenic acid, and folate. A lot of these have to do with proper brain functioning and ability to reach its full-size potential. For instance like the B vitamins and iron. Being deficient in those nutrients depresses brain size and with it IQ. For instance, being deficient in vitamin B 12 and folate leads to decreased brain size in childhood. The negative effects of being deficient in these nutrients may partially explain some of the 3.8 point decrease in full-scale IQ.
Regarding the prevalence of the aforementioned nutrient deficiencies in these populations, the authors state:
We also calculated daily consumption of 44 food groups by age and gender. This paper shows how the combination of both data sets, i.e., inadequacy and food consumption data, allows a preliminary screening of potential food vehicles in order to optimize fortification. The prevalence of inadequacy was particularly high for the following groups: for calcium, females aged 10-19 years (73.5%) or aged 55-90 years (67.8%), and males aged 15-19 years (62.4%) or aged 65-92 years (65.4%); for magnesium, males aged 15-92 years (71.7%) and females aged 10-90 years (82.5%); for iron, females aged 15-54 years (71.1%); and for vitamin C, females aged 15-54 years (66.2%). Two examples are provided to illustrate the proposed method for the optimization of fortification.
Most vitamins and minerals have positive effects on brain functioning, some more than others, but notice the prevalence of iron defieciency in the females aged 15-54 years (71.1 percent). With the cohort cited by Lynn and Dutton (2015) and Woodley of Menie and Dunkel (2015) being aged 30 to 63 with an average age of 45, the prevalence of iron deficiencies in the INCA study, along with the other deficiencies in the cohort, may partially be responsible for the decline in IQ.
The Flynn Effect
PumpkinPerson describes it well here:
One of the biggest mysteries in psychology is the Flynn Effect; the fact that over the 20th century, people have been performing better and better on IQ tests. Of course, the average IQ in Western countries by definition is always about 100, however because people keep scoring higher every decade, the tests routinely have to be made more difficult and the norms must be regularly updated to keep the mean IQ from rising far above 100.
However, in first-world countries, in the past 20 or so years, it has been in decline, particularly in France. It’s due to a mix of dysgenic fertility and nutrient deficiencies. Since Flynn gains are largely due to advancements in better nutrition, Flynn loses would then be attributed in part to nutrient deficiencies as well as dysgenic fertility.
The cause for the 3.8 decrease in IQ in France is low fertility rates amongst the French population as well as nutrient deficiencies. Clearly, ameliorating this decrease in IQ can be reversed by the K-selected having more children and healthier eating habits. Drops in IQ won’t be attributed to MENA and SSA populations until the future, but for now, the cause for the decrease is the French themselves.
Ethnic Differences in Sleep, Obesity, and Metabolic Syndromes
2300 words
Ethnic differences in the prevalence of obesity occur, majorly in part due to differences in the rates of metabolic syndrome (which is actually a few variables including high blood pressure, high blood sugar which leads to insulin resistance, excess visceral fat around the waist which is the ‘skinny fat‘ phenomenon, and abnormal blood pressure levels) and obesity. Ethnic differences in these variables do, in part, show how the three ethnies differ in rates of obesity. I will discuss the differences between each ethny in regards to metabolic syndrome and sleep and how it leads to the differences in ethnic obesity rates.
Sleep Differences
There is a ‘missing hour of sleep‘ when comparing blacks and whites. On average, blacks get 6.05 hours of sleep while whites get 6.85 hours of sleep. Of course, the same old racism argument comes up, which, if one ‘percieves’ discrimination, I wouldn’t doubt that it would have an effect on sleep due to a rise in cortisol, which affects sleep due to the raised levels making you restless and not able to fall asleep. Insulin levels then rise due to the rise in cortisol, which is the cause of obesity.
Some studies may try to say that racism and other forms of discrimination are a factor, without even thinking of genetic factors. Another study that Frost cites says that duration of deep sleep and duration of stage 2 (light sleep) is correlated correlated in African Americans with perceived discrimination. The authors defined ‘perceived discrimination’ as the extent to which one believes that their ethnic group have been discriminated against by society. Still even when controlling for discrimination, there were still marked differences between blacks and whites and how long they slept.
Frost then talks about how sleep patterns are heritable and cites studies done on Africans in Africa. One study found that there was an hour sleep difference between Ghanaians and Norwegians on the week days and between a quarter to half hour less on weekends. He shows another study showing that Nigerian college students sleep 6.2 hours a day while getting 70-minute naps in the afternoon.
Frost concludes that the African sleep patterns is normal on Africa. Africans are more active during the cooler times of the day and sleep during the bitter periods. Frost says those who evolved in more northerly climes are particularly adapted to a certain sleep pattern with the same holding true for Africans.
However, these sleep patterns in first world countries have negative effects on metabolism and rates of obesity.
Here are some more studies showing that blacks sleep less than whites:
The sleep of African Americans: a comparative review: The researchers found that blacks take longer to fall asleep than whites, report poorer sleep quality, have more light and less deep sleep, and nap more often and longer. This is a huge recipe for risk factors for obesity, and it shows in their demographics.
Unfair Treatment is associated with Poor Sleep in African American and Caucasian Adults: Pittsburgh SleepSCORE Project: This is one of the studies spoken about above that show that discrimination leads to less sleep. Though, it holds for both black and white adults. The researchers conclude:
Taken together, the confluence of perceived unfair treatment as a chronic stressor and poor sleep and the interplay between the two may have critical roles in long-term health problems.
African Genetic Ancestry is Associated with Sleep Depth in Older African Americans: The researchers hypothesized that “racial differences in sleep phenotypes would show an association with objectively measured individual genetic ancestry in AAs.” They conclude that the slow wave sleep may have genetic underpinnings.
Mexican Americans sleep less than do Mexican immigrants. US-born Mexicans are 40 percent more likely to be short sleepers. This is attenuated by environmental factors such as smoking and stress, which shorten the duration of sleep (smoking decreases the Body Set Weight, whereas cortisol along with insulin in tandem increase it).
Also, in this study by Roane et al (2014) looked at the link between sleep disturbances and stress in Mexican Americans (average age 55) and non-‘Hispanic’ whites (average age 66). Mexicans reported higher levels of sleep disturbance (25 percent) compared to whites (17 percent). They conclude that disturbed sleep was positively correlated with depression.
So both blacks and Mexicans sleep less than whites. These differences in sleep between these three ethnies also affect the prevalence of obesity in these populations.
Obesity and Sleep
It’s long been known that poor sleep habits make people fat. This is due to the effects of insulin and cortisol. Increased insulin comes before increased cortisol–increased insulin is the cause for obesity. Sleeping less is linked to obesity. Since, as described above, the three ethnies differ in sleep patterns, the same also holds true for obesity rates (Ogden at al, 2014). The trends are as follows: 67.3% for whites, 75.6% for blacks, and 77.9% for Hispanics. Though, sleep is only one factor involved with obesity.
Getting adequate sleep is extremely important. Not doing so can lead to a myriad of negative health implications:
Sleep is an important modulator of neuroendocrine function and glucose metabolism and sleep loss has been shown to result in metabolic and endocrine alterations, including decreased glucose tolerance, decreased insulin sensitivity, increased evening concentrations of cortisol, increased levels of ghrelin, decreased levels of leptin, and increased hunger and appetite. Recent epidemiological and laboratory evidence confirm previous findings of an association between sleep loss and increased risk of obesity.
So a lack of sleep leads to an increase in ghrelin levels, decreased levels of leptin (the same effects as caloric restriction over time), increased appetite and hunger, increased evening cortisol (which insulin spikes then follow), decreased insulin sensitivity (the cortisol brings it back up and most people are insulin resistant independent of diet), decreased glucose tolerance, etc. We can see that these ethnic differences in sleep, which are partly genetic in nature, can and would have great effects on metabolism, contributing to the ethnic differences in obesity rates.
And from Harvard:
For example, in the Nurses’ Health Study, researchers followed roughly 60,000 women for 16 years, asking them about their weight, sleep habits, diet, and other aspects of their lifestyle. (2) At the start of the study, all of the women were healthy, and none were obese; 16 years later,women who slept 5 hours or less per night had a 15 percent higher risk of becoming obese, compared to women who slept 7 hours per night. Short sleepers also had 30 percent higher risk of gaining 30 pounds over the course of the study, compared to women who got 7 hours of sleep per night.
Damn!! This, pretty much, mirrors the black-white difference. I’d love to see a racial breakdown of this cohort and will keep an eye out for one, but in the meantime, those who were short sleepers had a 30 percent higher risk of gaining 30 pounds over the course of the study in comparison to women who got 7 hours of sleep per night. Blacks are the most likely group to be overweight and obese in the US, and this data from the Nurses Health Study (which tons of data can be drawn from this study) shows one reason why, however the driver is cortisol > insulin > processed carbs > increased insulin > insulin resistance > increased insulin > vicious cycle > obesity. These differences in sleep almost perfectly mirror the ethnic differences in obesity.
There are several possible ways that sleep deprivation could increase the chances of becoming obese. (1) Sleep-deprived people may be too tired to exercise, decreasing the “calories burned” side of the weight-change equation. Or people who don’t get enough sleep may take in more calories than those who do, simply because they are awake longer and have more opportunities to eat; lack of sleep also disrupts the balance of key hormones that control appetite, so sleep-deprived people may be hungrier than those who get enough rest each night.
Ah the old ‘exercise to increase the Calories Out part of the equation’. however, Calories Out does not stay constant. This also rebuts the ‘Eat Less and Move More’ CICO (Calories In/Calories Out) model of obesity, showing that because it doesn’t take insulin into account, it’s doomed to fail.
Speaking of insulin, it’s about time I focused on metabolic syndrome.
Metabolic Syndrome
As I discussed in a previous post, Race, Obesity, Poverty, and IQ, metabolic differences exist between race/ethnicity. ‘Hispanics’ metabolize carbohydrates differently, blacks have a lower fiber intake (increased fiber protects against obesity, another correlate) while whites have a more high fat diet. Contrary to popular belief, dietary fat doesn’t make you fat as it’s the macro that spikes your insulin the least.
Diaz et al (2005) showed that minority populations are more likely to be affected by diabetes mellitus which may be due to less healthy diets and/or genetic factors. Using the National Health and Nutrition Survey for 1999-2000, they analyzed overweight, healthy adults, calculating dietary intake variables and insulin sensitivity by ethnicity. They characterized insulin resistance with fasted insulin, as those who are more likely to become insulin resistant have higher fasted insulin levels (levels taken after waking, with the subject being told not to eat the night before as to get a better reading of fasted insulin levels). Non-‘Hispanic’ whites had higher energy and fat intake while ‘Hispanics’ had higher carb intake with blacks having lower fiber intake. Blacks and ‘Hispanics’ were more likely to have lower insulin sensitivity. However, ‘Hispanics’ were more likely to have lower insulin sensitivity even after controlling for diet, showing that metabolic differences exist between ethnicities that affect carbohydrate metabolism which leads to higher rates of diabetes in those populations.
In ‘Hispanics’, several loci were discovered that play a role in hepatic (relating to the liver) fat content. Along with showing that ‘Hispanics’ have lower insulin (which due to low insulin, blood glucose builds up in the blood stream leading to diabetes) and showing that they metabolize glucose in the liver differently due to differing loci leading to more cases of fatty liver, this shows how and why ‘Hispanics’ have higher rates of Type II Diabetes Mellitus (TIIDM).
Since TIIDM affects Mexican Americans more, better measures to address their differences in carbohydrate metabolism need to be taken. Racial and ethnic differences in TIIDM are as follows:
7.6% of non-Hispanic whites
9.0% of Asian Americans
12.8% of Hispanics
13.2% of non-Hispanic blacks
15.9% of American Indians/Alaskan Natives
Whites eat a higher fat diet, which means a decrease in carbs. Asians eat white rice which spikes blood glucose eliciting a high insulin response leading to TIIDM, ‘Hispanics’, non-‘Hispanic’ blacks, and Indians and Alaskan Natives (I wish they separated Indians and Alaskan Natives as I’m almost positive that Alaskan natives have a lower rate) all eat high carb, low fat, low protein diets. Carbohydrates are a main staple, and since they spike insulin the most, they are the cause for obesity and TIIDM rates in these populations.
Turning my attention over to metabolic syndrome and blacks and whites, we can see that black women with PCOS have an increased risk for cardiovascular disease and metabolic syndrome in comparison to white women with PCOS. The researchers say that after controlling for age and body mass index (BMI) “black women with PCOS had a significantly increased prevalence of low high-density lipoprotein and high glucose. The general CVD risk was significantly increased in black adults with PCOS.” Though, a longitudinal study needs to be carried out to assess the independent impact of race and PCOS with CVD (Cardiovascular Disease).
Blacks have a higher chance to be diagnosed with metabolic syndrome since they are also at increased risk to have elevated blood pressure (hypertension), become obese, and be diabetic. This is due to their diet, which is due to their low IQ (obesity is correlated with intelligence), and different metabolism in comparison to whites.
There are also metabolic differences between race and sex. Fat oxidation is lower in black than white men and in African American men/women and white men/women, they have a lower metabolic rate!!! 24-hour energy expenditure is lower in black women in comparison to white women, whereas physical activity energy expenditure (PAEE) is the same as whites. Contrasted with women, black men had higher PAEE than white men. The authors conclude:
In conclusion, this comparative study of 24-h energy metabolism in African Americans and whites with use of a respiratory chamber not only confirms the previous findings from ventilated-hood studies of a lower resting metabolic rate, but also suggests a lower 24EE in African American women than in white women. Although only marginal ethnic differences in metabolic rate were found in men, African American men seem to have a lower rate of fat oxidation than do white men. The underlying mechanisms for these sex differences and the significance of these findings with respect to the development and maintenance of obesity remains to be investigated in longitudinal studies.
Metabolic Syndrome and Obesity
Race, Obesity, Poverty, and IQ
2100 words
America has a current and ongoing obesity epidemic. Some ethnicities are more likely to be obese or overweight than others due to lower intelligence which means a lack of ability to delay gratification, lack of ability to think into the future, lower funds which translates to eating more refined carbohydrates which means more blood glucose spikes which then leads to obesity as I will show. Insulin has a causal relationship with obesity so those who lack funds to buy healthier food then turn to refined foods high in carbohydrates as they are cheaper and more abundant in low-income neighborhoods.
Adult obesity rate by State (top 5) is: 1) Louisiana (36.2 percent), 2) Alabama (35.6), West Virginia (35.6), and Mississippi (35.6), and 5) Kentucky (34.6) with the 5 least obese States being 51) Colorado (20.2), 49) Hawaii (20.7), 48) Montana (23.6), 47) California (23.2), and 46) Massachusetts (24.3). Notice how the States with higher rates of obesity are in the South and the States with the lower rates are in the North, give or take. The average IQ for these States as follows: Lousiana: 95.3, Alabama: 95.7, West Virginia 98.7, Mississippi 94.2 (lowest IQ State in the country, largest black population at 37 percent), and Kentucky at 99.4. The average IQ for those States is 96.66. The average IQs for the States with the lowest obesity rates are: Colorado 101.6, Hawaii 95.6, Montana 103.4, California 95.5, and Massachusets 104.3 (highest IQ State). The average for these States being 100.08. So there is a 4 point IQ difference between the top 5 States with the highest and lowest percentage of obese people, which goes with the North/South gradient of higher IQ people living in the North and lower IQ people living in the South. Back in 2014, a California real estate group took 500,000 Tweets using a computer algorithm and estimated intelligence based on spelling, grammar, and word choice and found a difference in State by State intelligence. Notice how the further North you go the higher the average intelligence is, which is then correlated with the obesity levels in that State.
With poverty rates by State, we can see how the States in the South have less intelligent people in them which then correlates to the amount of obesity in the State. Though, there are some anomalies. West Virginia and Kentucky have a super majority of whites. This is easily explained by the fact that less intelligent whites live in those States, and since both the poverty rates and obesity rates are high, it follows that the State will be less intelligent than States that have more intelligent people and less obesity.
It is known that intelligence is correlated with obesity at around -.25 (Kanazawa, 2014). The negative correlation between intelligence and obesity means that they are inversely related so, on average, one with higher intelligence has less of a chance of being obese than one with lower intelligence. The States with the lowest IQ people having those with the highest BMIs corroborates this. In America, obesity rates by ethnicity are as follows: 67.3% for whites, 75.6% for blacks, and 77.9% for ‘Hispanics’.
Now that we know the average intelligence rates by State, the percentage of obese by State and the demographics by State, we can get into why obesity rates correlate with intelligence and race.
Diaz et al (2005) showed that minority populations are more likely to be affected by diabetes mellitus which may be due to less healthy diets and/or genetic factors. Using the National Health and Nutrition Survey for 1999-2000, they analyzed overweight, healthy adults, calculating dietary intake variables and insulin sensitivity by ethnicity. They characterized insulin resistance with fasted insulin, as those who are more likely to become insulin resistant have higher fasted insulin levels (levels taken after waking, with the subject being told not to eat the night before as to get a better reading of fasted insulin levels). Non-‘Hispanic’ whites had higher energy and fat intake while ‘Hispanics’ had higher carb intake with blacks having lower fiber intake. Blacks and ‘Hispanics’ were more likely to have lower insulin sensitivity. However, ‘Hispanics’ were more likely to have lower insulin sensitivity even after controlling for diet, showing that metabolic differences exist between ethnicities that affect carbohydrate metabolism which leads to higher rates of diabetes in those populations.
Drewnowski and Specter (2004) showed that 1) the highest rates of obesity are found in populations with the lowest incomes and education (correlated with IQ), 2) an inverse relationship between energy density and energy cost, 3) sweets and fats have higher energy density and are more palatable (food scientists work feverishly in labs to find out different combinations of foods to make them more palatable so we will eat more of them), and 4) poverty and food insecurity are associated with lower food expenditures, lower fruit and vegetable intake, and lower-quality diet. All of these data points show that those who are poor are more likely to be obese due to more energy-dense food being cheaper and fats and sugars being more palatable.
Now that I’ve shown the relationship between race and IQ by state, obesity rates by state, insulin sensitivity by race, and that those in poverty are more likely to be obese, I can now talk about the actual CAUSE of obesity: insulin.
The conventional wisdom is that if you consume more kcal than you expend, you will gain weight, whereas if you consume less than your daily needs you will lose weight. This has been unchallenged for 50 years. Also known as Calories In and Calories Out (CICO), this mantra “eat less and move more!!!” has been bleated over and over with horrendous results. The CICO model only concerns itself with calories and not insulin which is a causal factor in obesity.
In this study, participants in the basal insulin group which received the lowest average insulin dose gained the least average amount of weight at 4.2 pounds. Those on prandial insulin gained the most weight at 12.5 pounds. The intermediate group gained 10.3 pounds. More insulin, more weight gain. Moderate insulin, moderate weight gain. Low insulin, low weight gain.
Researchers compared a standard dose of insulin to tightly control blood sugars in type 1 diabetic patients. At the end of the 6 years, the study proved that intensive control of blood sugars resulted in fewer complications for those patients.
Though, in the high dose group, they gained on average 9.8 pounds more than those in the standard group.
More than 30 percent experienced major weight gain! Prior to the study, both groups were equal in weight. But the only difference was the amount of insulin administered. Were the ones given high levels of insulin all of a sudden more lazy? Were those who gained weight suddenly lacking in willpower? Were they lazier before the study? We’re they more gluttonous? No, no, and no!!
(source)
Finally, Henry et al (1993) took Type II diabetics and started them off with no insulin. They went from 0 units of insulin a day to 100 units at 6 months. As higher rates of insulin were administered, weight rose in the subjects. Insulin was given, people gained weight. A direct causal relationship (see figure above). However, what’s interesting about this study is that the researchers measured the amount of kcal ingested, the number of kcal ingested was reduced to 300 per day. Even as they took in less kcal, they gained 20 pounds! What’s going on here? Well, insulin is being administered and if you know anything about insulin it’s one of the hormones in the body that tells the body to either store fat or not burn it for energy. So what is occurring is the body is ramping down its metabolism in order for the subject to store more fat due to the exogenous insulin administered. Their TDEE dropped to about 1400 kcal, while they should have been losing weight on 1700 kcal! The CICO model predicts they should have lost weight, however, adaptive thermogenesis, better known as metabolic slow down, occurred which dropped the TDEE in order for the body to gain fat, as insulin directly causes obesity by signaling the body to store fat, so the body drops its metabolism in an attempt to do so.
Putting this all together, blacks and ‘Hispanics’ are more likely to be in poverty, have lower intelligence, and have higher rates of obesity and diabetes. Furthermore, blacks are more likely to have metabolic diseases (adaptive thermogenesis aka metabolic slowdown is a metabolic disease) which are related with obesity due to their muscle fiber typing which leads to lower maximal aerobic capacity (less blood and oxygen get around the body). Type II skeletal muscle fibers’ metabolic profile contributes to lower average aerobic capacity in blacks. It also is related to cardiometabolic diseases, in my opinion because they don’t have the muscle fiber typing to run long distances, thus increasing their aerobic capacity and VO2 max.
Due to the diets they consume, which, due to being in poverty and having lower intelligence, they consume more carbohydrates than whites, which jacks their blood glucose levels up and the body then releases insulin to drive the levels glucose in the body down. As insulin levels are spiked, the body becomes insulin resistant due to the low-quality diet. Over time, even a change in diet won’t fix the insulin resistance in the body. This is because since the body is insulin resistant it created more insulin which causes insulin resistance, a vicious cycle.
Poverty, intelligence and race both correlate with obesity, with the main factor being lower intelligence. Since those with lower IQs have a lack of foresight into the future, as well as a lower ability to delay gratification which also correlates with obesity, they cannot resist low-quality, high-carb food the same way one with a higher IQ can. This is seen with the Diaz et al study I linked, showing that whites have higher levels of fat intake, which means lower levels of carbohydrate intake in comparison to blacks and ‘Hispanics’. As I’ve shown, those in poverty (code word for low intelligence) ingest more refined carbohydrates, they have higher levels of obesity due to the constant spiking of their insulin, as I have shown with the 3 aforementioned studies. Since blacks and ‘Hispanics’ have lower levels of intelligence, they have lower levels of income which they then can only afford cheap, refined carbs. This leads to insulin being constantly spiked, and with how Americans eat nowadays (6 times a day, 3 meals and snacks in between), insulin is being spiked constantly with it only dipping down as the body goes into the fasted state while sleeping. This is why these populations are more likely to be obese, because they spike their insulin more. The main factor here, of course, is intelligence.
Another non-CICO cause for obesity is exposure to BPA in the womb. Researchers carried out BPA testing in three differing subjects: 375 babies invitro, (3rd trimester) children aged 3 (n=408) and aged 5 (n=518) (Hoepner, et al, 2016). They measured the children’s bodies as well as measuring body fat levels with bioelectrical impedance scales.Prenatal urinary BPA was positively associated with waist circumference as well as fat mass index, which was sex-specific. When analyzed separately, it was found that there were no associated outcomes in body fat for boys (however it does have an effect on testosterone), but there was for girls (this has to do with early onset puberty as well). They found that after controlling for SES and other environmental factors there was a positive correlation with fat mass index – a measure of body fat mass adjusted for height, body fat percentage and waist circumference. The researchers say that since there was no correlation between BPA and increased obesity, that prenatal exposure to BPA indicates greater vulnerability in that period. The sample was of blacks and Dominicans from New York City. Whites drink less bottled water, which has higher levels of BPA. Blacks and ‘Hispanics’ consume more, and thus have higher levels of obesity.
In conclusion, blacks and ‘Hispanics’ are more likely to be in poverty, have lower intelligence, higher rates of obesity and lower incomes. Due to lower incomes, cheap, refined carbohydrates is what they can afford in bulk as that’s mostly what’s around poor neighborhoods. Ingesting refined carbohydrates more often consistently jacks up blood glucose which the body then releases insulin to lower the levels. Over time, insulin resistance occurs, which then leads to obesity. As I’ve shown, there is a direct causal relationship between the amount of insulin administered and weight gain. With the aforementioned factors with these two populations, we can see how the hormonal theory of obesity fits in perfectly with what we know about these ethnic groups and the obesity rates within them. Since people in poverty gravitate more towards cheap and refined carbohydrates, they’re constantly spiking their insulin which, over time, leads to insulin resistance and obesity.
Muscle Fiber Typing and Race: Redux
I recently blogged on Muscle Fiber Typing, HBD, and Sports. I showed that differences in which race wins at what competition comes down to ancestry, which then correlates with muscle fiber typing. I came across this paper, Black and White race differences in aerobic capacity, muscle fiber type, and their influence on metabolic processes, today which, of course, proved my point on muscle fiber typing.
The authors say that obesity is a known risk factor of cardiometabolic disease (though Blüher 2012 says that up to 30 percent of obese patients are metabolically healthy with insulin sensitivity on the same level as thin individuals) and that cardio can reduce excess adipose tissue (this isn’t true either), maintains weight (maybe) and reduces the risk of obesity (it doesn’t) and cardiometabolic disease (this is true). The two major determinants of aerobic capacity are muscle fiber typing and “the capacity of the cardiorespiratory system to deliver nutrient-rich content to the muscle”. As I said in my previous article on muscle fiber typing, depending on which fibers an individual has determines whether or not they are predisposed to being good at endurance sports (Type I fibers) or being good at explosive sports (Type II fibers). Recent research has shown that blacks fiber typing predisposes them to a lower overall VO2 max.
VO2 max comes down to a strong oxygen support system and the capacity to contract a large number of muscle fibers at once, both of which are largely genetic. Lactic acid makes us tired, the best way to train is to minimize lactic acid production and maximize lactic acid removal during exercise. High-Intensity Interval Training, or HIIT, achieves this. The more O2 consumed during exercise, the less of a reliance there will be on the anaerobic breakdown of CHO to lactic acid.
Along with inadequate exercise, these variables place blacks at an increased risk for obesity as well as other negative metabolic factors in comparison to other races/ethnic groups. The author’s purpose of the review was to show how skeletal muscle fiber typing contributes to obesity in non-“Hispanic” black populations.
The review indicates that the metabolic properties of Type II fibers (reduced oxidative capacity, capillary density, which is a physiological measure that takes a cross-section of muscle and counts the number of blood vessels within. The measurement can be considered an indicator of physical health and is also related to the ability to do strenuous activity) are related to various cardiometabolic diseases.
Since non-“Hispanic” blacks have more Type II fibers on average, they have a lower maximal aerobic capacity. Combined with low Resting Energy Expidenture (REE) and reduced hemoglobin concentration (hemoglobin is a protein in the red blood cells that shuttles oxygen to your tissues and organs and transports carbon dioxide from your organs and tissues back to your lungs), non-“Hispanic” blacks may be predisposed (they are when you look at what the differing skeletal muscle fibers do in the body and if you have a basic understanding of physiology) to a lower maximal aerobic capacity, which contributes to obesity and metabolic disease in the non-“Hispanic” black population.
I have written on ethnicity and obesity last year. In the two racial groups that were tested, American non-“Hispanic” whites and American non-“Hispanic” blacks, what the researchers say holds true.
On the other hand, Kenyans have an average BMI of 21.5. Since we know that a high VO2 max and low BMI are correlated, this is why Kenyans succeed in distance running (along with VO2 max training, which only enhances the genetic effects that are already there).
Moreover, I wrote an article on how Black American Men with More African Ancestry Less Likely to Be Obese. How do we reconcile this with the data I have just written about?
Simple. The population in the study I’m discussing in this article must have had more non-African ancestry than the population that was gathered showing that black American men with more African ancestry are less likely to be obese. The researchers in that study looked at 3,314 genetic markers. They then tested whether sex modifies the association of West African genetic ancestry and body mass index, waist circumference, and waist to hip ratio. Also, they adjusted for income and education as well as examined associations of ancestry with the phenotypes of males and females separately. They conclude that their results suggest that a combination of male gender and West African ancestry is correlated with protection against central obesity and suggests that a portion of the difference in obesity (13.2 percent difference) may be due, in part to genetic factors. The study also suggests that there are specific genetic and physiologic differences in African and European Americans (take that, race-denialists =^) ).
Since both black men and women in America share the same environment, some genetic factors are at play in the differences in obesity rates between the two sexes with more African ancestry for black American men being the main reason.
Finally, I wrote an article on BPA consumption and obesity. The sample was on blacks and Dominicans (they’re black as well) in NYC. It was discovered that babes who were exposed to BPA more in childhood and in the womb had higher chances of being obese. This goes with what the authors of the study I’m citing in this article say. There are numerous environmental factors that pertain to obesity that’s not kcal in/out (which the First Law of Thermodynamics is irrelevant to human physiology). BPA consumption is one of them (as well as a cause for the current and ongoing cucking of Europe). Whites at all age groups drink more tap water. Blacks and ‘Hispanics’ were pretty much even in consumption of bottled water. Bottled water has BPA in the plastic, and since they drink more bottled water, they run the risk of their children being more prone to obesity due to the negative effects of BPA in the human body.
In sum, blacks are more likely to be faster due to their fiber typing, but are also more likely to be obese (in this sample, anyway which I assume was a mix of men and women. I will update this article when I find and read the full paper). They also run a higher risk of having related diseases, most notably due to a lower REE (showing they don’t walk around as much, since too much sitting increases mortality EVEN WITH EXERCISE. So if you have a desk job and don’t do any other physical activity and enjoy living, do more LISS, low-intensity steady-state cardio). These factors also, in part, explain why blacks have higher rates of hypertension (with Sickle Cell Anemia being another cause since when the blood is sickle-shaped, they crowd in the blood vessels causing blockage in the veins which leads to strokes and other diseases). The more the genetic factors that predispose people to obesity are understood (let’s be real here, there ARE genetic correlates with obesity), the better we can help those who suffer from the condition.
Misconceptions on Calories In and Calories Out
2550 words
(To those from “myproana.com”, DO NOT misconstrue what I wrote here. What I wrote here is perfectly understandable. I am NOT saying that “you have no metabolism”. My point is, low kcal dieting CAN and WILL destroy your metabolism. The literature is vast on this subject and it’s waiting for you to read it. Any further confusions, please comment and I will answer your questions.)
“Eat Less and move more!!! That’s how you lose weight!” What people who don’t understand about human metabolism and homeostasis is that when caloric reduction occurs, the body drops the metabolism to match the amount of kilocalories (kcal) it is receiving. Thus, weight will plateau and you will need to further decrease caloric consumption to lose more weight. In this article, I will go through what a calorie is, common misconceptions of Calories In and Calories Out, the reasons for metabolic slow down, the process of thermodynamics that people who don’t understand this research cry out whenever it’s said, and finally starvation experiments that prove metabolic slow down occurs during a decrease in caloric intake and how this metabolic slow down persists after the diet is over.
A kilocalorie is the heat required to raise 1 kilogram of water 1 degree celsius. This definition is used whenever people say ‘Calorie’.
Misconceptions on kcal in/kcal out
- One of the biggest misconceptions people have on Calories In/Calories out is that these variables are independent of each other. However, they are extremely dependent variables. When you decrease Calories In, your body decreases Calories Out. Basically, a 20 percent reduction in kcal will result in a 20 percent reduction in metabolism which the end result ends up being minimal weight loss.
- The next big assumption people have about Calories In and Calories Out is the assumption that the Basal Metabolic Rate (BMR) remains stable. Of course, measuring the caloric intake is simple. However, measuring caloric outtake is a much more complicated process. When ever the Total Daily Energy Expidenture (TDEE) is spoken of, that involves the BMR, thermic effect of food, nonexercise activity thermogenesis (the energy expidenture of all activities sans sports), excess post-exercise consumption (EPOC, a measurably increased rate of oxygen intake following increased oxygen depletion), as well as exercise. the TDEE can increase or decrease by as much as 50 percent depending on caloric intake as well as the aforementioned variables.
- The third misconception people have is that we have conscious control over what we eat. We decide to eat when we are hungry (obviously). But numerous hormonal factors dictate the decision on when to eat or when to stop. We stop eating when we are full, which is hormonally mediated. Like breathing, the regulation of body fat is under automatic control. Just like we don’t have to remind ourselves to breath or remind our heart to beat, we don’t need to remind ourselves to eat. Thus, since hormones control both Calories In and Calories Out, obesity is a hormonal, not caloric disorder.
- The fourth misconception is that fat stores are essentially unregulated. However, every single system in the body is regulated. Height increases come from growth hormones; blood sugar is regulated by insulin, glucagon, and numerous other hormones; sexual maturation is regulated by testosterone and estrogen (as well as the hormone leptin which I will return to later); body temperature is mediated by a thyroid-stimulating hormone, among numerous other biologic factors. Though, we are told that the production of fat cells is unregulated. This is false. The best researched hormone on the storage of fat cells that we know of is the hormone leptin which was discovered in 1994. So if hormones dictate fat gain, obesity is a hormonal, not caloric disorder.
- And the final misconception is that a calorie is a calorie. This implies that the only important variable on weight gain is caloric intake and thus all foods can be reduced to how much caloric energy they have. But a calorie of potatoes doesn’t have the same effect on the body as a calorie of olive oil. The potatoes will increase the blood glucose level, provoking a response from the pancreas, which olive oil will not. Olive oil is immediately transported to the liver and has no chance to induce an insulin response and so there is no increase in insulin or glucose.
All five of these assumptions have been proven false.
[9/21/16 edit:]
Calories in/out implies that during extended caloric restriction no matter the type of kcal (fat, CHO, protein, alcohol, except when alcohol is ingested your body puts fat storage on hold until all alcohol is metabolized from the body. You can see how wiith chronic drinkers as they are obese a lot of the time, with there being a strong link between alcoholism and obesity as there are nunmerous pathways related with each other that lead to excessive eating as well as dependance on alcohol and other drugs) ingested, as long as caloric restriction is continued that weight (fat) loss will be achieved. CICO adherents say that “a calorie is a calorie”, but what’s funny with that statement is that is violates the Second Law of Thermodynamics. Naturally, to CICO adherents since “a calorie is a calorie”, kcal would be restricted from fat since it’s the most calorie dense macro (alcohol coming in second at 7 kcal per gram). By doing this, CHO will be increased, as is recommended by all of the ‘experts’. “Increase CHO, fat leads to CD!!!” This isn’t true, that’s another reason for cutting fat, the supposed ‘increased risk of heart disease”. However, when this occurs, insulin is spiked and when insulin is spiked the body doesn’t use the fat stores for energy it uses the glucose from the carbs.
Putting this all together, let’s say someone’s TDEE is 2000 kcal per day (for a 14k kcal per week average) and they reduce it to 1200 kcal and go on a LFHC diet like is commonly recommended. Insulin remains high and therefore fat cannot be tapped into. This is due to the CICO mantra (which violates the 2nd LoT) “a calorie is a calorie” that leads people to believe that all calories are ‘equal’ in terms of hormonal responses in the body. Let’s take a piece of bread and a teaspoon of olive oil. When you eat the piece of bread, insulin is spiked in response to the glucose from the carbohydrate. When you drink the olive oil, it’s immediately absorbed by the liver eliciting no insulin spike. Clearly, with a long term LFHC diet, this will consistently occur and the body will be continuously using CHO for energy and not the fat stores as insulin is continuously spiked in the body. Insulin either tells the body to store fat or not burn it for energy. Eventually, over time, this leads to insulin resistance (however, insulin resistance may precede obesity and diabetes) and more metabolic problems amongst a myriad of other variables.
As kcal is reduced to 1200 per day, the body is forced to match its metabolism to what your intaking as it can’t get energy from anywhere else since “a calorie is a calorie”. This happens during any calorie restricted diet and is why diets are doomed to fail. This same thing happened with The Biggest Loser contestants. Notice how The First Law of Thermodynamics isn’t broken? It’s irrelevant.
See how the mantra “a calorie is a calorie” violates the Second law of thermodynamics and fails because the CICO model doesn’t take insulin into the equation, which is a causal factor with obesity?
[End edit]
The correlation between weight gain and caloric consumption has recently been discovered. Ladabaum, et al (2014) examined trends in obesity from 1988 to 2010. The trends they observed were: obesity, abdominal obesity, physical activity and caloric consumption in US adults. They discovered that the obesity rate increased at .37 percent per year while caloric intake remained virtually the same.
The Law of Thermodynamics
The first law of thermodynamics states that energy can not be created nor destroyed in an isolated system (this is important). People often invoke the LoT to support the Calories In and Calories Out model. Dr. Jules Hirsch says in this NYT article:
There is an inflexible law of physics – energy taken in must exactly equal the number of calories leaving the system when fat storage is unchanged. Calories leave the system when food is used to fuel the body. To lower fat content – reduce obesity – one must reduce calories taken in, or increase output by increasing activity, or both. This is true whether the calories come from pumpkins or peanuts or pâtés de foie gras.
To quote MD Jason Fung, author of The Obesity Code:
But thermodynamics, a law of physics, has minimal relevance to human biology for the simple reason that the human body is not an isolated system. Energy is constantly entering and leaving. In fact, the very act we are most concerned about-eating-puts energy into the system. Food energy is also excreted from the system in the form of stool Having studied a full year of thermodynamics in university, I can assure you that neither calories nor weight gain were mentioned even a single time. (Fung, 2016: 33)
We assume with the model of the calorie-balancing scale that fat gain or fat loss is unregulated, however, no system in the body is unregulated like that. Hormones tightly regulate all bodily functions. Body fat is no exception. The body actually has numerous ways in which to control body fat. Distribution of energy is the problem with fat accumulation. Too much energy is diverted to fat creation as opposed to body-heat production. Most of this is under automatic control, except exercise (which even then, there is a genetic basis for motivated exercise). We can’t decide whether or not to allocate calories to nail production or increase stroke volume. These metabolic processes are almost impossible to measure, and thus most assume that it’s relatively constant. Particularly, Calories In is not assumed to change in response to Calories Out. We assume these are independent variables. Reducing calories in only works if calories out remains constant. However what we find is that a sudden reduction of Calories In leads to a similar reduction of Calories Out and no weight is lost as the body balances its energy budget.
Starvation experiments
In 1919, a landmark study was carried out by Francis Benedict. The volunteers in the study agreed to a semi-starvation diet ranging from 1400 to 2100 kcal, approximately 30 percent of the subject’s bodyweight. The question was whether or not decreased caloric intake lead to a decrease in metabolism. The results were shocking.
The subjects experienced a 30 percent reduction in metabolism, with their initial caloric expidenture being 3000 kcal dropping to 1950 kcal. A 30 percent reduction in kcal resulted in a 30 percent decrease in metabolism. The First Law of Thermodynamics is not broken.
Towards the end of WWII, Dr. Ancel Keys wanted to improve understanding of starvation and better help Europe after the War. With an average height of 5 feet 10 inches and an average weight of 153 pounds, these were normal men, which Dr. Keys wanted to see the effects of a semi-starvation diet on those with a normal weight. For the first three months of the study, they were given slightly over 3000 kcal. Though over the next six months, they were given 1570 kcal. Eventually, some men were decreased to less than 1000 kcal a day. They were given a diet of foods high in carbs and low to no animal meat as that was the condition in Europe at the time. Moreover, they also had to walk 22 miles a week as exercise. Again, the results were shocking.
Dr. Keys showed that they had a 40 percent decrease in metabolic rate. The body decreased its metabolism to match the amount of calories consumed. They showed a 20 percent decrease in strength, a significant decrease in heart rate (55 to 35 beats per minute), stroke volume decreased by 20 percent, body temperature dropped to 95.8 degrees Fahrenheit (which makes sense since less caloric consumption means less energy for the body to convert into heat), physical endurance dropped by half, blood pressure dropped, they became tired and dizzy and finally their hair and nails grew extremely brittle. They couldn’t stop thinking about food. Some of them wrote cookbooks, others dreamed about food. They became obsessed with eating. All of these causes go directly back to decreased caloric consumption as the amount of heat produced by the body decreased due to an increase in caloric consumption. In sum, the body responds to a decrease in caloric intake by dropping metabolism.
Metabolic slow down
Recent data has come out on decreased energy expidenture due to dieting from contestants on the show The Biggest Loser. The contestants were followed for six years after the show ended. Fothergill, et al (2016) showed that after six years, most contestants gained back the original weight they lost, but their metabolism was still decreased by 600 kcal.
The mean metabolic adaptation had increased to 500 kcal per day, which explains why RMR remained 700 kcal per day below the baseline level despite a 90 lb body weight regain. The researchers even said that this large metabolic difference couldn’t be explained by the different calirometer used at the end of the six year period.
Substantial weight loss induces biological changes that promote weight gain.
Moreover, after a period of dieting, your brain panics and thinks it’s starving. During this time, the the production of the hunger hormone ghrelin increases. Levels of this hormone increase right before a meal and steadily decrease after. This is one of the many hormones that control when we’re hungry and this is one of the many reasons why diets fail and do not work long term.
Our bodies have homeostatic mechanisms that cause us to gain back or lose weight whenever caloric consumption is increased or decreased. The main cause is the body weight set-point which I will cover in a future article.
And a quote from Sandra Aamodt’s book “Why Diets Make Us Fat“:
“Leibel finds that metabolic suppression persists in dieters who have kept weight off for one to six years, so he scoffs at claims that the successful weight loss story disproves his ideas. “If you talk to people who’ve done it – not the studies, but people who actually manage to lose weight and keep it off – they’ll tell you what I’m telling you,” he says: that the only way to achieve this goal was to allow themselves to be hungry all the time while increasing their physical activity substantially. Indeed, his point is supported by data on the eating and exercise habits of people listed in the National Weight Control Registry, who have lost at least thirty pounds and kept it off for one year. A calorie calculator says that Dennis Asbury should have needed 2,100 calories to maintain his weight at 150 pounds, but instead he found that he needed to eat 400 to 500 calories less than that. Such metabolic suppression is the difference between being within the defended range and being below it. Many people blame others for eating too much or exercising too little, assuming incorrectly that both are under voluntary control, but it’s much harder to justify holding people responsible for diet-induced changes in the way the body burns energy.” (Aamodt, 2016, pg. 68)
Conclusion
The fact of the matter is, kcal in and out is completely misunderstood due to a non-understanding of human metabolism. As we decrease our caloric intake, our body adjusts its metabolism down to match the amount of kcal we are currently consuming. This is why Calories In and Calories Out does not tell the whole story. Our body constantly fights to maintain what is normal, its set-point. When thrown out of what the brain considers ‘normal’ the brain through the hypothalamus does whatever it can to get us back to its set-point. Thus, obesity is a hormonal, not a caloric disorder.
Science Proves It: Fat-shaming Doesn’t Work
2250 words
Milo Yiannopoulos published an article yesterday saying that “fat-shaming works”. It’s clear that the few papers he cites he didn’t read correctly while disregarding the other studies stating the opposite saying “there is only one serious study”. There is a growing body of research that says otherwise.
He first claims that with the knowledge of what he is going to show will have you armed with the facts so that you can hurl all the insults you want at fat people and genuinely be helping them. This is objectively wrong.
In the study he’s citing, the researchers used a quantitative analysis using semi-structured interview data (which is used when subjects are seen only one time and are instructed by the researchers what the guidelines of the experiment will be in order to get the reliable, comparable, and quality data) on 40 adolescents who lost at least 10 pounds and maintained their weight loss for at least a year. This guideline came from Wing and Hill (2001) who say that maintaining a 10 percent weight loss for one year is successful maintenance. He claims that the abstract says that bullying by the peer group induces weight loss. Though, it’s clear that he didn’t read the abstract correctly because it says:
In contrast to existing literature, our findings suggest that primary motivating factors for adolescent weight loss may be intrinsic (e.g., desire for better health, desire to improve self-worth) rather than extrinsic. In addition, life transitions (e.g., transition to high school) were identified as substantial motivators for weight-related behavior change. Peer and parental encouragement and instrumental support were widely endorsed as central to success. The most commonly endorsed weight loss maintenance strategies included attending to dietary intake and physical activity levels, and making self-corrections when necessary.
Peer encouragement and instrumental support were two variables that are the keys to success in childhood weight loss maintenance, not fat-shaming as he claims.
The same study found that obese people were more likely to lose weight around “life transitions,” like starting high school. In other words, people start to worry about how others will see them, especially when they need to make a good first impression. Fear of social judgement is key. So keep judging them.
The study didn’t find that at all. In fact, it found the opposite.
According to a new study, while most teens’ weight loss attempts don’t work, the ones who do lose weight successfully, quite simply, do it for themselves, rather than to please their (bullying) peers or (over-pressuring) parents.
He then cites a paper from the UCLA stating that social pressure on the obese (fat-shaming) will lead to positive changes. Some of the pressures referenced are:
If you are overweight or obese, are you pleased with the way you look?
Are you happy that your added weight has made many ordinary activities, such as walking up a long flight of stairs, harder?
The average fat person would say no to the first two.
Are you pleased when your obese children are called “fatty” or otherwise teased at school?
Fair or not, do you know that many people look down upon those excessively overweight or obese, often in fact discriminating against them and making fun of them or calling them lazy and lacking in self-control?
Self-control has a genetic component.In a 30 year follow-up to the Marshmallow Experiment, those who lacked self-control during pre-school had a higher chance of becoming obese 30 years later. Analyzing self-reported heights and weights of those who participated in the follow-up (n=164, 57 percent women), the researchers found that the duration of the delay on the gratification task accounted for 4 percent of the variance in BMI between the subjects, which, according to the researchers, was responsible for a significant portion of the variation in the subjects. The researchers also found that each additional minute they delayed gratification that there was a .2 reduction in BMI.
Why? Because people change their health and dietary habits to mimic that of their friends and loved ones, especially if they spend lots of time around them. Peer pressure encourages people to look like the people they admire and whose company they enjoy. Unless there’s a more powerful source of social pressure (say, fat shaming) from the rest of society, of course.
Not even thinking of the genetic component. The increase in similarity relative to strangers is on the level of 4th cousins. Thus, since ‘dietary habits are mimicked by friends and family’, what’s really going on is genotypic matching and that, not socialization, is the cause for friends and family mimicking diets.
There is only one serious study, from University College London, that suggests fat-shaming doesn’t work, and it’s hopelessly flawed. Firstly, it’s based on survey data — relying on fat people to be honest about their weight and diets. Pardon the pun, but … fat chance!
Moreover, the study defines “weight discrimination” much like feminists define “misogyny,” extending it to a dubiously wide range of behaviours, including “being treated poorly in shops.” The study also takes survey answers from 50-year olds and tries to apply them to all adults. But in what world do 20-year-olds behave the same way as older people?
The paper he cites, Perceived Weight Discrimination and Changes in Weight, Waist Circumference, and Weight Status, does say what he claims. However, the researchers do say that due to having a sample of people aged 50 and older that it wasn’t applicable to younger populations (as well as other ethnicities, this sample being 97.9 percent white). (Which you can tell he did not read, and if he did he omitted this section.)
The researchers found that 5.1 percent of the participants reported being discriminated on the basis of their weight. They discovered that those who experienced weight discrimination were more likely to engage in behaviors that promoted weight gain, and were more likely to see an increase in weight and waist circumference. Also observed, was that weight discrimination was a factor in early onset obesity.
Present research indicates that in addition to poorer mental health outcomes, weight discrimination has implications for obesity. Rather than motivating people to lose weight, weight discrimination increases the risk for obesity. Sutin and Terraciano (2013) conclude that though fat shaming is thought to have a positive effect on weight loss and maintenance, it is, in reality, associated with maintenance of obesity. Also seen in this sample of over 6,000 people was that those who experienced weight discrimination were 2.5 times more likely to become obese in the next few years.Further, obese subjects were 3.2 times as likely to remain obese over the next few years.
Sutin et al (2014) also showed how weight discrimination can lead to “poor subjective health, greater disease burden, lower life satisfaction and greater loneliness at both assessments and with declines in health across the four years”.
Puhl and Heuer (2010) says that weight discrimination is not a tool for obesity prevention and that stigmatization of the obese leads to threatened health, the generation of health disparities and, most importantly, it interferes with effective treatments.
Tomiyama (2014) showed that any type of fat shaming leads to an increase in weight and caloric consumption.
Shvey, Puhl, and Brownell (2011) found in a sample of 73 overweight women, that those who watched a video in which weight discrimination occurred ate 3 times as many calories than those who did not see the video. The authors conclude that despite people claiming that weight discrimination works for weight loss, the results of the study showed that it leads to overeating, which directly challenges the (wrong) perception on weight discrimination being positive for weight loss.
Participants were from an older population, in which weight change and experiences of weight discrimination may differ relative to younger populations so findings cannot be assumed to generalize
Puhl and King (2013) show that weight discrimination and bullying during childhood can lead to “depression, anxiety, low self-esteem, body dissatisfaction, suicidal ideation, poor academic performance, lower physical activity, maladaptive eating behaviors, and avoidance of health care.”
I expect we’ll see more of these pseudo-studies, and not just because academics tend to be lefties. Like climate scientists before them, I suspect a substantial number of “fat researchers” will simply choose to follow the political winds, and the grant money that follows them, rather than seeking the truth.
He is denying the negative implications of fat-shaming, disregarding the ‘one study’ (or so he claims) that shows the opposite of what he cited (which he didn’t read fully). I also like how these studies are called ‘pseudo-studies’ when the conclusion that’s found is a conclusion he doesn’t like. Really objective journalism there.
The reverse is also true. Just being around attractive women raises a man’s testosterone.
The researchers say that talking with a beautiful woman for five minutes led to 14 percent increase in testosterone and a 48 percent increase in cortisol, the anti-stress hormone.
Of course, this has its grounds in evolution. When two people are attracted to each other, they begin to mimic each other’s movements and using the same body language unconsciously. The researchers he cited concluded that “women may release steroid hormones to facilitate courtship interactions with high-value men“. This, of course, has an evolutionary basis. Women seek the best mate that will be able to provide the most for them. Men and women who are more attractive are also more intelligent on average with the reverse holding true for fat people, who are uglier and less intelligent on average.
Though it would be to un-PC to conduct an experiment proving it, it stands to reason that looking at fat, ugly people depresses testosterone. This is certainly how any red-blooded man feels when looking at a hamplanet.
Depressed testosterone is associated with many negative health outcomes, and thus the mere presence of fat people is actively harming the population’s health — particularly men’s, since we’re more visual. We ban public smoking based on the minuscule effects of “passive” intake, so why aren’t the same lefty, public-health aware politicians clamouring for a ban on fat people being seen in public?
A study conducted on people’s hormonal response to the obese and overweight may indeed show a decrease in testosterone and cortisol. Though, these hormonal responses are temporary, which he doesn’t say.
Instead, the same lefties who want to stop us having fags or drinking too much in public (and even alcoholics and chain smokers are healthier than the obese) are the same ones urging the authorities to treat “fat-shaming” as a crime and investigate it. Insane!
There are, contrary to popular belief, obese people who are metabolically healthy. Blüher (2012) reviewed the data on obese patients and found that 30 percent of them were metabolically healthy with the obese patients having similar levels of insulin sensitivity similar to lean individuals.
Moreover, new research has found that having a BMI of 27 leads to a decrease in mortality. In a huge study of over 120,000 people, the researchers gathered people from Copenhagen, Denmark, recruiting people from 1976 to 2013. They were then separately compared to those who were recruited in the 70s, 90s, and 00s. Surprisingly, the BMI linked with the lowest risk of having died from any cause was 23.7 in the 70s, 24.6 in the 90s, and 27 from 2003-2013. Due to the results of this study, the researchers are arguing that BMI categories may need adjusting.
As shown in that 2014 study, young people in particular are concerned about what their peers think about them, especially when they start high school. That’s why it’s so critical to let them know that their instincts are correct, and that they can’t be “healthy at any size.”
If you can be unhealthy at any size, why can’t you be ‘healthy at any size’? As I’ve shown, those with a BMI of 27, on average, are metabolically similar to those with to those with lower BMIs. Since, in the study previously cited, BMI increased while mortality decreased, technological advancements in caring for diseases, such as Diabetes Mellitus, improved, this is one possible explanation for this.
Those with a BMI under 25 may still suffer from negative effects, the same as obese people. They may suffer from metabolic syndrome, high triglycerides, low HDL, small LDL particles, high blood sugar and high insulin. Those who are skinny fat need to worry more about their vital organs, as the fat deposits they carry are white fat which is wrapped around the vital organs in the body. These are some of the reasons why being skinny fat can be more dangerous than being obese or overweight: they think that because their BMI is in the ‘normal range’ that they’re fine and healthy. Clearly, sometimes even being ‘underlean’ can have serious consequences worse than obesity.
Then he brings up smoke shaming and bills being passed to stop smokers from smoking in certain public areas lead to a decrease in smoking, so fat shaming makes sense in that manner.
Except it doesn’t.
Humans need to eat, we don’t need to smoke. Moreover, since the rising rates in obesity coincide with the increase in height, it has been argued by some researchers that having an obese population is just a natural progression of first world societies.
Fat shaming doesn’t work. It, ironically, makes the problem worse. The physiological components involved with eating are a factor as well. It is known that the brain scans of the obese and those addicted to cocaine mirror each other. With this knowledge of food changing the brain, we can think of other avenues that do not involve shaming people for their weight, which increases the problem we all hate.
Dysgenic Fertility and America’s Obesity Crisis
1050 words
The dysgenic trend currently occurring in America has implications for obesity as well. Since intelligence is negatively correlated with obesity, as America’s average IQ decreases, the rates of obesity in our country will increase. This is due to the high correlation between intelligence and obesity. As we continue to allow unfettered immigration into America, the average IQ of the country will decrease, while the amount of people that are overweight and obese will increase.
The ethnic differences in obesity rates lead more credence to what I am saying. As the demographics shift, more people will be overweight or obese due to having a lower IQ. Whites, too, are experiencing this dysgenic effect, as intelligent people of all ethnicities are not reproducing. As more and more genetically less fit individuals continue to have a higher rate of reproduction in comparison to intelligent individuals, this crisis will continue to persist.
Those with lower intelligence have less of an ability to delay gratification, which has a strong genetic component. As more people breed who cannot delay their gratification, the rates of obesity will increase in the country. Of course, the lack of ability to delay gratification comes with a lowered IQ. This is what we see in regards to sex. Those with higher IQs lose their virginities at a later age in comparison to those with lower IQs. Along with the data from Kanazawa that shows that more intelligent people have a lower BMI than those with lower intelligence, this study gives more credence to the theory that those with higher levels of intelligence can better delay their gratification.
JayMan says that there is evidence for an increased genetic load for those with lower IQs, which we can then reason that this also leads to a higher prevalence for obesity in low IQ populations. JayMan then says that many of the genes found to influence obesity seem to operate in the brain and that they have a pleiotropic effect, meaning that multiple genes affect one or more traits. With the increased genetic load comes with an increased chance to have a lower IQ and become obese, as these two things correlate with the lack of ability to delay gratification.
Of course, these problems persist due to modern medicine. With the advent of better medicine, it allowed us to beat diseases that formerly would have been devastating to the population at large. This led to an increase of alleles with negative effects in the population that continue to pass down through the generations. Along with these advances in medical technology, welfare and other government-funded programs also enable those that are less genetically fit. Since intelligence is correlated with ability to care for offspring, as well as r- and K-selected traits, those with lower intelligence exhibit more r-selected traits. This is why America is facing a dysgenic fertility crisis. Welfare props up those with less intelligence, giving them more incentives to breed. They then breed more low IQ children who then will live off of the government. This vicious cycle then continues unfettered due to how America’s dysgenic welfare structure is implemented.
Before the advent of modern technology, those who were less genetically fit didn’t survive to pass on their genes. But, in the modern day with all of our superior technology, this allows the less intelligent to breed when in the past they would have been selected out of the gene pool due to being less biologically fit.
Another variable that is involved with the dysgenic fertility of America is Mexican immigration. With the influx of illegal (and legal) peoples from the South of the Border, this is having both dysgenic effect on both the average intelligence of our country along with the average BMI. The average BMI for the average American male is 28.6. In the 1950s, 10 percent of American adults were obese compared to 35 percent of American adults today. Now, this has to do with ability to access food, as well as the effect of the media on children has a huge effect on obesity, due in part to not getting a full nights sleep, as that is correlated with obesity. However, an increase in genetic load, which also comes with a decrease in intelligence, has a lot to do with this as well. The increase in the BMI of the average American has to do with immigration as well. The rates of obesity for different ethnicities in America are as follows: 67.3% for whites, 75.6% for blacks, and 77.9% for ‘Hispanics’. So of course, with more immigration from the South of the Border, the average IQ for America is decreasing while obesity rates are increasing, due mostly to this illegal immigration.
Height and intelligence are both correlated. Ever since the advent of the industrial revolution, we have had an excess surplus of food. As Gina Kolata says in her book Rethinking Thin, an increase in obesity is inevitable. She says this since the increase in genetic height and IQ has occurred, so the increase in obesity follows with it. We need to influence those with higher IQs to have more children. Further, we also need to restrict immigration to only high-skilled immigrants (only when necessary) to reverse this trend that has been occurring since the 1960s. Though, with higher levels of intelligence one can forgo their urges and live a healthier lifestyle due to having higher cognition which leads to a better ability to delay gratification than one with lower intelligence.
Those with higher IQs make better choices on what to eat than those with lower IQs. This is shown in the BMIs of the intelligent and non-intelligent population. As more and more people with lower genotypic IQ come into the country, the quality of life will decrease as will the average intelligence of the country. In turn, the BMI of the average American will increase along with the decrease of our country’s average intelligence. To ameliorate this, we need to have extremely stringent criteria on who we allow into the country. An IQ test, to start, would be a good idea. As those with higher intelligence have less of a genetic load and have less of a chance of becoming obese than one with a lower IQ, the current dysgenic effect that this unfettered immigration is having on America can be lessened.
How to Use Current Knowledge to Effectively Treat the Symptoms of PWS Patients
2550 words
Abstract
Researchers have tried to manage those with Prader-Willi’s Syndrome for multiple decades. Though they have greatly curbed some of the implications of the disease, there are still numerous ways in which we can better use our knowledge of how the disease manifests in order to better help those suffering from PWS. Looking at research into how the extra chromosome 15 is linked to low IQ; IQ and its relationship to obesity; how the ability to delay gratification leads to obesity; growth hormone treatment to better treat low muscle mass and higher body fat; and finally using reinforcement theory to punish a response, where doing so will greatly diminish the probability of that response occurring again in the future; all of these factors can be used in conjunction to better mitigate problems from the disease. By examining all of these variables and thinking of better ways to handle them, we can then think of other, better ways to manage those with PWS. In doing so, we can better increase the quality of life of those suffering from PWS, as well as have less of a strain on healthcare workers who care for them. With new advances in technology with CRISPR Cas9, we can then edit the genomes and chromosomes of those suffering from this disease.
How to Use Current Knowledge to Effectively Treat and Manage the Symptoms of PWS Patients
How can we use the research on chromosomal differences, research on their IQ differences and their lack of ability to delay gratification that, in turn, would help those individuals with the disease? Seventy percent of PWS cases are attributed to the deletion of chromosome 15 (Ledbetter et al, 1981). Maternal uniparental disomy, which involves receiving an extra chromosome 15 from the mother, is yet another cause of PWS (Wang, 2004).
Whittington, Holland and Webb (2009) found that there was variation between families in deletion of chromosome 15. They found that the PWS and sibling IQ correlation was .3, a modest correlation. What was also noticed was that there were subtype differences which manifested itself in the familial differences in IQ. As they expected, the correlation with normal siblings and those with PWS was .5 in those who suffered from PWS due to unilateral disomy. But in the second subset (the chromosomal deletion subset), the correlation was negative at -0.07. Their research shows great promise in the role of chromosome 15 and IQ. They end up concluding that there needs to be an explanation for the small genetic differences between them. How can we use these differences in IQ to help people with PWS and what does this suggest for other symptoms of their disease?
Kanazawa (2014), reviewed the data on the research between obesity and IQ. What he found was that those studies that concluded that obesity causes lowered intelligence only observed cross-sectional studies. Longitudinal studies that looked into the link between obesity and intelligence found that those who had low IQs since childhood then became obese later in life and that obesity does not lead to low IQ. The average IQ for an individual suffering from PWS is 65 (Butler, Lee and Whitman 2006, p. 13), so that is one reason they have a tendency to be obese. He states that those with IQs below 74 gained 5.19 BMI points, whereas those with IQs over above 126 gained 3.73 BMI points in 22 years, which is a statistically significant difference. Also noted, was that those at age 7 who had IQs above 125 had a 13.5 percent chance of being obese at age 51, whereas those with IQs below 74 at age 7 had a 31.9 percent chance of being obese. This data makes it clear: low IQ is correlated with obesity, so we, therefore, need to find sufficient measures to help those with lower IQs who also suffer from PWS to better maintain their good health. Since we can better identify those PWS individuals who have lower IQs based on how they got the disease, we can then show them more attention in an effort to have them manage their gratification better. Moreover, the lack of ability to delay gratification is also correlated with low IQ (Mischel, Ebbeson, and Zeiss, 1972).
Schlam et al. (2013) observed in a follow-up study to the Marshmallow Experiment that found in a longitudinal study of individuals they found forty years later from the original Marshmallow Experiment, due to inability to delay gratification forty years previously, that was one cause of becoming obese forty years later. Due to PWS sufferers having lower average IQs, and, therefore, a lack of ability to delay their gratification, this is direct evidence that those PWS sufferers with low IQs need more stringent measures to be taken on them, which would then be helpful to those individuals who have a hard time delaying their gratification, which is partially caused by the drop in IQ due to the additional chromosome 15. We can see how those with PWS act; they want their gratification now and do not want to wait for it. This is why, when unsupervised, that those with PWS gorge on the food they understand they should not have, but do so, nevertheless, since their low IQ is correlated with lack of ability to delay gratification, which manifests itself in their obesity. We clearly need to find better methods in which to help those with low ability to delay gratification, which would strongly help those suffering from PWS.
Dykens et al (1997) note that those with PWS have hyperphagia, which correlates with their insatiable want for food. They state that the lack of fullness is due to an altered function of the hypothalamus, which is the part of the brain that is in control of feelings of satiety. Certain States gave restrictions to homes that take care of those with PWS and have come under fire because of this, mainly due to human rights violations. We must ask, then, should we limit their access to food if it will prolong their lives? Will doing so inhibit their freedom to do as they choose? PWS sufferers also have coronary heart problems; one could argue that given their free ability to choose what they want to do unfettered will lead to premature death due to obesity-related complications. Does their disease truly not allow them to learn the consequences of their behavior? Do they have the intellect to really understand the consequences of their actions of consuming too much food? There is no established or known way to control those with insatiable eating habits due to hyperphagia. So would the best course of action to take with those with PWS actually be to constantly monitor them and to lock access to easily attainable food? My answer is yes, however, there is a clear fine line in whether restricting access to food and constantly monitoring those with PWS infringes on their human rights, or that doing so actually will help them live better, healthier lives since they would have the constant supervision around them to better control their out of control eating habits. When negative actions occur, one idea that can be shown to them is constant positive reinforcement so that they may be better able to understand that what they are doing is harmful to their bodies. We can then use positive reinforcement when they do reach a healthy weight, so, in turn, they will have a higher chance of keeping a healthy weight. They may reap the benefits of positive reinforcement, and stick more closely to their program, and therefore, stay healthy.
The hormone ghrelin is secreted from the hypothalamus. With an altered hypothalamus, this would cause ghrelin levels to overload; then the individual suffering from PWS would feel the need to insatiably gorge on food due to this chemical imbalance in the brain. Ghrelin increased feeding in rats and ghrelin is the physiological mediator of feeding and probably has a function in growth regulation by stimulating feeding and release of growth hormone (Nakazato et al, 2001). There is a correlation between want of food, ghrelin release and growth hormone production. By attempting to mediate these variables, those who suffer from PWS will be able to better control their eating habits through positive reinforcement and better, more sustainable habits. Since whenever we eat we get a release of ghrelin that makes us hungry, people pretty much set their own eating times by eating multiple times a day. This affects PWS patients the same way. They can’t stop eating, due in part to constantly eating which constantly releases ghrelin in their body.
PWS sufferers have low muscle tone and, conversely, more body fat. Growth hormones may be a valid way of alleviating that problem, which in turn will give them a slightly higher resting metabolic rate so that they may burn slightly more calories, in an effort to stay healthier. Growth hormone therapy is great for those with PWS though they are largely inactive and lead a sedentary lifestyle, the growth hormone will allow them to have less body fat and more muscle mass. As noted earlier in my paper, those suffering from PWS have altered function in their hypothalamus, which is also where growth hormone is secreted. Aycan and Bas (2014) state that treatment with growth hormones should be strongly considered for those with PWS.
PWS sufferers are also quick to anger, which can be correlated with their sub-average IQ. They may, for instance, become irate at the fact that they do not have constant access to food, and may turn to emotional, angry and infantile outbursts in an attempt to receive what they want. This is one way that it’s tricky to treat those with the disease. How do you tell an individual with PWS who wants something “No”? Measures should be taken to show those with the disease what they are doing to their bodies in the simplest way possible as to better get the point across to them. We can help those sufferers of PWS who are quick to anger with by allowing them to discern between right and wrong ways to handle times when they don’t get what they want with positive reinforcement.
Since those who suffer from PWS have behavioral problems, there are better measures we can take to assure that they don’t have their violent outbursts. When positive reinforcement is consistently shown to an individual who has PWS, he will have more success with his program. When they do something wrong, they can then be shown positive reinforcement, and through being shown positive things with reinforcement theory, they can better learn that certain actions they take are dangerous and shouldn’t be done again, as Rushton (1980) states: “If one rewards a response, it will increase the probability of the future occurrence of that response. If one punishes a response, it will decrease the future probability of the occurrence of that response.” (p. 90).
Discussion
In this paper, I have presented causes for PWS as well as effective ways to manage the disease. To look at how IQ affects individuals in regards to obesity and because it is highly correlated with other measures as well, we can then better help those with the disease. By seeing which individuals have the parental disomy version of PWS, we can then monitor them and give them better care because of their lowered IQ and make sure they stay at a healthy weight. One of the best measures to take is to heavily restrict food, i.e., make sure ability to access food at all hours of the day is restricted along with constant supervision. Though, there are rights groups fighting for them saying that their human rights are being infringed on. In allowing them to have free reign over what, how and when they eat, they will gorge themselves to obesity, as well as lead themselves to horrible complications that come along with increased food consumption. When one is caught consuming food he or she shouldn’t be consuming, punishing them and letting them understand that the behavior they took was wrong will lead to better choices and outcomes from those choices, due in part to the main facet of reinforcement theory, that punishing a response will lead to a reduced outcome in that response that was punished happening in the future. Also, with the advent of CRISPR Cas9, we will be able to edit genomes, and therefore, eventually, put an end to PWS. It will enable us to fix the chromosomal deletion and uniparental disomy, which will eradicate this disease.
Conclusion
There are better, more helpful ways in which to help those suffering from PWS. By identifying and attempting to correct these abnormalities, those who suffer from the disease can, therefore, have a better quality of life due in part to the extra measures taken. By understanding that their lower average IQs lead to a lot of the problems associated with the disease, we can better structure methods for them to keep on a healthy track and reinforce positive behavior through reinforcement theory. Since obesity is correlated highly with low IQ, we can, therefore, use this information to better help those who suffer from PWS that have low IQs. Locking up food instead of providing free access, as well as understanding they do not have the ability to delay gratification, would be a big start to find better ways to treat sufferers of PWS. Treating negative actions with positive reinforcement through reinforcement theory will lead to better and increased prosocial behavior. It’s been shown that if you punish a response, then it will decrease the future probability of that response occurring. The advent of CRISPR Cas9 will then allow us to edit the chromosomes of those with this disease in the future. Should we use genome editing on individuals with this disease, as well as several other chromosomal/genetic diseases? I believe we should, in doing so, we will greatly increase the quality of life of those with the disease.
References
Aycan, Z., & Baş, V. N. (2014). Prader-Willi Syndrome and Growth Hormone Deficiency. Journal of Clinical Research in Pediatric Endocrinology Jcrpe, 62-67.
Butler, M. G., Lee, P. D., & Whitman, B. Y. (2006). Management of Prader-Willi syndrome (3rd ed.). New York: Springer-Verlag.
Dykens, E. M., Goff, B. J., Hodapp, R. M., Davis, L., Devanzo P., Moss, F. . . King, B. (1997). Eating Themselves to Death: Have “Personal Rights” Gone Too Far in Treating People With Prader-Willi Syndrome? Mental Retardation, 35(4), 312-314.
Kanazawa, S. (2014). Intelligence and obesity. Current Opinion in Endocrinology & Diabetes and Obesity, 21(5), 339-344.
Ledbetter, D. H., Riccardi, V. M., Airhart, S. D., Strobel, R. J., Keenan, B. S., & Crawford, J. D. (1981). Deletions of Chromosome 15 as a Cause of the Prader–Willi Syndrome. New England Journal of Medicine N Engl J Med, 304(6), 325-329.
Mischel, W., Ebbesen, E. B., & Zeiss, A. R. (1972). Cognitive and attentional mechanisms in delay of gratification. Journal of Personality and Social Psychology, 21(2), 204-218.
Nakazato, M., Murakami, N., Date, Y, et al (2001). A role for ghrelin in the central regulation of feeding Nature 409, 194-198
Rushton, J. P. (1980). Altruism, socialization, and society. Englewood Cliffs, NJ: Prentice-Hall.
Schlam, T. R., Wilson, N. L., Shoda, Y., Mischel, W., & Ayduk, O. (2013). Preschoolers’ Delay of Gratification Predicts their Body Mass 30 Years Later. The Journal of Pediatrics, 162(1), 90-93.
Whittington, J., Holland, A., & Webb, T. (2009). Relationship between the IQ of people with Prader-Willi syndrome and that of their siblings: Evidence for imprinted gene effects. Journal of Intellectual Disability Research, 53(5), 411-418.
YM Wang, L Chuang, BT Wang, et al. Maternal uniparental disomy in a patient with Prader-Willi syndrome with an additional small inv dup(15) chromosome. J Formos Med Assoc, 103 (2004), pp. 943–947
