
Home » Posts tagged 'Hispanic'
Tag Archives: Hispanic
Race, Obesity, Poverty, and IQ
2100 words
America has a current and ongoing obesity epidemic. Some ethnicities are more likely to be obese or overweight than others due to lower intelligence which means a lack of ability to delay gratification, lack of ability to think into the future, lower funds which translates to eating more refined carbohydrates which means more blood glucose spikes which then leads to obesity as I will show. Insulin has a causal relationship with obesity so those who lack funds to buy healthier food then turn to refined foods high in carbohydrates as they are cheaper and more abundant in low-income neighborhoods.
Adult obesity rate by State (top 5) is: 1) Louisiana (36.2 percent), 2) Alabama (35.6), West Virginia (35.6), and Mississippi (35.6), and 5) Kentucky (34.6) with the 5 least obese States being 51) Colorado (20.2), 49) Hawaii (20.7), 48) Montana (23.6), 47) California (23.2), and 46) Massachusetts (24.3). Notice how the States with higher rates of obesity are in the South and the States with the lower rates are in the North, give or take. The average IQ for these States as follows: Lousiana: 95.3, Alabama: 95.7, West Virginia 98.7, Mississippi 94.2 (lowest IQ State in the country, largest black population at 37 percent), and Kentucky at 99.4. The average IQ for those States is 96.66. The average IQs for the States with the lowest obesity rates are: Colorado 101.6, Hawaii 95.6, Montana 103.4, California 95.5, and Massachusets 104.3 (highest IQ State). The average for these States being 100.08. So there is a 4 point IQ difference between the top 5 States with the highest and lowest percentage of obese people, which goes with the North/South gradient of higher IQ people living in the North and lower IQ people living in the South. Back in 2014, a California real estate group took 500,000 Tweets using a computer algorithm and estimated intelligence based on spelling, grammar, and word choice and found a difference in State by State intelligence. Notice how the further North you go the higher the average intelligence is, which is then correlated with the obesity levels in that State.
With poverty rates by State, we can see how the States in the South have less intelligent people in them which then correlates to the amount of obesity in the State. Though, there are some anomalies. West Virginia and Kentucky have a super majority of whites. This is easily explained by the fact that less intelligent whites live in those States, and since both the poverty rates and obesity rates are high, it follows that the State will be less intelligent than States that have more intelligent people and less obesity.
It is known that intelligence is correlated with obesity at around -.25 (Kanazawa, 2014). The negative correlation between intelligence and obesity means that they are inversely related so, on average, one with higher intelligence has less of a chance of being obese than one with lower intelligence. The States with the lowest IQ people having those with the highest BMIs corroborates this. In America, obesity rates by ethnicity are as follows: 67.3% for whites, 75.6% for blacks, and 77.9% for ‘Hispanics’.
Now that we know the average intelligence rates by State, the percentage of obese by State and the demographics by State, we can get into why obesity rates correlate with intelligence and race.
Diaz et al (2005) showed that minority populations are more likely to be affected by diabetes mellitus which may be due to less healthy diets and/or genetic factors. Using the National Health and Nutrition Survey for 1999-2000, they analyzed overweight, healthy adults, calculating dietary intake variables and insulin sensitivity by ethnicity. They characterized insulin resistance with fasted insulin, as those who are more likely to become insulin resistant have higher fasted insulin levels (levels taken after waking, with the subject being told not to eat the night before as to get a better reading of fasted insulin levels). Non-‘Hispanic’ whites had higher energy and fat intake while ‘Hispanics’ had higher carb intake with blacks having lower fiber intake. Blacks and ‘Hispanics’ were more likely to have lower insulin sensitivity. However, ‘Hispanics’ were more likely to have lower insulin sensitivity even after controlling for diet, showing that metabolic differences exist between ethnicities that affect carbohydrate metabolism which leads to higher rates of diabetes in those populations.
Drewnowski and Specter (2004) showed that 1) the highest rates of obesity are found in populations with the lowest incomes and education (correlated with IQ), 2) an inverse relationship between energy density and energy cost, 3) sweets and fats have higher energy density and are more palatable (food scientists work feverishly in labs to find out different combinations of foods to make them more palatable so we will eat more of them), and 4) poverty and food insecurity are associated with lower food expenditures, lower fruit and vegetable intake, and lower-quality diet. All of these data points show that those who are poor are more likely to be obese due to more energy-dense food being cheaper and fats and sugars being more palatable.
Now that I’ve shown the relationship between race and IQ by state, obesity rates by state, insulin sensitivity by race, and that those in poverty are more likely to be obese, I can now talk about the actual CAUSE of obesity: insulin.
The conventional wisdom is that if you consume more kcal than you expend, you will gain weight, whereas if you consume less than your daily needs you will lose weight. This has been unchallenged for 50 years. Also known as Calories In and Calories Out (CICO), this mantra “eat less and move more!!!” has been bleated over and over with horrendous results. The CICO model only concerns itself with calories and not insulin which is a causal factor in obesity.
In this study, participants in the basal insulin group which received the lowest average insulin dose gained the least average amount of weight at 4.2 pounds. Those on prandial insulin gained the most weight at 12.5 pounds. The intermediate group gained 10.3 pounds. More insulin, more weight gain. Moderate insulin, moderate weight gain. Low insulin, low weight gain.
Researchers compared a standard dose of insulin to tightly control blood sugars in type 1 diabetic patients. At the end of the 6 years, the study proved that intensive control of blood sugars resulted in fewer complications for those patients.
Though, in the high dose group, they gained on average 9.8 pounds more than those in the standard group.
More than 30 percent experienced major weight gain! Prior to the study, both groups were equal in weight. But the only difference was the amount of insulin administered. Were the ones given high levels of insulin all of a sudden more lazy? Were those who gained weight suddenly lacking in willpower? Were they lazier before the study? We’re they more gluttonous? No, no, and no!!
(source)
Finally, Henry et al (1993) took Type II diabetics and started them off with no insulin. They went from 0 units of insulin a day to 100 units at 6 months. As higher rates of insulin were administered, weight rose in the subjects. Insulin was given, people gained weight. A direct causal relationship (see figure above). However, what’s interesting about this study is that the researchers measured the amount of kcal ingested, the number of kcal ingested was reduced to 300 per day. Even as they took in less kcal, they gained 20 pounds! What’s going on here? Well, insulin is being administered and if you know anything about insulin it’s one of the hormones in the body that tells the body to either store fat or not burn it for energy. So what is occurring is the body is ramping down its metabolism in order for the subject to store more fat due to the exogenous insulin administered. Their TDEE dropped to about 1400 kcal, while they should have been losing weight on 1700 kcal! The CICO model predicts they should have lost weight, however, adaptive thermogenesis, better known as metabolic slow down, occurred which dropped the TDEE in order for the body to gain fat, as insulin directly causes obesity by signaling the body to store fat, so the body drops its metabolism in an attempt to do so.
Putting this all together, blacks and ‘Hispanics’ are more likely to be in poverty, have lower intelligence, and have higher rates of obesity and diabetes. Furthermore, blacks are more likely to have metabolic diseases (adaptive thermogenesis aka metabolic slowdown is a metabolic disease) which are related with obesity due to their muscle fiber typing which leads to lower maximal aerobic capacity (less blood and oxygen get around the body). Type II skeletal muscle fibers’ metabolic profile contributes to lower average aerobic capacity in blacks. It also is related to cardiometabolic diseases, in my opinion because they don’t have the muscle fiber typing to run long distances, thus increasing their aerobic capacity and VO2 max.
Due to the diets they consume, which, due to being in poverty and having lower intelligence, they consume more carbohydrates than whites, which jacks their blood glucose levels up and the body then releases insulin to drive the levels glucose in the body down. As insulin levels are spiked, the body becomes insulin resistant due to the low-quality diet. Over time, even a change in diet won’t fix the insulin resistance in the body. This is because since the body is insulin resistant it created more insulin which causes insulin resistance, a vicious cycle.
Poverty, intelligence and race both correlate with obesity, with the main factor being lower intelligence. Since those with lower IQs have a lack of foresight into the future, as well as a lower ability to delay gratification which also correlates with obesity, they cannot resist low-quality, high-carb food the same way one with a higher IQ can. This is seen with the Diaz et al study I linked, showing that whites have higher levels of fat intake, which means lower levels of carbohydrate intake in comparison to blacks and ‘Hispanics’. As I’ve shown, those in poverty (code word for low intelligence) ingest more refined carbohydrates, they have higher levels of obesity due to the constant spiking of their insulin, as I have shown with the 3 aforementioned studies. Since blacks and ‘Hispanics’ have lower levels of intelligence, they have lower levels of income which they then can only afford cheap, refined carbs. This leads to insulin being constantly spiked, and with how Americans eat nowadays (6 times a day, 3 meals and snacks in between), insulin is being spiked constantly with it only dipping down as the body goes into the fasted state while sleeping. This is why these populations are more likely to be obese, because they spike their insulin more. The main factor here, of course, is intelligence.
Another non-CICO cause for obesity is exposure to BPA in the womb. Researchers carried out BPA testing in three differing subjects: 375 babies invitro, (3rd trimester) children aged 3 (n=408) and aged 5 (n=518) (Hoepner, et al, 2016). They measured the children’s bodies as well as measuring body fat levels with bioelectrical impedance scales.Prenatal urinary BPA was positively associated with waist circumference as well as fat mass index, which was sex-specific. When analyzed separately, it was found that there were no associated outcomes in body fat for boys (however it does have an effect on testosterone), but there was for girls (this has to do with early onset puberty as well). They found that after controlling for SES and other environmental factors there was a positive correlation with fat mass index – a measure of body fat mass adjusted for height, body fat percentage and waist circumference. The researchers say that since there was no correlation between BPA and increased obesity, that prenatal exposure to BPA indicates greater vulnerability in that period. The sample was of blacks and Dominicans from New York City. Whites drink less bottled water, which has higher levels of BPA. Blacks and ‘Hispanics’ consume more, and thus have higher levels of obesity.
In conclusion, blacks and ‘Hispanics’ are more likely to be in poverty, have lower intelligence, higher rates of obesity and lower incomes. Due to lower incomes, cheap, refined carbohydrates is what they can afford in bulk as that’s mostly what’s around poor neighborhoods. Ingesting refined carbohydrates more often consistently jacks up blood glucose which the body then releases insulin to lower the levels. Over time, insulin resistance occurs, which then leads to obesity. As I’ve shown, there is a direct causal relationship between the amount of insulin administered and weight gain. With the aforementioned factors with these two populations, we can see how the hormonal theory of obesity fits in perfectly with what we know about these ethnic groups and the obesity rates within them. Since people in poverty gravitate more towards cheap and refined carbohydrates, they’re constantly spiking their insulin which, over time, leads to insulin resistance and obesity.
Myopia, IQ, and Race
1200 words
We’ve all heard of the nerd stereotype. One of the main ones is that nerds wear glasses. However, as most of my readers may know, stereotypes are based on fact more often than not. From the black criminal and sprinter, to the hyper-intelligent East Asian, to the intelligent and creative Europeans, we see that these so-called ‘stereotypes’ arise because stereotypes are actually average traits. Therefore, this ‘nerd stereotype’ that they always wear glasses is based on averages, so there must be a genetic component behind it. In this article I will talk about the genetics of myopia, reasons why researchers believe it arises, and racial differences in the prevalence of myopia.
Myopia, better known as nearsightedness, has a pleiotropic relationship with intelligence. Pleiotropy is the single gene or set of genes controlling multiple, possibly unrelated, phenotypic traits. So if the two traits are correlated, then there is a good chance that if one wears glasses they may have higher average intelligence.
Rosner and Belkin (1987) found that the prevalence of myopia was higher in more intelligent and educated groups. They found a strong association between the rate of myopia, years of schooling and intelligence level. Schooling and intelligence weigh equally with myopia, showing that those who are myopic tend to stay in school longer and are more intelligent than average.
Saw et al (2004) show that there may be similar genes associated with eye growth or size (myopia) and neocortical size (*possibly* correlated with IQ, we know it is). This is exactly what Cohn, Cohn, and Jensen found in 1987; that there was a pleiotropic relationship between IQ and myopia. One set of genes controls one or multiple phenotypic traits. They also say that nonverbal IQ is correlated with myopia in the Singaporean cohort independent of near work from the children (such as reading). Nonverbal IQ may be an independent risk factor of myopia independent of books read per week. They conclude that more research needs to be taken out to untangle the cause and effect of the myopia/intelligence/reading relationship.
Mirashi et al (2014) show in a sample of 4600 myopia-inflicted Germans between the ages of 35 and 74 that about 53 percent of the sample had graduated from college compared to 24 percent of the sample who didn’t go to school past high school. They, too, conclude that higher levels of myopia are associated with higher educational achievement and post-school professional achievement and that those who were myopic had higher levels of educational achievement than those in the sample who weren’t myopic.
More recently, Verma and Verma (2015) state that there is evidence that both genetic and environmental factors play a role in the prevalence of myopia. Moreover, Czepida, Lodykowska, and Czepita (2008) come to the same conclusion; that children with myopia have higher IQs and was verified in other countries (the USA, the Czech Republic, Denmark, Israel, New Zealand).
The correlation between myopia and IQ is between .2 and .25 (Jensen, 1998 b; 149). Jensen writes on page 150:
. . .the degree of myopia was measured as a continuous variable (refraction error) by means of optical techniques in a group of sixty adolescents selected only for high IQs (Raven matrices) and their less gifted full siblings, who averaged fourteen IQ points lower, a difference equivalent to 0.92o. The high-IQ subjects differed significantly from their lower-IQ siblings in myopia by an average of 0.39a on the measure of refraction error.1161 In other words, since there is a within-families correlation between myopia and IQ, the relationship is intrinsic. However, it is hard to think of any directly functional relationship between myopia and IQ. The data are most consistent with there being a pleiotropic relationship. The causal pathway through which the genetic factor that causes myopia also to some extent elevates g (or vice versa) is unknown. Because the within-family relationship of myopia and IQ was found with Raven’s matrices, which in factor analyses is found to have nearly all of its common factor variance on g ,n it leaves virtually no doubt that the IQ score in this case represents g almost exclusively. (emphasis his)
Therefore, as noted earlier, we would see a slight variation in the general population between those with high IQs and those who wear glasses and are myopic.
Jensen also talks about race and myopia. He says that Asians have the highest rates of myopia, while blacks have the lowest rate and whites have a rate slightly higher than blacks.
In a tribute to Arthur Jensen, edited by Helmuth Nyborg, it states that East Asians have the highest rates of myopia, with blacks having the lowest rate and whites being intermediate (Rushton’s Rule of Three). Ashkenazi Jews have a rate of myopia two times higher than that of gentiles, on par with East Asians. These are yet other biological correlates with the g factor that also lend credence to the hereditarian hypothesis.
Certain types of visual disturbances affect some races more frequently. Asian-Americans, for example, are more likely to be near-sighted than Caucasians or African-Americans. African-Americans have the lowest incidence of near-sightedness, but are more prone to cataracts and some other eye diseases. Eye problems, including the need to wear glasses, also can run in families.
Of course, if myopia is a pleiotropic trait (there is good evidence that there is), and wearing glasses runs in families as well as high intelligence, it can be safely hypothesized that the two indeed do have a relationship with each other. The biological correlates show enough that these traits, too, follow Rushton’s Rule.
Finally, Au, Tay and Kim (1993) present data that shows the prevalence and severity of myopia is associated with higher education. They also report on data that Rosner and Belkin reported the prevalence of myopia in males with and IQ of 80 or less was 8 percent while the rate increased up to 27.3 among those with an IQ of 128 or higher. Reported separately, it was concluded that the myopia rates in the cohort of 110,236 young Singaporean males correlated with race (Au, Tay, and Lim, 1993). The myopia rate for the Chinese was 48.5 (IQ 105), for Eurasians it was 34.7, for Indians it was 30.4 (IQ 82), and for Malays it was 24.5 (IQ 92). It’s worth noting that India’s IQ is depressed by disease and bad nutrition, and if this were to be ratified their IQ would be around 94. So this, again, shows the biological correlate with IQ and myopia as it’s showing on the Indians’ genotype.
The association between myopia and intelligence isn’t definite yet, however with more studies looking into the relationship between these variables I believe it will be concrete that those who are more myopic tend to have higher IQs due to the pleiotropic nature of IQ and myopia. Since reading is heritable, those with higher IQs as children tend to read more as adults, and the racial gradient is noticed in children, it’s pretty safe to say that myopia and IQ are linked pleiotropically and give more credence to the hereditarian hypothesis. Most studies find a statisically positive correlation between myopia and intelligence. Along with the racial disparities in myopia as well as intelligence, it’s pretty safe to say that the relationship is genetic and pleiotropic in nature since the races also differ in these variables.
Dysgenic Fertility and America’s Obesity Crisis
1050 words
The dysgenic trend currently occurring in America has implications for obesity as well. Since intelligence is negatively correlated with obesity, as America’s average IQ decreases, the rates of obesity in our country will increase. This is due to the high correlation between intelligence and obesity. As we continue to allow unfettered immigration into America, the average IQ of the country will decrease, while the amount of people that are overweight and obese will increase.
The ethnic differences in obesity rates lead more credence to what I am saying. As the demographics shift, more people will be overweight or obese due to having a lower IQ. Whites, too, are experiencing this dysgenic effect, as intelligent people of all ethnicities are not reproducing. As more and more genetically less fit individuals continue to have a higher rate of reproduction in comparison to intelligent individuals, this crisis will continue to persist.
Those with lower intelligence have less of an ability to delay gratification, which has a strong genetic component. As more people breed who cannot delay their gratification, the rates of obesity will increase in the country. Of course, the lack of ability to delay gratification comes with a lowered IQ. This is what we see in regards to sex. Those with higher IQs lose their virginities at a later age in comparison to those with lower IQs. Along with the data from Kanazawa that shows that more intelligent people have a lower BMI than those with lower intelligence, this study gives more credence to the theory that those with higher levels of intelligence can better delay their gratification.
JayMan says that there is evidence for an increased genetic load for those with lower IQs, which we can then reason that this also leads to a higher prevalence for obesity in low IQ populations. JayMan then says that many of the genes found to influence obesity seem to operate in the brain and that they have a pleiotropic effect, meaning that multiple genes affect one or more traits. With the increased genetic load comes with an increased chance to have a lower IQ and become obese, as these two things correlate with the lack of ability to delay gratification.
Of course, these problems persist due to modern medicine. With the advent of better medicine, it allowed us to beat diseases that formerly would have been devastating to the population at large. This led to an increase of alleles with negative effects in the population that continue to pass down through the generations. Along with these advances in medical technology, welfare and other government-funded programs also enable those that are less genetically fit. Since intelligence is correlated with ability to care for offspring, as well as r- and K-selected traits, those with lower intelligence exhibit more r-selected traits. This is why America is facing a dysgenic fertility crisis. Welfare props up those with less intelligence, giving them more incentives to breed. They then breed more low IQ children who then will live off of the government. This vicious cycle then continues unfettered due to how America’s dysgenic welfare structure is implemented.
Before the advent of modern technology, those who were less genetically fit didn’t survive to pass on their genes. But, in the modern day with all of our superior technology, this allows the less intelligent to breed when in the past they would have been selected out of the gene pool due to being less biologically fit.
Another variable that is involved with the dysgenic fertility of America is Mexican immigration. With the influx of illegal (and legal) peoples from the South of the Border, this is having both dysgenic effect on both the average intelligence of our country along with the average BMI. The average BMI for the average American male is 28.6. In the 1950s, 10 percent of American adults were obese compared to 35 percent of American adults today. Now, this has to do with ability to access food, as well as the effect of the media on children has a huge effect on obesity, due in part to not getting a full nights sleep, as that is correlated with obesity. However, an increase in genetic load, which also comes with a decrease in intelligence, has a lot to do with this as well. The increase in the BMI of the average American has to do with immigration as well. The rates of obesity for different ethnicities in America are as follows: 67.3% for whites, 75.6% for blacks, and 77.9% for ‘Hispanics’. So of course, with more immigration from the South of the Border, the average IQ for America is decreasing while obesity rates are increasing, due mostly to this illegal immigration.
Height and intelligence are both correlated. Ever since the advent of the industrial revolution, we have had an excess surplus of food. As Gina Kolata says in her book Rethinking Thin, an increase in obesity is inevitable. She says this since the increase in genetic height and IQ has occurred, so the increase in obesity follows with it. We need to influence those with higher IQs to have more children. Further, we also need to restrict immigration to only high-skilled immigrants (only when necessary) to reverse this trend that has been occurring since the 1960s. Though, with higher levels of intelligence one can forgo their urges and live a healthier lifestyle due to having higher cognition which leads to a better ability to delay gratification than one with lower intelligence.
Those with higher IQs make better choices on what to eat than those with lower IQs. This is shown in the BMIs of the intelligent and non-intelligent population. As more and more people with lower genotypic IQ come into the country, the quality of life will decrease as will the average intelligence of the country. In turn, the BMI of the average American will increase along with the decrease of our country’s average intelligence. To ameliorate this, we need to have extremely stringent criteria on who we allow into the country. An IQ test, to start, would be a good idea. As those with higher intelligence have less of a genetic load and have less of a chance of becoming obese than one with a lower IQ, the current dysgenic effect that this unfettered immigration is having on America can be lessened.
Science Daily: Mom’s Exposure to BPA During Pregnancy Can Put Her Baby on Course to Obesity
1750 words
Science Daily came out with an article today that exposure to BPA invitro for babies is correlated with obesity at age 7. 94 percent of the women tested had detectable levels of BPA. BPA is also linked with early onset puberty, which I will also speak on later in this article as it has implications for one of my theories.
I briefly touched on BPA in my article What’s the Cause of the Cucking of Europe? where I said:
I advise all of you (women included, there are many deleterious effects of BPA on the mother as well as the baby prenatally), to discontinue use of plastics with BPA in them.
The above-linked study shows that preeclampsia is correlated with elevated levels of BPA in the blood levels in the pregnant mothers, fetal blood, and the placenta. BPA was found to be elevated in mother’s fetal tissue with preeclampsia in comparison to the mothers with lower levels of BPA in their fetal tissue. I will come back to the BPA link with preeclampsia later in the article as it has implications for ethnic groups in America.
The paper, which was just released on the 17th, called Bisphenol A and Adiposity in an Inner-City Birth Cohort, carried out tested BPA in three differing subjects: 375 babies invitro, (3rd trimester) children aged 3 (n=408) and aged 5 (n=518) (Hoepner, et al, 2016). They measured the children’s bodies as well as measuring body fat levels with bioelectrical impedance scales.** Prenatal urinary BPA was positively associated with waist circumference as well as fat mass index, which was sex-specific. When analyzed separately, it was found that there were no associated outcomes in body fat for boys (however it does have an effect on testosterone), but there was for girls (this has to do with early onset puberty as well). They found that after controlling for SES and other environmental factors, they discovered that there was a positive correlation with fat mass index – a measure of body fat mass adjusted for height, body fat percentage and waist circumference. The researchers say that since there was no correlation between BPA and increased obesity, that prenatal exposure to BPA indicates greater vulnerability in that period.
The researchers then conclude that BPA exposure invitro “may be an important underlying factor in the obesity epidemic” and that “Endocrine disrupting chemicals like BPA may alter the baby’s metabolism and how fat cells are formed early in life.”
If true, this has huge implications for the way we look at the obesity epidemic in this country. Who are the most likely to be obese? “Hispanics” and blacks (Ogden et al, 2014).
Returning to what I brought up earlier about early onset puberty: in my article on the hormone leptin being a cause for earlier menarche in black girls, I noted that since black girls were more likely to be heavier as well as mature faster than white girls, that differences in leptin were the cause of differences in menarche between the two groups. Elevated levels of serum leptin were correlated with body fat and differences in maturation between the two groups. Differences remained, but lessened, after controlling for differences in fat mass, maturation, age, and physical fitness.
Since BPA is correlated with adiposity in children and black girls have earlier menarche DUE to there being a higher chance of black girls being overweight in comparison to white girls, BPA is yet another piece to the puzzle of this phenomena, along with, of course, evolution. Ingestion of BPA is an environmental factor, however, with these changes in body chemistry in the children invitro due to increased BPA consumption by the pregnant mothers, it leads to one cause that can be prevented from further occurring due to our new knowledge.
The study was carried out on a cohort from NYC. In 2010 in NYC, the city was: 44 percent white, 25.5 percent black, 12.7 percent Asian with the rest being filled out by ‘Hispanics’ (not a racial category) and mixed-race people. Even after they matched for SES and other environmental factors, these differences persisted. However, this study was only carried out on those women who self-identified as either Dominican (basically African) and black. To quote the researchers:
Women were included if they self-identified as either African American or Dominican and had resided in Northern Manhattan or the South Bronx for at least 1 year before pregnancy. Exclusion criteria included mother’s report of: cigarette smoking or use of other tobacco products during pregnancy, illicit drug use, diabetes, hypertension, known HIV, or a first prenatal visit after the 20th week of gestation.
So, we have a full sample of Caribbean Africans and African Americans in this study. What else can we learn about those two populations and their consumption of things with BPA in them?
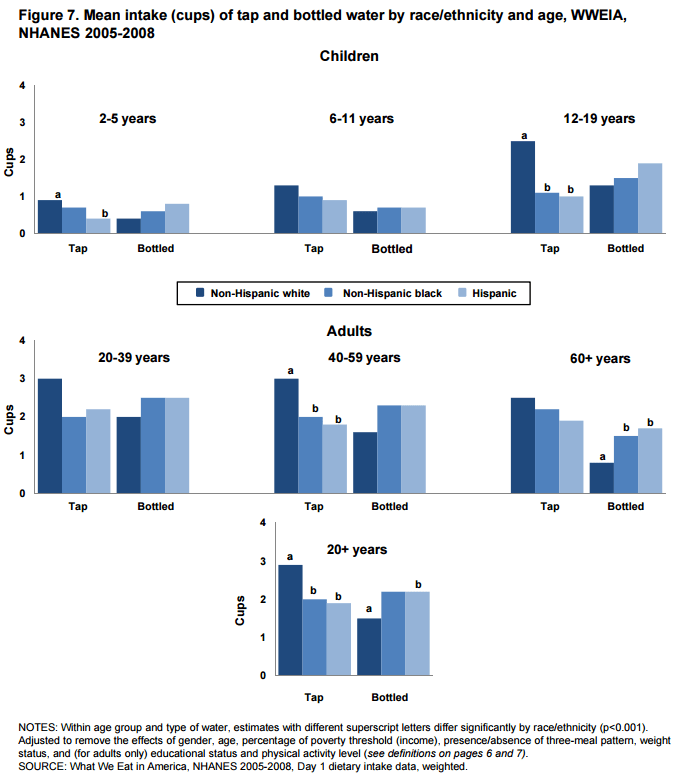
The above Figure (7) is taken from the U.S. Department of Agriculture and the Food Surveys Research Group study on differences in drinking tap and bottled water.in different populations in the country. As you can see in this figure (what is notable is the ages 12-19 and 20 to 60 in the table), whites at all age groups drink more tap water. Blacks and ‘Hispanics’ were pretty much even in consumption of bottled water. However, Mexican American girls, like black girls, are also entering puberty earlier. Since both populations have a substantial percentage of them overweight and obese (factor for serum leptin production which then causes early onset puberty), this again shows a strong correlation between body fat gain and early onset puberty. Moreover, this also shows that both Dominican and black populations consume more bottled water than do white populations, both populations are more likely to be obese or overweight (even after controlling for SES) which causes leptin production earlier causing periods to happen much sooner than in populations who drink less bottled water and use other products with BPA in them. .
Going back to preeclampsia, it is a condition that pregnant women develop that’s characterized by hypertension (high blood pressure) and protein in the urine. It’s known that black women suffer from it the most. More interestingly, over the past ten years, rates of preeclampsia have been increasing in the black female population. As the researchers note in the article, BPA is correlated with preeclampsia. Blacks have a higher rate and chance of being diagnosed with hypertension as well. All of these differing variables coalesce into our current obesity epidemic. With blacks and “Hispanics” being more likely to be overweight/obese drink more bottled water, have a higher risk for hypertension, higher risk for preeclampsia and having earlier menarche, these help explain, in part, racial/ethnic differences in obesity.
These differences can be attributed to consumption of bottled water, i.e., consuming things with made with and packaged in plastic as well as canned foods. From my experience with Dominican and black New Yorkers, they tend to have horrible lifestyles, tend to drink tons of bottled water and also tend to be overweight or obese at a higher rate in comparison to the general population. This leads to biologic factors changing (i.e., earlier menarche in younger girls) in these young girls, leading to devastating effects on their body chemistry.
This study, yet again, proves another underlying factor for obesity in certain populations in the country. And what do you know? It’s the populations that already have the highest rate of obesity in the country. When it becomes definitive that BPA consumption by pregnant mothers does lead to underlying factors in obesity. To quote the researchers: “Endocrine disrupting chemicals like BPA may alter the baby’s metabolism and how fat cells are formed early in life.” This will be HUGE for our understanding of underlying causes to obesity! Moreover, if (when) this is fully corroborated, it can then be said that by mothers exposing their children in the womb to excess levels of BPA, there is a chance that they are “giving their own choice to make their children have a higher chance of being obese, as they know the dangers of BPA consumption during pregnancy and all of the negative variables associated with it.”
This is an extremely interesting and important study for our understanding of obesity. Since BPA consumption invitro is correlated with higher fat mass index in girls at age 7, and since those girls who tend to be more overweight and obese than other populations, we can then say that BPA has a hand in obesity in children, which then causes serum leptin to be released, causing way menarche in these populations. An increase in sexual maturation has been linked to the obesity epidemic, which began around 60 years ago. The cause of this is due to the demonization of the fat macro and carbohydrates, all the while it was reversed. This destroyed insulin sensitivity for many Americans, leading to a huge majority of our health problems today.
In conclusion, underlying factors for obesity keep appearing. Due to racial/ethnic differences in bottled water consumption (one of the most common BPA products in households), which the effects of BPA may alter how fat cells are formed in early life, this accounts for, in part, excess adiposity in differing populations. These underlying factors could help show where some of these racial/ethnic differences in obesity come from. Since the two populations in the study (black American and Dominican) both have high levels of adiposity, both drink a lot of bottled water and both have earlier menarche than do whites (who drink LESS bottled water), this shows that some (a lot?) of the variation in obesity between ethnic/racial groupings can be explained by these underlying factors.
** I have one problem with this study. They assessed fat mass index with bioelectrical impedance.The machine sends a light electrical current through the body and measures the degree of resistance to the flow of the current, which body fat can then be estimated. Problems with measuring body fat this way are as follows: it depends on how hydrated you are, whether you exercised that day, when you last ate, even whether your feet are calloused. Most importantly, they vary depending on the machine as well. Two differing machines will give two differing estimates. This is my only problem with the study. I would like if, in a follow-up study, they would use the DXA scan or hydrostatic weighing. These two techniques would be much better than using bioelectrical impedance, as the variables that prevent bioelectrical impedance from being a good way to measure body fat don’t exist with the DXA scan or hydrostatic weighing.
In Defense of Jason Richwine
3900 words
I came across two articles today, one from The Atlantic and the other from judgybitch.com. Both have attacked Jason Richwine’s dissertation in which he calls for a change to the US immigration policy to turn away low IQ immigrants and only accept high IQ ones. I agree fully with this (if it’s completely controlled, of course). This would drop crime as well as save us more money in welfare and other government programs that low IQ peoples take.
By 2050, 9 out of 10 people in the US will be obese or overweight and by 2020 80 percent of US men will be obese or overweight. This is due, in part, to an influx of those with lower IQs from South of the Border. Jason Richwine’s argument for testing immigrants will, in turn, lower obesity rates in America.
Dr. James Thompson noted how continued mass immigration from the South of the Border would decrease IQ, this is a real and pressing issue. A country is only as good as its majority population and by allowing all of these low IQ people into the country, our country will transform into theirs, which is ironic since that’s the exact thing they’re running away from. You cannot run away from genetics. The overall ‘Hispanic’-white gap is 10.2 points or .72 SDs. That will lower the average IQ of the country even more, and in turn, give us all a lowered quality of life. The average IQ of Mexico is 88 (Lynn and Vanhanen, 2002) so by allowing unfettered mass immigration without checking average IQs to see if they’ll be of any use to us as a country will lead to eventual irreversible effects if this isn’t stopped soon.
The first article I’ll look at is the one from The Atlantic:
Let’s start with the fact that there is no such thing as a direct test of general mental ability. What IQ tests measure directly is the test-taker’s display of particular cognitive skills: size of vocabulary, degree of reading comprehension, facility with analogies, and so on. Any conclusions about general mental ability are inferences drawn from the test-taker’s relative mastery of those various skills.
IQ tests test g or the general intelligence factor which encompasses all mental abilities. I guess the author of this piece has never heard of Raven’s Progressive Matrices. It’s a ‘culture free’ IQ test where the test is based on pattern recognition. No bias there.
Even then, if they don’t speak English and speak Spanish, they can get tests in their native language which are not biased. Gottfredson (1994) and 51 other eminent intelligence researchers signed a 25 point statement in which one of the statements was:
Intelligence tests are not culturally biased against American blacks or other native-born, English-speaking peoples in the U.S. Rather, IQ scores predict equally accurately for all such Americans, regardless of race and social class. Individuals who do not understand English well can be given either a nonverbal test or one in their native language.
They will be given the nonverbal test (RPM, see below) or one in their native language, which still test the same underlying concept of the general intelligence factor.
They found that being raised by high-SES (socioeconomic status) parents led to an IQ boost of between 12 and 16 points – a huge improvement that testifies to the powerful influence that upbringing can have.
False. See below.
A study of twins by psychologist Eric Turkheimer and colleagues that similarly tracked parents’ education, occupation, and income yielded especially striking results. Specifically, they found that the “heritability” of IQ – the degree to which IQ variations can be explained by genes – varies dramatically by socioeconomic class. Heritability among high-SES (socioeconomic status) kids was 0.72; in other words, genetic factors accounted for 72 percent of the variations in IQ, while shared environment accounted for only 15 percent. For low-SES kids, on the other hand, the relative influence of genes and environment was inverted: Estimated heritability was only 0.10, while shared environment explained 58 percent of IQ variations.
Turkheimer was right that he did find gene x environment interactions that made genetic influences weaker and shared environment stronger for those from poorer homes in comparison to those from more affluent homes. Though most studies show no interaction effects, or interactions vary significantly.
Other studies have shown that heritabilities are the same both within as well as between white and black samples. That led Jensen to label this the ‘default hypothesis’. Researchers analyzed full and half siblings from the NLSY on three Peabody Achievement Tests. 161 black full siblings, 106 pairs of black half siblings, 314 pairs of full white siblings and 53 pairs of white half-siblings. with measures in math and reading. The best fitting model for all of the data was by which the sources of the sources of the differences between those within race and the differences between races were the same, at 50 percent genetic and environmental. The combined model (50/50) best explains it, whereas the culture-only and genetics-only models are inadequate.
IQ tests are good measures of innate intelligence–if all other factors are held steady.
This is wrong. IQ tests are fine all around the world. RPM is one of the best out there and correlates with g between .8 and .9.
But if IQ tests are being used to compare individuals of wildly different backgrounds, then the variable of innate intelligence is not being tested in isolation. Instead, the scores will reflect some impossible-to-sort-out combination of ability and differences in opportunities and motivations. Let’s take a look at why that might be the case.
Intelligence – g – is the same across every population in the world.
Comparisons of IQ scores across ethnic groups, cultures, countries, or time periods founder on this basic problem: The cognitive skills that IQ tests assess are not used or valued to the same extent in all times and places
This is why they get re-standardized.
Indeed, the widespread usefulness of these skills is emphatically not the norm in human history. After all, IQ tests put great stress on reading ability and vocabulary, yet writing was invented only about 6,000 years ago – rather late in the day given that anatomically modern humans have been around for over 100,000 years. And as recently as two hundred years ago, only about 15 percent of people could read or write at all.
Doesn’t matter. See Raven’s Progressive Matrices above. The general intelligence factor is the same in all populations around the world. There are ways to give intelligence tests, such as RPM, to those who don’t read or write.
More generally, IQ tests reward the possession of abstract theoretical knowledge and a facility for formal analytical rigor.
Abstract thought is linked with intelligence. Those with higher IQs are more analytical than those with lower IQs.
To grasp how culturally contingent our current conception of intelligence is, just imagine how well you might do on an IQ test devised by Amazonian hunter-gatherers or medieval European peasants.
I touched on this in my refutation of Robert Sternberg. The concept of g does not change over time. The more intelligent you are, the better chance you’ll have to survive in those places.
Such skills are used more intensively in the most advanced economies than they are in the rest of the world. And within advanced societies, they are put to much greater use by the managers and professionals of the socioeconomic elite than by everybody else. As a result, American kids generally will have better opportunities to develop these skills than kids in, say, Mexico or Guatemala. And in America, the children of college-educated parents will have much better opportunities than working-class kids.
Those skills are used much more in advanced economies because of higher average innate intelligence. The children of college-educated parents have much better opportunities than working-class kids because intelligence is strongly linked to socioeconomics status.
Among the strongest evidence that IQ tests are testing not just innate ability, but the extent to which that innate ability has been put to work developing specific skills, is the remarkable “Flynn effect”: In the United States and many other countries, raw IQ scores have been rising about three points a decade. This rise is far too rapid to have a genetic cause. The best explanation for what’s going on is that increasing social complexity is expanding the use of the cognitive skills in question – and thus improving the opportunities for honing those skills.
Let’s say Flynn is right. The average black now is as intelligent as the average white in 1945. That’s supposed to show that the race difference in IQ is environmentally caused because there hasn’t been that much genetic change in the white population and the IQ has allegedly gone up 15 points. So, you can have a 15 point difference created by just an environmental change, no one knows why. Some think better nutrition or malnourished brain, etc. That’s also a fallacy. Just because a change in one group over time is due to an environmental change, doesn’t mean, or even make it probable, that a difference between 2 groups at the same time is due to an environmental change. The Flynn Effect make’s that highly unlikely and here’s why.
The Flynn Effect, assuming it’s real, has been acting completely uniformly in every population. Any country you ask, the rate of increase is 3 per decade. That means it’s an environmental factor that affects whites and blacks the same way as well as the whole world. And as a result of this uniform environmental factor, you have a difference in IQ that’s being preserved. That would suggest that the response on the parts of blacks and whites is due to some non-environment factors, a genetic factor, which is making the difference in IQ remain constant as the Flynn Effect goes into effect.
What makes it even more unlikely, in the last 60 years, their environments have become very similar since segregation. These differences don’t exist now, they go to the same schools by court order, same TV shows, same movies, basically same environment for both, and yet, that increasing similarity in the environment, the Flynn Effect, the IQ gap has remained intact. Which means whatever counts for the gap is genetic and not environmental. The more and more similar the environment, the less and less of the difference can be due to the environment and the more and more it must be due to genes. So this 15 point gap surviving these changes in the environment, seems more and more likely to be genetic in origin.
So because this ‘Effect’ is the same across all populations and the gap didn’t close, that means it’s genetic. If the gap persisted even when IQs were rising 3 points per year, the B-W gap has still persisted, proving that it’s genetic.
That is why the Flynn Effect is irrelevant. This “Effect”, has been a slight upward trend in IQ, around 3 points per decade, which, in my opinion, has to do with the advent of better nutrition and an industrialized society. The rise in IQ started around 1880, almost perfectly coinciding with the industrial revolution in America. Along with a more industrialized society, it’s possible to give most citizens in the country good enough nutrition to where they are not iodine deficient (adding iodine to our salt boosted Americans IQs), as well as being deficient in zinc, iron, protein and certain B vitamins which the effects of not getting enough leads to the brain not growing to its full potential, which in turn leads to a lower IQ.
One more point on the Flynn Effect. The Flynn Effect does not occur on g, as it is not a Jensen Effect. Rushton defines Jensen Effect as follows:
Significant correlations occurring between g-factor loadings and other variables have been dubbed “The Jensen effect”.
…
Thus the secular increase in test scores (the “Lynn±Flynn effect”) is not a “Jensen effect” nor is this the first time the discriminating power of the Jensen effect has been shown.
The Flynn effect is acutely embarrassing to those who leap from IQ score differences to claims of genetic differences in intelligence.
Not at all, since it’s easily explainable by better nutrition since the beginning of the industrial revolution. It’s also not even on g so why this gets discussed is beyond me.
Specifically, it is based on the ahistorical and ethnocentric assumption of a fixed relationship between the development of certain cognitive skills and raw mental ability. In truth, the skills associated with intelligence have changed over time–and unevenly through social space–as society evolves.
The relationship exists and there is a strong correlation between cognitive skills and raw mental ability. More intelligent people have better functioning societies than less intelligent people. This is an objective fact.
But contrary to the counsel of despair from hereditarians like Richwine, those deficits aren’t hard-wired. Progress in reducing achievement gaps will certainly not be easy, but a full review of the IQ evidence shows that it is possible. And it will be aided by policies, like immigration reform, that encourage the full integration of Hispanics into the American economic and cultural mainstream.
Jason Richwine is correct. Progress in achievement gaps will not close, barring the continued dysgenesis that America is facing. Immigration reform will not change anything. They don’t want to assimilate; they want to come and leech off of our Welfare State. The denial of genetics and scholastic achievement won’t be able to be held for long. In this study in which Robert Plomin was one of the researchers, it was found that 60 percent of the difference between individual 16-year-old students in the UK could be attributed to genetic factors. We know that IQ is linked to academic achievement and since that’s heritable as well, we will soon see that race and ethnic differences in IQ and academic achievement are, without a shadow of a doubt, are real and do not exist because of any economic deprivation or some other kind of non-biologic factors.
For the second article, from judgybitch.com, in which she only says one correct thing in it and it’s:
Here’s a little pet theory of mine I’d like to throw out, just for the hell of it. I think humans prefer lighter skin and hair and eye colors because those tend to be the result of recessive genes. A man with darker tones who has a child with a woman of lighter tones will almost always see his genes expressed in the children. Dark tones tend to be dominant. The preference for lighter skin is a natural paternity test.
This is called sexual selection, which is natural selection which arises for selection of traits in the opposite sex. Selecting for certain traits which the opposite sex found appealing, for example, is how long hair got sexually selected for outside of Africa along with selection for hair, eye, and skin color. Selecting for these traits had them become more prevalent and they eventually stayed due to intense selection for them.
For example, Eurasian women got selected for beauty and Eurasian men who got selected for intelligence as men had to be more intelligent in order to hunt for food. Conversely, African women gathered and hunted for food and became slightly more intelligent than African men who became the more attractive sex (Fuerle, 2008).
But other than this she is wrong.
You know what IS linked very strongly to lower IQs?
Malnutrition.
http://www.sciencedaily.com/releases/2004/11/041117005027.htm
http://www.ncbi.nlm.nih.gov/pubmed/2628311
http://www.nature.com/pr/journal/v5/n11/abs/pr1971371a.html
The idea is not even the slightest bit controversial. Children who are starved, especially in the earliest years of life, perform very poorly on IQ tests compared to peers who received adequate nutrition. Like, really poorly. IQ’s down around 60 (100 is average).
Let’s look at this world hunger map, shall we?

http://www.geographictravels.com/2008/07/world-hunger-map.html
Oh well now, would you look at that. Looks like it’s mostly black and Hispanic folks who are starving. And all those white folks are living life to the hilt, with full bellies and bright futures.
Must be a coincidence.
It’s not a coincidence. There is no coincidence that if you superimpose an IQ map over the world hunger map, that a super majority of the low IQ countries would have bad nutrition and be starving, whereas those higher IQ populations would have better nutrition and, therefore, higher IQs and lack of malnutrition and starvation. There are environmental factors involved in this, which I have gone through in my article IQ, Nutrition, Disease and Parasitic Load. Yes, those environmental variables decrease IQ; but in the case of Africa, if their full genotypic IQ were expressed in their phenotype, they would have an average IQ of 80, 9 points away from the lowest average European country which is Serbia at 89. They would then be able to have better functioning societies and not have to rely on outside aid. Though, their low IQs are the cause of evolution, those factors only cause about 10 points of difference (depending which of the variables I mentioned exist in those areas).
Let’s look at this map of food insecurity in the United States:
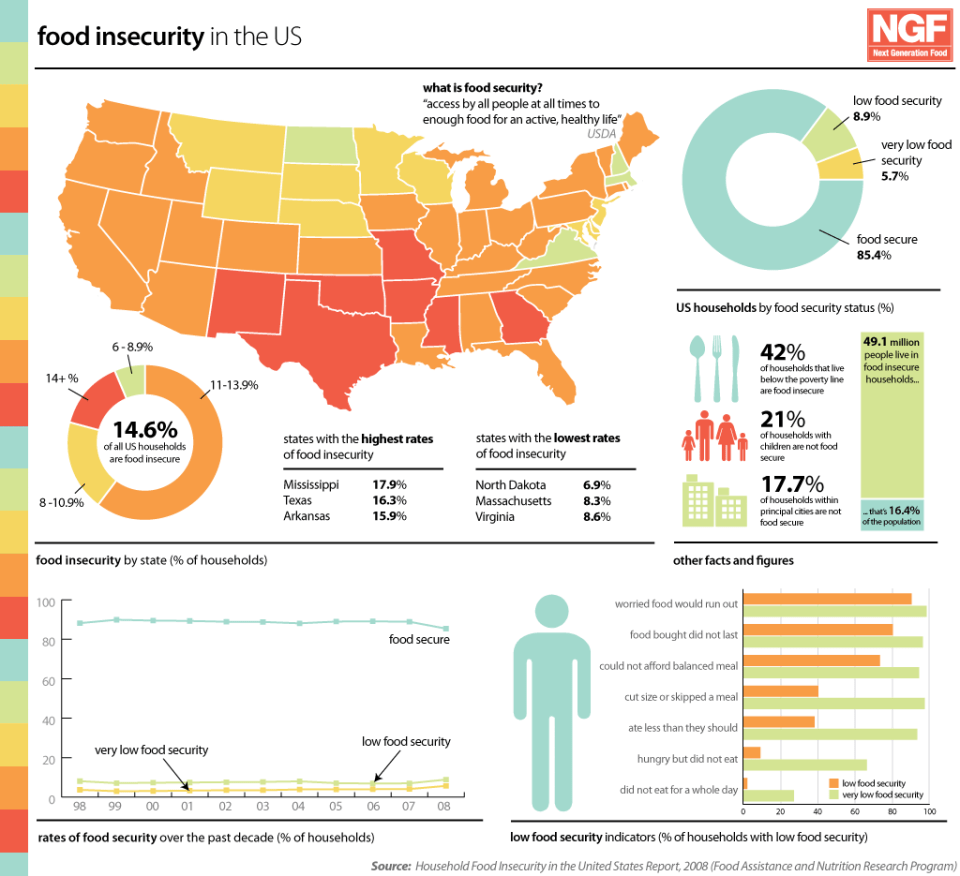
http://www.nextgenerationfood.com/news/food-insecurity-in-the-us/
Highest rates of food insecurity:
Mississippi
Texas
Arkansas
Lowest rates of food insecurity:
North Dakota
Massachusetts
Virginia
Gosh, I wonder where all the black and Hispanic people are? North Dakota, right?
According to the USDA, in a report titled Household Food Security in the United States in 2011, black and Hispanic families are more than twice as likely to experience food insecurity as white families (p. 11).
White 11.4% of families food insecure
Black 25.1%
Hispanic 26.2%
Gosh, I wonder where black and ‘Hispanic’ people are? Mississippi, Texas, and Arkansas right? What is the cause of the food insecurity? Lower intelligence. What is lower intelligence highly correlated with? Obesity.
If you keep in mind the fact that obesity (especially as the result of heavily processed, nutrient deficient junk foods) is also a form of malnutrition, it seems to me that there is an entirely different explanation for why certain racial groups might tend to perform lower on IQ tests.
Sure it is. A big cause for obesity is lowered intelligence (Kanazawa 2007). What he found was that those studies that concluded that obesity causes lowered intelligence only observed cross-sectional studies. Longitudinal studies that looked into the link between obesity and intelligence found that those who had low IQs since childhood then became obese later in life and that obesity does not lead to low IQ. The average IQ for an individual suffering from PWS is 65 (Butler, Lee and Whitman 2006, p. 13), so that is one reason they have a tendency to be obese. He states that those with IQs below 74 gained 5.19 BMI points, whereas those with IQs over above 126 gained 3.73 BMI points in 22 years, which is a statistically significant difference. Also noted, was that those at age 7 who had IQs above 125 had a 13.5 percent chance of being obese at age 51, whereas those with IQs below 74 at age 7 had a 31.9 percent chance of being obese. This clearly shows that those obese individuals who score low on IQ tests, more often than not, are obese because of their intelligence. The lack of ability to delay gratification is also correlated with low IQ (Mischel and Metzner, 1982).
Becoming obese is largely in part related to environmental factors, but there are correlates with obesity and genetic factors, as well as racial and ethnic differences in obesity, which are due, in part, to environmental as well as genetic factors. All of these factors fall back to a) lower intelligence, b) differing physiology and c) differing nutritional habits. Lower IQ is the main reason, though, for these differences which manifest itself as differences in scores of cognitive ability. Those with lower scores than have higher chances of having negative effects in life, such as low SES, higher chance of becoming obese and so on.
Correlation is not causation.
This is the liberals word phrase they use when they cannot contest data and know it so use the same old boring phrase. When you get the same result over and over using the scientific method, then it’s safe to say that the same results and conclusions that get brought up time and time again are real and cannot be explained away by the correlation does not mean causation line.
And furthermore, I haven’t read Richwine’s dissertation, nor do I plan to, so I don’t know if he offered any tentative explanations for his findings.
Didn’t even read it and is giving a critique of it. How does that work?
It looks to me like Richwine is a gigantic racist asshole, because he is using his findings to try and limit the opportunities for Hispanic people to come to the United States, because dumb spics.
Lower IQ people commit more crimes than do higher IQ people. This phenomenon is well-noted that those with lower intelligence commit crime, as the average IQ of a criminal in America, is 85, whereas the average IQ for a juvenile is 92. The average juvenile IQ is higher because more often than not, those who are habitual offenders in childhood become habitual offenders in adulthood, and at adulthood IQ drops from childhood where the environment was able to artificially boost their IQs.
What if I’m right? What if IQ differences are traceable to malnutrition? That would indicate a whole different set of interventions and policies than just turn them away.
You are part right, but that won’t put any big dent in any genetic/phenotypic IQ differences and still, mass immigration from South of the Border still wouldn’t be OK in the first place.
In shutting down the conversation about race and IQ, Harvard students are explicitly saying they don’t WANT to find a reason behind low performance on IQ tests amongst certain racial groups. They don’t CARE why some groups are not reaching their full human potential. They don’t give ONE SINGLE FUCK about anyone other than themselves. It could be as simple as making certain children have access to proper food and nutrition.
I at least give her credit for acknowledging the biological reality of race and the reality of IQ. But she thinks that malnutrition plays too big a part in the ethnic IQ gap than it does in reality.
As I have covered here before, people will do anything they can to deny the validity of IQ tests. However, their explanations cut it.
People who attempt to deny biological differences in intelligence because they strongly predict positive life outcomes will do anything to deny their validity. But that doesn’t change how strong a predictor they are in regards to predicting both positive and negative successes in life.
Those who attempt to deny any differences between races, like Chanda Chisala (I know you can see this Chanda, still waiting for a response to the criticism of your horrible article that “redneck genes” are the cause for the black-white IQ gap), who are wrong in their premises on the cause as well as how to fix the gap. They will do anything to attempt to explain away a gap which is, at least, 50 percent genetic in origin.
The attack on Jason Richwine is because, of course, he’s right. They don’t want to admit he is right so they do whatever they can to discredit his argument, by calling him a ‘racist’. But that doesn’t negate his data, and as seen above, any arguments against Richwine’s dissertation are unfounded.
Germany is going to begin IQ testing their immigrants, why can’t we?
Is There Bias in Mental Testing?
1400 words
Many people who are uneducated about the matter of cognitive abilities tests may say certain things such as “IQ tests are biased towards white males”.”IQ tests don’t test anything of worth” or “IQ is just a number and doesn’t mean anything in life”. All of these are untruths. I will show in this article how and why those aren’t true, as well as showing that IQ is one of the best predictors of success in life.
“IQ Tests Are Biased Towards White Males”
This is my favorite one from IQ deniers. They seem to think that by saying tests are biased towards white males, especially those from the West, that it will invalidate over 100 years of IQ testing and any and all racial gaps concerning them. It doesn’t work like that.
Many deniers may say “They’re (IQ tests) biased towards white males because there are certain words on the test that underprivileged peoples don’t get to learn”. They may say that due to IQ tests having certain words on them that aren’t taught to them in their environments, that they’re biased and don’t accurately assess black American’s intelligence.
But Charles Murray and Richard Herrnstein say in The Bell Curve that those words that only a privileged person would know, which, if I remember the example from the book correctly was something to do with yachts, was removed from IQ tests decades ago, so those points are moot whenever someone brings them up.
If IQ tests were biased towards white males, then why do Ashkenazi Jews score between 107-115? Why do Indian American Immigrants score 112? Why do East Asians score 106?(pg 236) These are questions that people never seem to answer, because it seems that all they were told is that the tests for cognitive ability are biased towards the majority, when no matter where IQ tests are carried out on East Asians, Ashkenazi Jews and Indian immigrants, they score higher than whites every time. How is that explained by a test bias towards the ones it was supposedly invented to assess who was superior in intelligence?
Two years after The Bell Curve came out, a paper was published called Mainstream Science on Intelligence, which corroborated the findings in The Bell Curve. To quote from the publication:
Intelligence tests are not culturally biased against American blacks or other native-born, English-speaking peoples in the U.S. Rather, IQ scores predict equally accurately for all such Americans, regardless of race and social class. Individuals who do not understand English well can be given either a nonverbal test or one in their native language.
Right here, from the publication from 52 signatories from the leading researchers in the field of intelligence all say that IQ tests are not culturally biased at all to those who don’t speak the language, which of course means non-white populations as well as white populations who don’t speak English.
If they were biased towards white males, then we can say that if we put those from different races into white homes, test their IQs at the beginning of the study, and assess IQ at adulthood, we’d be able to see if it was true, if IQ tests were really biased against other races. Well, the Minnesota Transracial Adoption Study happened (pg 256), and the SD gap literally stayed the same at 1.2 SDs.
What the Minnesota Study also tells me is this: it’s clear as day that black mothers are not conducive to an intellectual environment. Why, if black mothers were, would they need to be taken out as a variable and have the black kids be raised by white women? That, in my opinion, should end the debate right there. Seeing as the mother’s IQ is the best predictor of the child’s. Those mixed-race white and black kids with white mothers have higher IQs than those with black mothers. Because the prenatal environment is important to a developing and growing fetus. This should end the debate right where it is, but instead, we still have people who want to push that IQ tests are biased towards white males, which I have shown that it’s not the case at all.
Finally, to quote from the paper Intelligence: Knowns and Unknowns, which was funded by the APA Taskforce, headed by Neisser:
Considered as predictors of future performance, the tests do not seem to be biased against African Americans.
“IQ Tests Don’t Test Anything of Worth”
This is another denialist tactic that those who wish to deny the worth of the IQ test. What they measure are short-term memory, verbal ability, analytical thinking, mathematical ability and spatial reasoning. How anyone can believe that they don’t test anything of worth, even after hearing about what it does test is beyond me. I touched on success in life in regards to IQ in this article. IQ tests do mean a lot to life success, along with personality traits (coming in a future post).
There isn’t that high of a correlation with IQ and monetary success (around .33), so you’re going to find those who have high IQs and not have attained a lot of wealth, whereas you’ll also find those with lower IQs who have attained wealth, due in part to certain personality characteristics, all of which are at least 50 percent heritable.
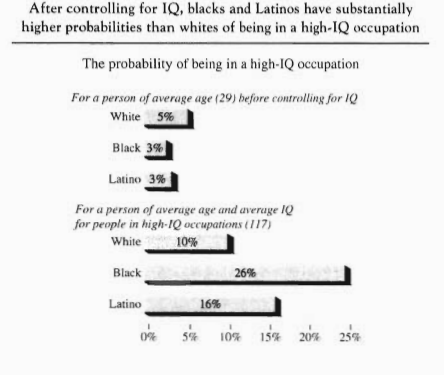
The table above (pg 322, The Bell Curve), shows how after controlling for IQ (IQ 100), that blacks and Hispanics have substantially higher probabilities than whites of being in high IQ occupations (which I would reason that’s due to Affirmative Action).
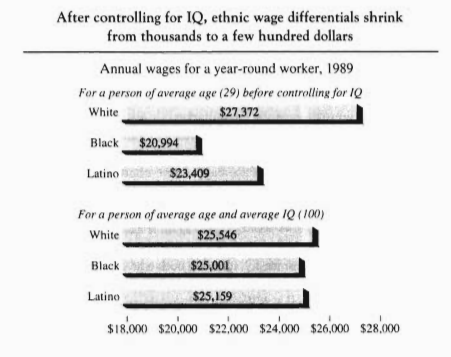
(pg 323) After controlling for IQ, wage differences almost disappear! If America were so racist, why then, do blacks and ‘Latinos’, who are matched for IQ, then make the same amount of money? Almost as if IQ is one of the best predictors of monetary success in life.
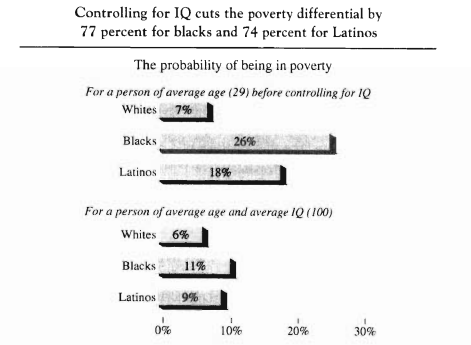
(pg 326) After controlling for IQ, poverty differentials decrease by three-quarters for both ethnic groups. Why is that? Because, as I’m showing with all of these examples, when matching for IQ, gaps substantially shrink, disappear entirely or have those ethnic groups actually have more success than whites when matched for IQ, proves that IQ is one of the most important things in life, due to those with high IQs being able to reason better than those with lower IQs.
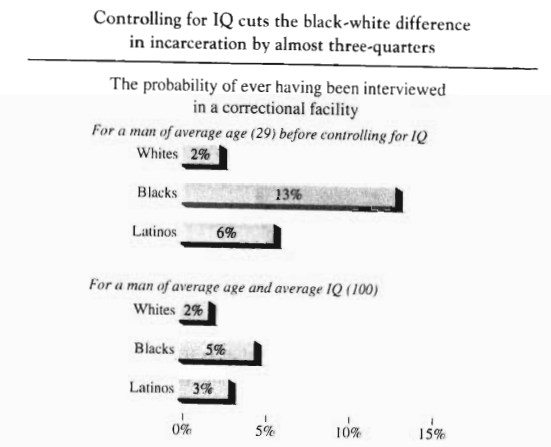
(pg 338) This is one of my favorites. Because we know that average IQ for a criminal is 85, even after all variables are controlled for, the IQ for criminals is still at 85, showing that low cognitive ability is a cause for being incarcerated as well. Showing that the gap disappears by almost three quarters shows, in my opinion, that the remaining incarcerated blacks may have the 2-repeat MAOA-L gene, as well as higher testosterone, are the cause for the remaining quarter who do get incarcerated.
Clearly, IQ tests are so biased that they show all of these things disappear or even reverse with certain variables when IQs are matched at 100 with ethnicity.
So to those who say “IQ is just a number which doesn’t mean anything in life”, you’d have to explain how these things happen when matched for IQ. Did those who get high scores not feel the effects of so-called white supremacy?
I’m sure we’ve heard of the B.I.T.C.H. IQ test before. Which supposedly tests ‘black cultural homogeneity’, but it’s just nonsense, as evidenced by:
Shucking means:
Stone fox means:
T. C. B. means:
“Bo Diddley” is a:
Hattie Mae Johnson is on the Country. She has four children and her husband is now in jail for non-support, as he was unemployed and was not able to give her any money. Her welfare check is now $286 per month. Last night she went out with the highest player in town. If she got pregnant, then nine months from now how much more will her welfare check be?
“Money don’t get everything it’s true.”
These are all actual questions on this ‘so-called IQ test’. What a joke right?
Those who say that IQ tests are biased towards white males, or anyone affluent for that matter, have no idea what they’re talking about. None of what they say has any basis in fact and is clear wishful thinking. If IQ tests were so biased, other races/ethnicity wouldn’t score higher than whites. If IQ tests were so biased, why would those blacks and ‘Latinos’ who score at 100 show certain gaps closing, closed and even had an advantage over whites when matched for IQ (which was due in part to Affirmative Action, obviously)?
Those who say that IQ tests are biased are true ideologues and those views have no basis in reality.
For those who are interested, Arthur Jensen wrote a whole book on this subject.
Refuting Robert Sternberg’s Triarchic Theory of Intelligence
2000 words
I came across this video today from commenter Animekitty on PumpkinPerson’s blog. Animekitty says:
I just happen to think that practicality could be considered a for of intelligence. And that maybe Africans have a form of practicality that is different than the practicality of whites.
Which, as Sternberg explains in the video, sounds a lot to me like visio-spatial intelligence.
His basic thesis is that differing cultures have differing ways in which they quantify intelligence. I will use the examples he uses in the slides in the video.
First, he brings up differing examples of the models of the relationship between culture and intelligence. He brings up Herrnstein and Murray’s model of intelligence, stating that if you want to do a cross-cultural study of intelligence, you would translate the tests of WISC scores between different cultures.
A second model is like Nisbett’s. Using the same translated tests, but the same tests might be involved with different structures and different processes. He says that in Nisbett’s model, differing cultures will see the same things in a differing way, i.e., someone from Asia will what you may see as the background, they may see as the foreground and vice versa.
The third model which Sternberg uses is that there is a common form of intelligence, meaning they have to see what is going on in their lives. Defining their problems, mentally represent them and then allocate resources for a solution, set up a strategy, solve it and model it after your solution. He says the tests you would use would differ in the age of the person.
In model four which is the extreme end of model 1, is that everything is relative. The structures and processes of intelligence and structures are different. Basically, wherever you go you have to start over with different tests between cultures.
- Children and adults may be able to do tasks in one cultural/biological context but not in another.
He cites the Nunes study, where Nunes noted that Brazilian street children show that in one context, kids could do the math on the street, but giving them the same thing in a different context, they can’t solve the problems.So it suggests what would seem to be a test depends on the given context.
This was also noted in a study by Lave (1988), who had housewives wherein they were given math problems in the supermarket and were able to do them correctly, but gave differing answers under a different situation.
Some good evidence here. This could also be used as evidence that ‘women aren’t really all that bad at math’. There is currently no evidence to support or refute his theory, but I’m pretty sure I can show where his thinking is due to renaming of processes that we already know.
2. Students may develop contextually important skills at the expense of academic ones.
He cites the study: The Relationship between Academic and Practical Intelligence: A Case Study in Kenya, in which he says:
We suggest that, among these villagers, time spent developing academic skills may be perceived as taking away from time that needs to be spent developing practical skills and vice versa. The result is that academic and practical intelligence can develop independently or even at odds with one another.
Seeing as those academic skills correlate highly with a nation’s success or lack thereof, it’s clear that they don’t have the brain power to understand academic things, and therefore gravitate towards something they can understand with their lower IQs.
He then references a study on Kenyan children in a village called Luo. They collected 91 plant remedies from mothers and found that it was shared knowledge that the elders also knew, as well as the children. They’re able to memorize a lot of natural remedies to combat parasitic diseases. He uses this study to say that intelligence is dependent on cultural contexts, and therefore cannot be measured between cultures due to differing definitions of intelligence in those certain cultural contexts.
He says that in our societies, knowledge of natural remedies has no basis in our society. Conversely, those children in Nigeria have to worry about surviving and not school. So Sternberg says that in their cultural context, intelligence is knowing natural remedies to parasitic diseases.
This next part made me laugh. One of the questions on the test was:
“A small child in your family has Homa. She has a sore throat, headache and fever. She has been sick for three days. Which of the following Yadh Nyaluo (Luo herbal medicines) can treat Homa?
i. Chamama. Take the lead and sniff fito (medicine up to nose to sneeze out the illness.)
ii. Kaladali. Take the leaves, drink and fito.
iii. Obuo. Take the leaves and fito.
iv. Ogaka. Take the roots, pound and drink.
v. Ahundo. Take the leaves and fito.
This reminded me so much of the B.I.T.C.H. IQ test (yes, that’s the real name). There are ridiculous questions such as:
“Alley Apple is”
“”I know you, shame” means”
“Main Squeeze means”
“A “handkerchief head” is:”
Which are ridiculous questions in terms of an IQ test. When people say that tests are ‘culturally biased’, I don’t think they mean to use complete gibberish and bastardizing the English language to show that there is a ‘cultural bias’ with IQ tests. There isn’t. Even then, Raven’s Progressive Matrices eliminates any so-called ‘cultural bias’.
Those questions are ridiculous and have nothing to do with intelligence. Of course if you use differing variables for all cultures/societies, you will say hey!! Everyone is smart, no one is dumb! Which has no basis in reality.
3. Students have substantial practical skills that go unrecognized in academic tests.
He cites a study done on a Yup’ik Alaskan community, in which he says that differing peoples will have differing academic and practical skills.
He shows a question from that test, which is similar to the one I have shown above about the Yup’ik villagers. He says that the point is, is what’s hard is in the context of how you grew up. That those who grew up in rural areas would know the answer to the question in comparison to those from urban areas. They found that urban students outperformed Yup’ik students on academic tests. But Yup’ik children outscored urban children on the Yup’ik intelligence test. The urban kids do better on the academic tests, where the Yup’ik kids do better on the practical intelligence tests. He says you have to know certain things for your certain environment you’re in.
The findings were that academic intelligence modestly predicted adaptive skills but not hunting skills in the urban and rural communities. On the other hand, practical intelligence modestly predicted adaptive skills and moderately predicted hunting skills in the rural communities but not the urban ones.
He says the Yup’ik kids know how to get from point A to point B that might be 100 miles away in the tundra in the winter and they’ll get there. If the teachers tried to do the same, they’d die. The kids have this tremendous skill set relative to their environment. To succeed in their textbooks, you don’t need to do those certain things in their environment.
This reminded me of the Inuit. They have the same brain size as East Asians, due to being one of the peoples from one of the 3 migrations from Siberia into the Americas, but they only have a 91 IQ despite living in one of the coldest climates in the world. Richard Lynn attributes this to them having a small population. Those who have bigger populations have more chance for certain mutations to arise and be selected for. People have marveled at their ability to track where they were and how they got around the tundra. This is visio-spatial ability at work.
It seems like he’s trying to say that there no fit or unfit individuals for any given environment, only what is defined as ‘intelligence’ is different in each society, but as I am showing you, they all go back to the g factor, or general intelligence.
4. Practical intellectual skills may be better predictors of health than academic ones.
Wrong. He says that practical intelligence is different in different places. Practical intelligence is just as good as academic intelligence in terms of health in his eyes.
Whatever the case may be, actual g, is one of the best predictors of your longevity in life.
5. Teachers evaluations of students are constrained by their concepts of intelligence.
He cites his study Intelligence and culture: how culture shapes what intelligence means, and the implications for a science of well-being. In which he says:
It is important to realize, again, that there is no one overall US conception of intelligence. Indeed, Okagaki & Sternberg (1993) found that different ethnic groups in San Jose, CA, had rather different conceptions of what it means to be intelligent. For example, Latino parents of schoolchildren tended to emphasize the importance of socialcompetence skills in their conceptions of intelligence, whereas Asian parents tended rather heavily to emphasize the importance of cognitive skills. ‘White’ parents also emphasized cognitive skills more. Teachers, representing the dominant culture, emphasized cognitive skills more than social-competence skills. The rank order of children of various groups’ performance (including subgroups within the Latino and Asian groups) could be perfectly predicted by the extent to which their parents shared the teachers’ conception of intelligence. In other words, teachers tended to reward those children who were socialized into a view of intelligence that happened to correspond to the teachers’ own. However, social aspects of intelligence, broadly defined, may be as important as or even more important than cognitive aspects of intelligence in later life. Some, however, prefer to study intelligence not in its social aspect, but in its cognitive one.
With the ‘Latino’ mention, he’s describing verbal intelligence, just like in the Yup’ik example, he was describing visio-spatial IQ. White parents emphasize cognitive skills more because they are wired to do so, on average.
6. Students learn mathematics if taught in a culturally relevant way.
He says when Alaskan Yup’ik kids were taught geometry using fish racks, they outperformed students who were taught the same concepts conventionally. This, again, back to visio-spatial ability. They are able to imagine their surroundings and remember where they were, giving them an advantage.
7. It is possible to assess in the US in ways that increase prediction and reduce multicultural differences.
He showed 2 different creative writing essays. He showed differing examples of creative writing and verbal ability. He says that in terms of predicting first-year GPA, with adding the of creative and practical, they doubled prediction of performance.
He then shows the amount of each measure that is predicted by racial/ethnic differences. He says Asians do better on the math section, whites do better on the verbal, all of which is known and is caused by differences in visio-spatial and verbal intelligence between the races.
On the analytical tests, blacks, ‘Latino’ and American Indian groups didn’t do as well, but the Native American groups did better on oral storytelling, which makes sense due to their culture and how they evolved.
8. How schooling got to where it is.
He uses some crazy example. Saying that if you only allow students by height into college, that if you do a study 30 years later, with the model of Hernnstein and Murray, you will find that height is correlated with IQ (it is). But that’s a really bad example to use here.
All in all, Sternberg attempts to generalize abilities that fall in the g factor and explain them away as something else entirely, not realizing that everything he is explaining is already explained by the general intelligence factor.
A few years ago when I first got in to race differences, someone I was talking to about this did say “well, based on cultural differences, intelligence is different depending on the context and situations you put it in”. So I thought it was funny that someone had a talk on it. Clearly, he’s wrong.
He’s attempting to say that in differing contexts, we’re all smart or dumb in some capacity or another. Which is true to a point, but the g factor says otherwise.
You could also explain Sternberg’s theory as not looking at intelligence, but looking at personality differences and how they manifest and help the intelligence in that certain culture/society.
All of the examples he cited fall on the g factor, not anything else.
Ethnicity and Obesity Rates
1400 words
Figured I would take some time to talk about some Racial-Ethnic Disparities in obesity, and for as of right now (while the populations still show differentiation, it will be way different for all ethnic groups in 20 years with 9 out of 10 people being obese or overweight, and I would assume it would show the same levels of it in all populations), the ethnic-racial differences in the pattern as they apply to HBD.
To quote from the Food, Research and Action Clinic, which just did an overview of studies from the last year on the percentage, as well as racial-ethnic disparities on obesity:
Recent national data show that 82.0 percent of Black women and 77.2 percent of Hispanic women are overweight or obese compared to 63.2 percent of White women (Ogden et al., 2014).
Women as a whole are more likely to carry more fat mass than men, especially in their hips and around their waste, as estrogen distributes fat more around hips and the lower body, as it’s better for childbearing.
In addition, over half of Black women are obese (versus 37.1 percent of Black men and 32.8 percent of White women) (Ogden et al., 2014). Extreme obesity continues to be higher among women (8.3 percent) than men (4.4 percent), especially among Black women who have more than double the rates of extreme obesity as White and Hispanic women (16.4 percent versus 7.4 percent and 7.6 percent) (Ogden et al., 2014).
Black women have a higher rate of super obesity (over 40 percent BMI) due to EBT and other programs where they are able to buy high fat, high carb foods, which obviously leads to more weight gain. Double the fact that they are women and genetically predisposed to carry more fat than men, and you have your answer.
There is also a genetic component, which I will get in to later.
Rates of overweight or obesity are higher for Hispanic men (78.6 percent) compared to Black men (69.2 percent) and White men (71.4 percent) (Ogden et al., 2014).
Definite genetics at play here, with Hispanic men having a higher rate than black or Hispanic men. Studies show that Hispanics have fat-hoarding genes left over from their ancestors, genes that were required to live through cycles of feast and famine, which obviously have deleterious effects today. (Type 2 Diabetes goes hand in hand with obesity, which I will cover in a future post.)
This also goes to people who say that there are no genetic causalities for obesity, sure kcal in and kcal out are king, but it’s ignorant to think that there are no genetic causes for obesity.
There is a gene that is associated with waist circumference, as well as insulin resistance. Asian Americans have that, which also is a cause for obesity. Also, that same MCR4 sequence has been linked to binge eating.
Now to talk about some genes associated with obesity in African Americans.
In a study published back in 2013, researchers were looking for obesity genes in African Americans. The study, which involved more than 70,000 men and women of African descent, they were able to identify 3 SNPs that were associated with obesity and BMI in the sample population. What was also found, was that those same genetic sequences also heighten rates of obesity in peoples with no African ancestry, all of the genetic variants associated with obesity were also found in European populations. The same genes found in African populations did the same in European populations, and vice versa.
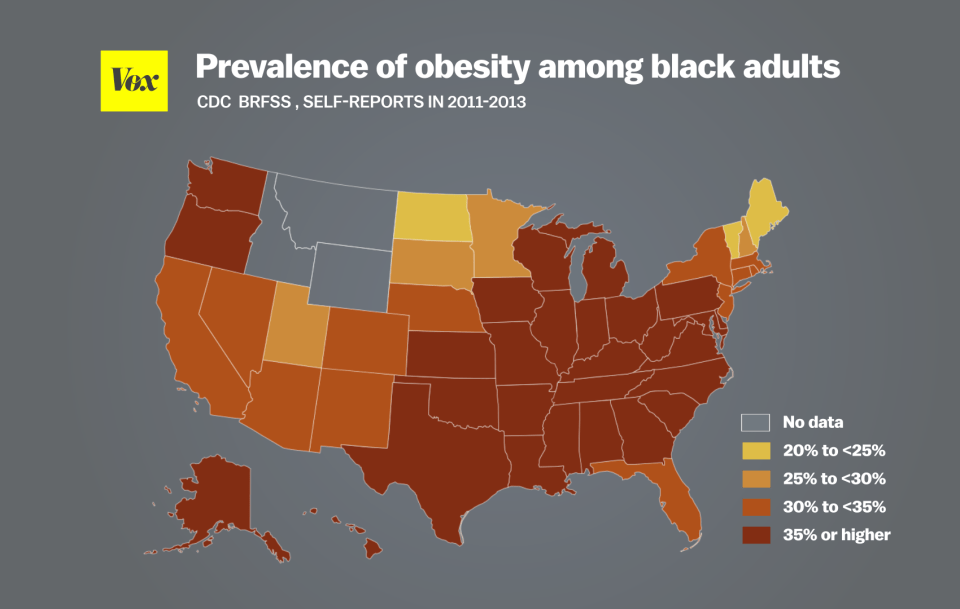
The map shown above shows obesity rates among black adults. Of course, where blacks are most prevalent, the southeast shows higher concentrations of obesity, of course, environmental factors are at play here (with ‘soul food’ being super high in fat and carbs, which make you hungry sooner).

This map shows the obesity rate of whites in America. Notice how most of the concentration of obese whites is in the southeast of America, which correlates with the lower IQ average of those states as seen in the map of IQ by State.
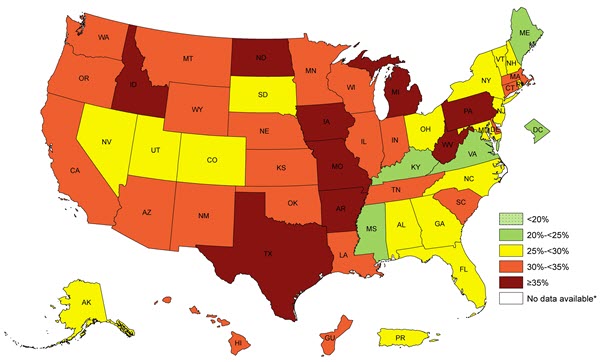
The above map shows obesity rates for Hispanics in America, again, matching up to where the majority of Hispanics in America are, furthering the causality of low IQ (see map).
Notice how there is no Asian obesity map? That’s because of their higher average IQ. Asian countries have some of the lowest prevalence of obesity and being overweight worldwide. Though, that is changing with a more ‘Americanized’ Asia, us bringing our shit lifestyle habits to other countries will increase the overall prevalence of obesity in the world, as well as America.

You can see the average IQ scores by State that it roughly matches up with all 3 maps. It’s not a coincidence. Lower IQ people don’t grasp what they are doing to their bodies by eating so much, leading to higher rates of obesity. I have already touched on how high fat diets slow microglia, which eats neuron connections in the brain, which is, yet again, another cause for lower IQ in obese/overweight people.
On top of some genetic reasons for obesity and predisposing populations to obesity, there are also environmental effects which cause differing levels in the populations. Socioeconomic status has a say as well (which is one of the only times this is applicable).
With differing levels of government assistance in groups, the more people who get government assistance are, for the most part, on the left side of the Bell Curve, which in turn means that they have a higher chance of being obese or overweight, due to low intellect. Low intelligence is correlated with abstract thought, so the low IQ person won’t be able to see what they are doing to their bodies in the now as well as into the future. That is the relationship between IQ and obesity.
Kanazawa also found, looking at a nationally representative sample of white Britons, (n=10,000), that IQ measured in childhood predicts obesity by age 51. (I will make a longer post on IQ and obesity in the future.)
Also, in a study that came out last month, when diets make us overweight/obese, it prompts normally active cells in our brain called ‘microglia’ to stop moving around so much and actually consume pathways to our neurons, which of course can sap intellect.
Percent of population on Food Stamps by Race:
White: 8.6%
Black: 43.8%
Hispanic: 17%
As you can see here, blacks have the highest rate of receiving food stamps in the country. The above quote is taken from the link.
It doesn’t follow the obesity trends of 67.3% for whites, 75.6% for blacks, and 77.9% for Hispanics, genetic factors take care of the rest for Hispanics to show their numbers in the obesity statistics. Obviously, we are being bombarded with tons of ads a day, telling us to eat all of this unhealthy food, and who is more likely to be home and not at work? Blacks and Hispanics. So that propaganda from the TV effects them more, to eat this or drink that, and they give in, due to their low IQ (which I have linked 2 Kanazawa studies to show reasons why).
In a meta-analysis of 140,525 people, they found the heritability of BMI was .75 to .82. So we can see that heritability of BMI is pretty large.
The causes for race/ethnic differences in obesity are partly genetic and partly environmental (socioeconomic), one would reason, in equal environments, that we would see Hispanics take the top spot, with blacks following behind and finally whites.
The greater your IQ, the lower your weight. Researchers found that people with a BMI of 20 or less were able to recall 56 percent of words in a vocabulary test while those with a BMI over 30 could only recall 44 percent. This directly goes hand in hand with my other link about microglia.
In this study, the cohort members who became obese had low IQ, as expected. Obese cohort members showed no excess decline in IQ, they instead had lower IQ since childhood. Further proving the low IQ/obesity correlation.
By 2020, 75 percent of Americans will be obese or overweight and by 2020, 80 percent of men are going to be overweight or obese. Now, the cause of these trends going up are due to more illegal/legal immigration from the south of the border. Though, without that, we would still be on our way to being a super obese country, because of the dysgenic effects in all populations, which cause a drop in IQ, which causes a gain in weight. Not to mention the propaganda that gets put to kids to want to eat sugary, unhealthy things.
