
Home » Posts tagged 'IQ' (Page 3)
Tag Archives: IQ
The “Fade-Out Effect”
2050 words
The “fade-out effect” occurs when interventions are given to children to increase their IQs, such as Head Start (HS) or other similar programs. In such instances when IQ gains are clear, hereditarians argue that the effect of the interventions “washes” away or “fades out.” Thus, when discussing such studies, hereditarians think they are standing in victory. That the effects from the intervention fade away is taken to be evidence for the hereditarian position and is taken to refute a developmental, interactionist position. However, that couldn’t be further from the truth.
Think about where the majority of HS individuals come from—poorer environments and which are more likely to have disadvantaged people in them. Since IQ tests—along with other tests of ability—are experience-dependent, then it logically follows that one who is not exposed to the test items or structure of the test, among other things, will be differentially prepared to take the test compared to, say, middle-class children who are exposed to such items daily.
When it comes to HS, for instance, whites who attend HS are “significantly more likely to complete high school, attend college, and possibly have higher earnings in their early twenties. African-Americans who participated in Head Start are less likely to have been booked or charged with a crime” (Garces, Thomas, and Currie, 2002). Deming (2009) shows many positive health outcomes in those who attend HS. This is beside the case, though (even if we accept the hereditarian hypothesis here, there are still many, many good reasons for programs such as HS).
Just as Protzko (2016) argues that IQ score gains “fade away” after adolescence, so, too, Chetty et al (2011) who write:
Students who were randomly assigned to higher quality classrooms in grades K–3—as measured by classmates’ end-of-class test scores—have higher earnings, college attendance rates, and other outcomes. Finally, the effects of class quality fade out on test scores in later grades, but gains in noncognitive measures persist.
So such gains “faded out”, therefore hereditarianism is a more favorable position, right? Wrong.
Think about test items, and testing as a whole. Then think about differing environments that social classes are in. Now, thinking about test items, think about how exposure to such items and similar questions would have an effect on the test-taking ability of the individual in question. Thus, since tests of ability are experience-dependent, then the logical position to hold is that if they are exposed to the knowledge and experience needed for successful test-taking then they will score higher. And this is what we see when such individuals are enrolled in the program, but when the program ends and the scores decrease, the hereditarian triumphs that it is another piece of the puzzle, another piece of evidence in favor of their position. Howe (1997: 53) explains this perfectly:
It is an almost universal characteristic of acquired competences that when their is a prolonged absence of opportunities to use, practise, and profit from them, they do indeed decline. It would therefore be highly surprising if acquired gains in intelligence did not fade or diminish. Indeed, had the research findings shown that IQs never fade or decline, that evidence would have provided some support for the view that measured intelligence possesses the inherent — rather than acquired — status that intelligence theorists and other writers within the psychometric position have believed it to have.
A similar claim is made by Sauce and Matzel (2018):
In simpler terms, the analysis of Protzko should not lead us to conclude that early intervention programs such as Head Start can have no long-term benefits. Rather, these results highlight the need to provide participants with continuing opportunities that would allow them to capitalize on what might otherwise be transient gains in cognitive abilities.
Now, if we think in the context of the HS and similar interventions, we can see why such stark differences in scores appear, and why some studies show a fade out effect. Such new knowledge and skills (what IQ tests are tests of; Richardson, 2002) are largely useless in those environments since they have little to no opportunity to hone their newly-acquired skills.
Take success in an action video game, weight-lifting, bodybuilding (muscle-gaining), or pole-vaulting. One who does well in any one of these three events will of course have countless of hours of training learning new techniques and skills. They continue this for a while. Then they abruptly stop. They are no longer honing (and practicing) their acquired skills so they begin to lose them. The “fade-out effect” has affected their performance and the reason is due to their environmental stimulation—the same holds for IQ test scores.
I’ll use the issue of muscle-building to illustrate the comparison. Imagine you’re 20 years old and just start going to the gym on a good program. The first few months you get what are termed “newbie gains”, as your body and central nervous system begins to adapt to the new stressor you’re placing on your body. Then after the initial beginning period, at about 2 to 3 months, these gains eventually stop and then you’ll have to be consistent with your training and diet or you won’t progress in weight lifted or body composition. But you are consistent with training and diet and you then have a satisfactory body composition and strength gains.
But then things change you stop going to the gym as often as you did before and you get lazy with your nutrition. Your body composition you worked so hard for along with your strength gains start to dissipate since you’re not placing your body under the stressor it was previously under. But there is something called “muscle memory” which occurs due to motor learning in the central nervous system.
The comparison here is clear: strength is IQ and lifting weights is doing tests/tasks to prepare for the tests (exposure to middle-class knowledge and skills). So when one leaves their “enriching environments” (in this case, the gym and a good nutritional environment), they then lose the gains they worked for. The parallel then becomes clear: leave the enriched environments and return to the baseline. This example I have just illustrated shows exactly how and why these gains “fade out” (though they don’t in all of these types of studies).
One objection to my comparison I can imagine an IQ-ist making is that training for strength (which is analogous to types of interventions in programs like HS), one can only get so strong as, for example, their frame allows, or that there is a limit to which one only get to a certain level of musculature. They may say that one can only get to a certain number of IQ and there, their “genetic potential” maxes out, as it would in the muscle-building and strength-gaining example. But the objection fails. Tests of ability (IQ tests) are cultural in nature. Since they are cultural in nature, then exposure to what’s on the test (middle-class knowledge and skills) will have one score better. That is, IQ tests are experience-dependent, as is body composition and strength, but such tests aren’t (1) construct valid and (2) such tests are biased due to the items selected to be on them. When looking at weights, we have an objective, valid measure. Sure, weight-lifting measures a whole slew of variables including, what it is intended to, strength. But it also measures a whole slew of other variables associated with weight training, dependent on numerous other variables.
Therefore, my example with weights illustrates that if one removes themselves from their enriching environments that allows X, then they will necessarily decline. But due to, in this example, muscle memory, they can quickly return to where they were. Such gains will “fade out” if, and only if, they discontinue their training and meal prep, among other things. The same is true for IQ in these intervention studies.
Howe (1997: 54-55) (this editorial here has the discussion, pulled directly from the book) discusses the study carried out by Zigler and Seitz. They measured the effects of a four year intervention program which emphasized math skills. They were inner-city children who were enrolled in the orgrwm at kindergarten. The program was successful, in that those who participated in the program were two years ahead of a control group, but a few heads after in a follow-up, they were only a year ahead. Howe (1997:54-55) explains why:
For instance, to score well at the achievement tests used with older children it is essential to have some knowledge of algebra and geometry, but Seitz found that while the majority of middle-class children were being taught these subjects, the disadvantaged pupils were not getting the necessary teaching. For that reason they could hardly be expected to do well. As Seitz perceived, the true picture was not one of fading ability but of diminishing use of it.
So in this case, the knowledge gained from the intervention was not lost. Do note, though, how middle-class knowledge continues to appear in these discussions. That’s because tests of ability are cultural in nature since culture-fair impossible (Cole, 2004). Cole imagines a West African Binet who constructs a test of Kpelle culture. Cole (2004) ends up concluding that:
tests of ability are inevitably cultural devices. This conclusion must seem dreary and disappointing to people who have been working to construct valid, culture-free tests. But from the perspective of history and logic, it simply confirms the fact, stated so clearly by Franz Boas half a century ago, that “mind, independent of experience, is inconceivable.”
So, in this case, the test would be testing Kpelle knowledge, and not middle-class cultural skills and knowledge, which proves that IQ tests are bound by culture and that culture-fair (“free”) tests are impossible. This, then, also shows why such gains in test scores decrease: they are not in the types of environments that are conducive to that type of culture-specific knowledge (see some examples of questions on IQ tests here).
The fact is the matter is this: that the individuals in such studies return to their “old” environments is why their IQ gains disappear. People just focus on the scores, say “They decreased”—hardly without thinking why. Why should test scores reflect the efficacy of the HS and similar programs and not the fact that outcomes for children in this program are substantially better than those who did not participate? For example:
HS compared to non-HS children faired better on cognitive and socio-emotive measures having fewer negative behaviors and (Zhai et al, 2011). Adults who were in the HS program are more likely to graduate high school, go to college and receive a seconday degree (Bauer and Schanzenbach, 2016). A pre-school program raised standardized test scores through grade 5. Those who attended HS were less likely to become incarcerated, become teen parents, and are more likely to finish high-school and enroll in college (Barr and Gibs, 2017).
The cause of the fading out of scores is simple: if you don’t use it you lose it, as can be seen with the examples given above. IQ scores can and do increase is evidenced by the Flynn effect, so that is not touched by the fade-out effect. But this “fading-out” (in most studies, see Howe for more information) of scores, in my opinion, is ancillary to the main point: those who attend HS and similar programs do have better outcomes in life than those who did not attend. The literature on the matter is vast. Therefore, the “fading-out” of test scores doesn’t matter, as outcomes for those who attended are better than outcomes for those who do not.
HS and similar programs show that IQ is, indeed, malleable and not “set” or “stable” as hereditarians claim. That IQ tests are experience-dependent implies that those who receive such interventions get a boost, but when they leave their abilities decrease, which is due to not learning any new ones along with returning to their previous, less-stimulating environments. The cause of the “fading-out” is therefore simple: During the intervention they are engrossed in an enriching environment, learning about, by proxy, middle-class knowledge and skills which helps with test performance. But after they’re done they return to their previous environments and so they do not put their skills to use and they therefore regress. Like with my muscle-building example: if you don’t use it, you lose it.
Test Validity, Test Bias, Test Construction, and Item Selection
3400 words
Validity for IQ tests is fleeting. IQ tests are said to be “validated” on the basis of performance with other IQ tests and that of job performance (see Richardson and Norgate, 2015). Further, IQ tests are claimed to not be biased against social class or racial group. Finally, through the process of “item selection”, test constructors make the types of distributions they want (normal) and get the results the want through the subjective procedure of removing items that don’t agree with their pre-conceived notions on who is or is not “intelligent.” Lastly, “intelligence” is descriptive measure, not an explanatory concept, and treating it like an explanatory measure can—and does—lead to circularity (of which is rife in the subject of IQ testing; see Richardson, 2017b and Taleb’s article IQ is largely a psuedoscientific swindle). This article will show that, on the basis of test construction, item analysis (selection and deselection of items) and the fact that there is no theory of what is being measured in so-called intelligence tests that they, in fact, do not test what they purport to.
Richardson (1991: 17) states that “To measure is to give … a more reliable sense of quantity than our senses alone can provide”, and that “sensed intelligence is not an objective quantity in the sense that the same hotness of a body will be felt by the same humans everywhere (given a few simple conditions); what, in experience, we choose to call ‘more’ intelligence, and what ‘less’ a social judgement that varies from people to people, employing different criteria or signals.” Richardson (1991: 17-18) goes on to say that:
Even if we arrive at a reliable instrument to parallel the experience of our senses, we can claim no more for it than that, without any underlying theory which relates differences in the measure to differences in some other, unobserved, phenomena responsible for those differences. Without such a theory we can never be sure that differences in the measure correspond with our sensed intelligence aren’t due to something else, perhaps something completely different. The phenomenon we at first imagine may not even exist. Instead, such verification most inventors and users of measures of intelligence … have simply constructed the source of differences in sensed intelligence as an underlying entity or force, rather in the way that children and naïve adults perceive hotness as a substance, or attribute the motion of objects to a fictitious impetus. What we have in cases like temperature, of course, are collateral criteria and measures that validate the theory, and thus the original measures. Without these, the assumed entity remains a fiction. This proved to be the case with impetus, and with many other naïve conceptions of nature, such as phlogiston (thought to account for differences in health and disease). How much greater such fictions are likely to be unobserved, dynamic and socially judged concepts like intelligence.
Richardson (1991: 32-35) then goes on to critique many of the old IQ tests, in that they had no way of being construct valid, and that the manuals did not even discuss the validity of the test—it was just assumed.
If we do not know what exactly is being measured when test constructors make and administer these tests, then how can we logically state that “IQ tests test intelligence”? Even Arthur Jensen admitted that psychometricians can create any type of distribution they please (1980: 71); he tacitly admits that tests are devised through the selection and deselection of items on IQ tests that correspond to the test constructors preconceived notions on what “intelligence” is. This, again, is even admitted by Jensen (1980: 147-148) who writes “The items must simply emerge arbitrarily from the heads of test constructors.”
We know, to build on Richardson’s temperature example, that we know exactly is what being measured when we look at the amount of mercury in a thermometer. That is, the concept of “temperature” and the instrument to measure it (the thermometer) were verified independently, without circular reliance on the thermometer itself (see Hasok Chang’s 2007 book Inventing Temperature). IQ tests, on the other hand, are, supposedly, “validated” through measures of job performance and correlations with other, previous tests assumed to be (construct) valid—but they were, of course, just assumed to be valid, it was never shown.
For another example (as I’ve shown with IQ many times) of a psychological construct that is not valid is ASD (autism spectrum disorder). Waterhouse, London, and Gilliberg (2016) write that “14 groups of findings reviewed in this paper that together argue that ASD lacks neurobiological and construct validity. No unitary ASD brain impairment or replicated unitary model of ASD brain impairment exists.” That a construct is valid—that is, it tests what it purports to, is of utmost importance to test measurement. Without it, we don’t know if we’re measuring something else completely different from what we hope—or purport—to.
There is another problem: the fact that, for one of the most-used IQ tests that there is no underlying theory of item selection, as seen in John Raven’s personal notes (see Carpenter, Just, and Shell, 1990). Items on the Raven were selected based on Raven’s intuition, and not any formal theory—the same can be said about, of course, modern-day IQ tests. Carpenter, Just, and Shell (1990) write that John Raven “used his intuition and clinical experience to rank order the difficulty of the six problem types . . . without regard to any underlying processing theory.”
These preconceived notions on what “intelligence” is, though, fail without (1) a theory of what intelligence is (which, as admitted by Ian Deary (2001), there is no theory of human intelligence like the way physics has theories); and (2) what ultimately is termed “construct validity”—that a test measures what it purports to. There are a few kinds of validity: and what IQ-ists claim the most is that IQ tests have predictive validity—that is, they can predict an individual’s outcome in life, and job performance (it is claimed). However, “intelligence” is “a descriptive measure, not an explanatory concept … [so] measures of intelligence level have little or no predictive value” (Howe, 1988).
Howe (1997: ix) also tells us that “Intelligence is … an outcome … not a cause. … Even the most confidently stated assertions about intelligence are often wrong, and the inferences that people have drawn from those assertions are unjustified.”
The correlation between IQ and school performance, according to Richardson (1991: 34) “may be a necessary aspect of the validity of tests, but is not a sufficient one. Such evidence, as already mentioned, requires a clear connection between a theory (a model of intelligence), and the values on the measure.” But, as Richardson (2017: 85) notes:
… it should come as no surprise that performance on them [IQ tests] is associated with school performance. As Robert L. Thorndike and Elizabeth P. Hagen explained in their leading textbook, Educational and Psychological Measurement, “From the very way in which the tests were assembled [such correlation] could hardly be otherwise.”
Gottfredson (2009) claims that the construct validity argument against IQ is “fallacious”, noting it as one of her “fallacies” on intelligence testing (one of her “fallacies” was the “interactionism fallacy”, which I have previously discussed). However, unfortunately for Gottfredson (2009), “the phenomena that testers aim to capture” are built into the test and, as noted here numerous times, preconceived by the constructors of the test. So, Gottfredson’s (2009) claim fails.
Such kinds of construction, too, come into the claim of a “normal distribution.” Just like with preconceptions of who is or is not “intelligent” on the basis of preconceived notions, the normal distribution, too, is an artifact of test construction, along the selection and deselection of items to conform with the test constructors’ presuppositions; the “bell curve” of IQ is created by the presuppositions that the test constructors have about people and society (Simon, 1997).
Charles Spearman, in the early 1900s, claims to have found a “general factor” that explains correlations between different tests. This positive manifold he termed “g” for “general intelligence.” Spearman stated “The (g) factor was taken, pending further information, to consist in something of the nature of an ‘energy’ or ‘power’…” (quoted in Richardson, 1991: 38). The refutation of “g” is a simple, logical, one: While a correlation between performances “may be a necessary requirement for a general factor … it is not a sufficient one.” This is because “it is quite possible for quite independent factors to produce a hierarchy of correlations without the existence of any underlying ‘general’ factor (Fancer, 1985a; Richardson and Bynner, 1984)” (Richardson, 1991: 38). The fact of the matter is, Spearman’s “g” has been refuted for decades (and was shown to be reified by Gould (1981), and further defenses of his concepts on “general intelligence”, like by Jensen (1998) have been refuted, most forcefully by Peter Schonemann. Though, “g” is something built into the test by way of test construction (Richardson, 2002).
Castles (2013: 93) notes that “Spearman did not simply discover g lurking in his data. Instead, he chose one peculiar interpretation of the relationships to demonstrate something in which he already believed—unitary, biologically based intelligence.”
So what explains differences in “g”? The same test construction noted above along with differences in social class, due to stress, self-confidence, test preparedness and other factors correlated with social class, termed the “sociocognitive-affective nexus” (Richardson, 2002).
Constance Hilliard, in her book Straightening the Bell Curve (Hilliard, 2012), notes that there were differences in IQ between rural and urban white South Africans. She notes that differences between those who spoke Afrikaans and those who spoke another language were completely removed through test construction (Hilliard, 2012: 116). Hilliard (2012) notes that if the tests that the constructors formulate don’t agree with their preconceived notions, they are then thrown out:
If the individuals who were supposed to come out on top didn’t score highly or, conversely, if the individuals who were assumed would be at the bottom of the scores didn’t end up there, then the test designers scrapped the test.
Sex differences in “intelligence” (IQ) have been the subject of some debate in the early-to-mid-1900s. Test constructors debated amongst themselves what to do about such differences between the sexes. Hilliard (2012) quotes Harrington (1984; in Perspectives on Bias in Mental Testing) who writes about normalizing test scores between men and women:
It was decided [by IQ test writers] a priori that the distribution of intelligence-test scores would be normal with a mean (X=100) and a standard deviation (SD=15), also that both sexes would have the same mean and distribution. To ensure the absence of sex differences, it was arranged to discard items on which the sexes differed. Then, if not enough items remained, when discarded items were reintroduced, they were balanced, i.e., for every item favoring males, another one favoring females was also introduced.
While Richardson (1998: 114) notes that test constructors had two choices when looking at sex differences in the items they administered to the sexes:
One who would construct a test for intellectual capacity has two possible methods of handling the problem of sex differences.
1 He may assume that all the sex differences yielded by his test items are about equally indicative of sex differences in native ability.
2 He may proceed on the hypothesis that large sex differences on items of the Binet type are likely to be factitious in the sense that they reflect sex differences in experience or training. To the extent that this assumption is valid, he will be justified in eliminating from his battery test items which yield large sex differences.
The authors of the New Revision have chosen the second of these alternatives and sought to avoid using test items showing large differences in percents passing. (McNemar 1942:56)
Change “sex differences” to “race” or “social class” differences and we can, too, change the distribution of the curve, along with notions of who is or is not “intelligent.” Previously low scorers can, by way of test construction, become high scorers, vice-versa for high scorers being made into low scorers. There is no logical—or empirical—justification for the inclusion of specific items on whatever IQ test is in question. That is, to put it another way, the inclusion of items on a test is subjective, which comes down to the test designers’ preconceived notions, and not an objective measure of what types of items should be on the test—as Raven stated, there is no type of underlying theory for the inclusion of items in the test, it is based on “intuition” (which is the same thing that modern-day test constructors do). These two quotes from IQ-ists in the early 20th century are paramount in the attack on the validity of IQ tests—and the causes for differences in scores between groups.
He and van de Vijver (2012: 7) write that “An item is biased when it has a different psychological meaning across cultures. More precisely, an item of a scale (e.g., measuring anxiety) is said to be biased if persons with the same trait, but coming from different cultures, are not equally likely to endorse the item (Van de Vijver & Leung, 1997).” Indeed, Reynolds and Suzuki (2012: 83) write that “Item bias due to“:
… “poor item translation, ambiguities in the original item, low familiarity/appropriateness of the item content in certain cultures, or influence of culture specifics such as nuisance factors or connotations associated with the item wording” (p. 127) (van de Vijver and Tanzer, 2004)
Drame and Ferguson (2017) note that their “Results indicate that use of the Ravens may substantially underestimate the intelligence of children in Mali” while the cause may be due to the fact that:
European and North American children may spend more time with play tasks such as jigsaw puzzles or connect the dots that have similarities with the Ravens and, thus, train on similar tasks more than do African children. If African children spend less time on similar tasks, they would have fewer opportunities to train for the Ravens (however unintentionally) reflecting in poorer scores. In this sense, verbal ability need not be the only pitfall in selecting culturally sensitive IQ testing approaches. Thus, differences in Ravens scores may be a cultural artifact rather than an indication of true intelligence differences. [Similar arguments can be found in Richardson, 2002: 291-293]
The same was also found by Dutton et al (2017) who write that “It is argued that the undeveloped nature of South Sudan means that a test based around shapes and analytic thinking is unsuitable. It is likely to heavily under-estimate their average intelligence.” So if the Raven has these problems cross-culturally (country), then it SHOULD have such biases within, say, America.
It is also true that the types of items on IQ tests are not as complex as everyday life (see Richardson and Norgate, 2014). Types of questions on IQ tests are, in effect, ones of middle-class knowledge and skills and, knowing how IQ tests are structured will make this claim clear (along with knowing the types of items that eventually make it onto the particular IQ test itself). Richardson (2002) has a few questions on modern-day IQ tests whereas Castles (2013), too, has a few questions from the Stanford-Binet. This, of course, is due to the social class of the test constructors. Some examples of some questions can be seen here:
‘What is the boiling point of water?’ ‘Who wrote Hamlet?’ ‘In what continent is Egypt?’ (Richardson, 2002: 289)
and
‘When anyone has offended you and asks you to excuse him—what ought you do?’ ‘What is the difference between esteem and affection?’ [this is from the Binet Scales, but “It is interesting to note that similar items are still found on most modern intelligence tests” (Castles, 2013).]]
Castles (2013: 150) further notes made-up examples of what is on the WAIS (since she cannot legally give questions away since she is a licensed psychologist), and she writes:
One section of the WAIS-III, for example, consists of arithmetic problems that the respondent must solve in his or her head. Others require test-takers to define a series of vocabulary words (many of which would be familiar only to skilled-readers), to answer school-related factual questions (e.g., “Who was the first president of the United States?” or “Who wrote the Canterbury Tales?”), and to recognize and endorse common cultural norms and values (e.g., “What should you do it a sale clerk accidentally gives you too much change?” or “Why does our Constitution call for division of powers?”). True, respondents are also given a few opportunities to solve novel problems (e.g., copying a series of abstract designs with colored blocks). But even these supposedly culture-fair items require an understanding of social conventions, familiarity with objects specific to American culture, and/or experience working with geometric shapes or symbols.
All of these factors coalesce into forming the claim—and the argument—that IQ tests are one of middle-class knowledge and skills. The thing is, contrary to the claims of IQ-ists, there is no such thing as a culture-free IQ test. Richardson (2002: 293) notes that “Since all human cognition takes place through the medium of cultural/psychological tools, the very idea of a culture-free test is, as Cole (1999) notes, ‘a contradiction in terms . . . by its very nature, IQ testing is culture bound’ (p. 646). Individuals are simply more or less prepared for dealing with the cognitive and linguistic structures built in to the particular items.”
Cole (1981) notes that “that the notion of a culture free IQ test is an absurdity” because “all higher psychological processes are shaped by our experiences and these experiences are culturally organized” (this is a point that Richardson has driven home for decades) while also—rightly—stating that “IQ tests sample school activities, and therefore, indirectly, valued social activities, in our culture.”
One of the last stands for the IQ-ist is to claim that IQ tests are useful for identifying at-risk individuals for learning disabilities (as Binet originally created the first IQ tests for). However, it is noted that IQ tests are not necessary—nor sufficient—for the identification of those with learning disabilities. Siegal (1989) states that “On logical and empirical grounds, IQ test scores are not necessary for the definition of learning disabilities.”
When Goddard brought the first IQ tests to America and translated them into English from French is when the IQ testing conglomerate really took off (see Zenderland, 1998 for a review). These tests were used to justify current social ranks. As Richardson (1991: 44) notes, “The measurement of intelligence in the twentieth century arose partly out of attempts to ‘prove’ or justify a particular world view, and partly for purposes of screening and social selection. It is hardly surprising that its subsequent fate has been one of uncertainty and controversy, nor that it has raised so many social and political issues (see, for example, Joynson 1989 for discussion of such issues).” So, what actual attempts at validation did the constructors of such tests need in the 20th century when they knew full-well what they wanted to show and, unsurprisingly, they observed it (since it was already going to happen since they construct the test to be that way)?
The conceptual arguments just given here point to a few things:
(1) IQ tests are not construct valid because there is no theory of intelligence, nor is there an underlying theory which relates differences in IQ (the unseen function) to, for example, a physiological variable. (See Uttal, 2012; 2014 for arguments against fMRI studies that purport to show differences in physiological variables cognition.)
(2) The fact that items on the tests are biased against certain classes/cultures; this obviously matters since, as noted above, there is no theory for the inclusion of items, it comes down to the subjective choice of the test designers, as noted by Jensen.
(3) ‘g’ is a reified mathematical abstraction; Spearman “discovered” nothing, he just chose the interpretation that, of course, went with his preconceived notion.
(4) The fact that sex differences in IQ scores were seen as a problem and, through item analysis, made to go away. This tells us that we can do the same for class/race differences in intelligence. Score differences are a function of test construction.
(5) The fact that the Raven has been shown to be biased in two African countries lends credence to the claims here.
So this then brings us to the ultimate claim of this article: IQ tests don’t test intelligence; they test middle-class knowledge and skills. Therefore, the scores on IQ tests are not that of intelligence, but of an index of one’s cultural knowledge of the middle class and its knowledge structure. This, IQ scores are, in actuality, “middle-class knowledge and skills” scores. So, contra Jensen (1980), there is bias in mental testing due to the items chosen for inclusion on the test (we have admission that score variances and distributions can change from IQ-ists themselves)
The Argument in The Bell Curve
600 words
On Twitter, getting into discussions with Charles Murray acolytes, someone asked me to write a short piece describing the argument in The Bell Curve (TBC) by Herrnstein and Murray (H&M). This is because I was linking my short Twitter thread on the matter, which can be seen here:
In TBC, H&M argue that America is becoming increasingly stratified by social class, and the main reason is due to the “cognitive elite.” The assertion is that social class in America used to be determined by one’s social origin is now being determined by one’s cognitive ability as tested by IQ tests. H&M make 6 assertions in the beginning of the book:
(i) That there exists a general cognitive factor which explains differences in test scores between individuals;
(ii) That all standardized tests measure this general cognitive factor but IQ tests measure it best;
(iii) IQ scores match what most laymen mean by “intelligent”, “smart”, etc.;
(iv) Scores on IQ tests are stable, but not perfectly so, throughout one’s life;
(v) Administered properly, IQ tests are not biased against classes, races, or ethnic groups; and
(vi) Cognitive ability as measured by IQ tests is substantially heritable at 40-80%/
In the second part, H&M argue that high cognitive ability predicts desireable outcomes whereas low cognitve ability predicts undesireable outcomes. Using the NLSY, H&M show that IQ scores predict one’s life outcomes better than parental SES. All NLSY participants took the ASVAB, while others took IQ tests which were then correlated with the ASVAB and the correlation came out to .81.
They analyzed whether or not one has ever been incarcerated, unemployed for more than one month in the year; whether or not they dropped out of high-school; whether or not they were chronic welfare recipients; among other social variables. When they controlled for IQ in these analyses, most of the differences between ethnic groups, for example, disappeared.
Now, in the most controversial part of the book—the third part—they discuss ethnic differences in IQ scores, stating that Asians have higher IQs than whites who have higher IQs than ‘Hispanics’ who have higher IQs than blacks. H&M argue that the white-black IQ gap is not due to bias since they do not underpredict blacks’ school or job performance. H&M famously wrote about the nature of lower black IQ in comparison to whites:
If the reader is now convinced that either the genetic or environmental explanation has won out to the exclusion of the other, we have not done a sufficiently good job of presenting one side or the other. It seems highly likely to us that both genes and environment have something to do with racial differences. What might the mix be? We are resolutely agnostic on that issue; as far as we can determine, the evidence does not yet justify an estimate.
Finally, in the fourth and last section, H&M argue that efforts to raise cognitive ability through the alteration of the social and physical environment have failed, though we may one day find some things that do raise ability. They also argue that the educational experience in America neglects the small, intelligent minority and that we should begin to not neglect them as they will “greatly affect how well America does in the twenty-first century” (H&M, 1996: 387). They also argue forcefully against affirmative action, in the end arguing that equality of opportunity—over equality of outcome—should be the role of colleges and workplaces. They finally predict that this “cognitive elite” will continuously isolate themselves from society, widening the cognitive gap between them.
The Malleability of IQ
1700 words
1843 Magazine published an article back in July titled The Curse of Genius, stating that “Within a few points either way, IQ is fixed throughout your life …” How true is this claim? How much is “a few points”? Would it account for any substantial increase or decrease? A few studies do look at IQ scores in one sample longitudinally. So, if this is the case, then IQ is not “like height”, as most hereditarians claim—it being “like height” since height is “stable” at adulthood (like IQ) and only certain events can decrease height (like IQ). But these claims fail.
IQ is, supposedly, a stable trait—that is, like height, at a certain age, it does not change. (Other than sufficient life events, such as having a bad back injury that causes one to slouch over, causing a decrease in height, or getting a traumatic brain injury—though that does not always decrease IQ scores). IQ tests supposedly measure a stable biological trait—“g” or general intelligence (which is built into the test, see Richardson, 2002 and see Schonemann’s papers for refutations on Jensen’s and Spearman’s “g“).
IQ levels are expected to stick to people like their blood group or their height. But imagine a measure of a real, stable bodily function of an individual that is different at different times. You’d probably think what a strange kind of measure. IQ is just such a measure. (Richardson, 2017: 102)
Neuroscientist Allyson Mackey’s team, for example, found “that after just eight weeks of playing these games the kids showed a pretty big IQ change – an improvement of about 30% or about 10 points in IQ.” Looking at a sample of 7-9 year olds, Mackey et al (2011) recruited children from low SES backgrounds to participate in cognitive training programs for an hour a day, 2 days a week. They predicted that children from a lower SES would benefit more from such cognitive/environmental enrichment (indeed, think of the differences between lower and middle SES people).
Mackey et al (2011) tested the children on their processing speed (PS), working memory (WM), and fluid reasoning (FR). Assessing FR, they used a matrix reasoning task with two versions (for the retest after the 8 week training). For PS, they used a cross-out test where “one must rapidly identify and put a line through each instance of a specific symbol in a row of similar symbols” (Mackey et al, 2011: 584). While the coding “is a timed test in which one must rapidly translate digits into symbols by identifying the corresponding symbol for a digit provided in a legend” (ibid.) which is a part of the WISC IV. Working memory was assessed through digit and spatial span tests from the Wechsler Memory Scale.
The kinds of games they used were computerized and non-computerized (like using a Nintendo DS). Mackey et al (2011: 585) write:
Both programs incorporated a mix of commercially available computerized and non-computerized games, as well as a mix of games that were played individually or in small groups. Games selected for reasoning training demanded the joint consideration of several task rules, relations, or steps required to solve a problem. Games selected for speed training involved rapid visual processing and rapid motor responding based on simple task rules.
So at the end of the 8-week program, cognitive abilities increased in both groups. For the children in the reasoning training, they solved an average of 4.5 more matrices than their previous try. Mackey et al (585-586) write:
Before training, children in the reasoning group had an average score of 96.3 points on the TONI, which is normed with a mean of 100 and a standard deviation of 15. After training, they had an average score of 106.2 points. This gain of 9.9 points brought the reasoning ability of the group from below average for their age. [But such gains were not significant on the test of nonverbal intelligence, showing an increase of 3.5 points.]
One of the biggest surprises was that 4 out of the 20 children in the reasoning training showed an increase of over 20 points. This, of course, refutes the claim that such “ability” is “fixed”, as hereditarians have claimed. Mackey et al (2011: 587) writes that “the very existence and widespread use of IQ tests rests on the assumption that tests of FR measure an individual’s innate capacity to learn.” This, quite obviously, is a false claim. (This claim comes from Cattell, no less.) This buttresses the claim that IQ tests are, of course, experience dependent.
This study shows that IQ is not malleable and that exposure to certain cultural tools leads to increases in test scores, as hypothesized (Richardson, 2002, 2017).
Salthouse (2013) writes that:
results from different types of approaches are converging on a conclusion that practice or retest contributions to change in several cognitive abilities appear to be nearly the same magnitude in healthy adults between about 20 and 80 years of age. These findings imply that age comparisons of longitudinal change are not confounded with differences in the influences of retest and maturational components of change, and that measures of longitudinal change may be underestimates of the maturational component of change at all ages.
Moreno et al (2011) show that after 20 days of computerized training, children in the music group showed enhanced scores on a measure of verbal ability—90 percent of the sample showed the same improvement. They further write that “the fact that only one of the groups showed a positive correlation between brain plasticity (P2) and verbal IQ changes suggests a link between the specific training and the verbal IQ outcome, rather than improvement due to repeated testing.”
Schellenberg (2004) describes how there was an advertisement looking for 6 year olds to enroll them in art lessons. There were 112 children enrolled into four groups: two groups received music lessons for a year, on either a standard keyboard or they had Kodaly voice training while the other two groups received either drama training or no training at all. Schellenberg (2004: 3) writes that “Children in the control groups had average
increases in IQ of 4.3 points (SD = 7.3), whereas the music groups had increases of 7.0 points (SD = 8.6).” So, compared to either drama training or no training at all, the children in the music training gained 2.7 IQ points more.
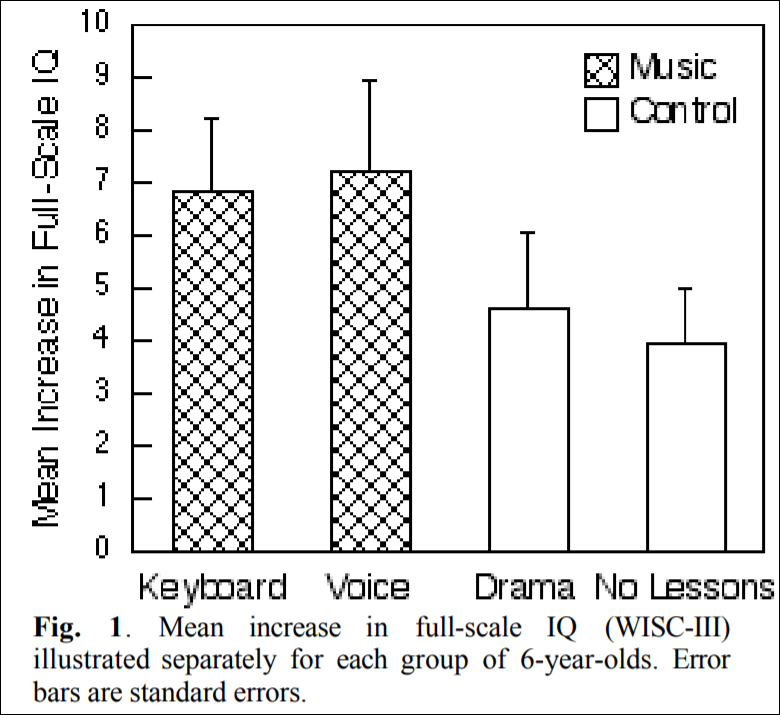
(Figure 1 from Schellenberg, 2004)
Ramsden et al (2011: 3-4) write:
The wide range of abilities in our sample was confirmed as follows: FSIQ ranged from 77 to 135 at time 1 and from 87 to 143 at time 2, with averages of 112 and 113 at times 1 and 2, respectively, and a tight correlation across testing points (r 5 0.79; P , 0.001). Our interest was in the considerable variation observed between testing points at the individual level, which ranged from 220 to 123 for VIQ, 218 to 117 for PIQ and 218 to 121 for FSIQ. Even if the extreme values of the published 90% confidence intervals are used on both occasions, 39% of the sample showed a clear change in VIQ, 21% in PIQ and 33% in FSIQ. In terms of the overall distribution, 21% of our sample showed a shift of at least one population standard deviation (15) in the VIQ measure, and 18% in the PIQ measure. [Also see The Guardian article on this paper.[
Richardson (2017: 102) writes “Carol Sigelman and Elizabeth Rider reported the IQs of one group of children tested at regular intervals between the ages of two years and seventeen years. The average difference between a child’s highest and lowest scores was 28.5 points, with almost one-third showing changes of more than 30 points (mean IQ is 100). This is sufficient to move an individual from the bottom to the top 10 percent or vice versa.” [See also the page in Sigelman and Rider, 2011.]
Mortensen et al (2003) show that IQ remains stable in mid- to young adulthood in low birthweight samples. Schwartz et al (1975: 693) write that “Individual variations in patterns of IQ changes (including no changes over time) appeared to be related to overall level of adjustment and integration and, as such, represent a sensitive barometer of coping responses. Thus, it is difficult to accept the notion of IQ as a stable, constant characteristic of the individual that, once measured, determines cognitive functioning for any age level for any test.”
There is even instability in IQ seen in high SES Guatemalans born between 1941-1953 (Mansukoski et al, 2019). Mansukoski et al’s (2019) analysis “highlight[s] the complicated nature of measuring and interpreting IQ at different ages, and the many factors that can introduce variation in the results. Large variation in the pre-adult test scores seems to be more of a norm than a one-off event.” Possible reasons for the change could be due to “adverse life events, larger than expected deviations of individual developmental level at the time of the testing and differences between the testing instruments” (Mansukoski et al, 2019). They also found that “IQ scores did not significantly correlate with age, implying there is no straightforward developmental cause behind the findings“, how weird…
Summarizing such studies that show an increase in IQ scores in children and teenagers, Richardson (2017: 103) writes:
Such results suggest that we have no right to pin such individual differences on biology without the obvious, but impossible, experiment. That would entail swapping the circumstances of upper-and lower-class newborns—parents’ inherited wealth, personalities, stresses of poverty, social self-perception, and so on—and following them up, not just over years or decades, but also over generations (remembering the effects of maternal stress on children, mentioned above). And it would require unrigged tests based on proper cognitive theory.
In sum, the claim that IQ is stable at a certain age like another physical trait is clearly false. Numerous interventions and reasons can increase or decrease one’s IQ score. The results discussed in this article show that familiarity to certain types of cultural tools increases one’s score (like in the low SES group tested in Mackey et al, 2011). Although the n is low (which I know is one of the first things I will hear), I’m not worried about that. What I am worried about is the individual change in IQ at certain ages, and they show that. So the results here show support for Richardson’s (2002) thesis that “IQ scores might be more an index of individuals’ distance from the cultural tools making up the test than performance on a singular strength variable” (Richardson, 2012).
IQ is not stable; IQ is malleable, whether through exposure to certain cultural/class tools or through certain aspects that one is exposed to that are more likely to be included in certain classes over others. Indeed, this lends credence to Castles’ (2013) claim that “Intelligence is in fact a cultural construct, specific to a certain time and place.“
Chopsticks Genes and Population Stratification
1200 words
Why do some groups of people use chopsticks and others do not? Years back, created a thought experiment. So he found a few hundred students from a university and gathered DNA samples from their cheeks which were then mapped for candidate genes associated with chopstick use. Come to find out, one of the associated genetic markers was associated with chopstick use—accounting for 50 percent of the variation in the trait (Hamer and Sirota, 2000). The effect even replicated many times and was highly significant: but it was biologically meaningless.
One may look at East Asians and say “Why do they use chopsticks” or “Why are they so good at using them while Americans aren’t?” and come to such ridiculous studies such as the one described above. They may even find an association between the trait/behavior and a genetic marker. They may even find that it replicates and is a significant hit. But, it can all be for naught, since population stratification reared its head. Population stratification “refers to differences in allele frequencies between cases and controls due to systematic differences in ancestry rather than association of genes with disease” (Freedman et al, 2004). It “is a potential cause of false associations in genetic association studies” (Oetjens et al, 2016).
Such population stratification in the chopsticks gene study described above should have been anticipated since they studied two different populations. Kaplan (2000: 67-68) described this well:
A similar argument, bu the way, holds true for molecular studies. Basically, it is easy to mistake mere statistical associations for a causal connection if one is not careful to properly partition one’s samples. Hamer and Copeland develop and amusing example of some hypothetical, badly misguided researchers searching for the “successful use of selected hand instruments” (SUSHI) gene (hypothesized to be associated with chopstick usage) between residents in Tokyo and Indianapolis. Hamer and Copeland note that while you would be almost certain to find a gene “associated with chopstick usage” if you did this, the design of such a hypothetical study would be badly flawed. What would be likely to happen here is that a genetic marker associated with the heterogeneity of the group involved (Japanese versus Caucasian) would be found, and the heterogeneity of the group involved would independently account for the differences in the trait; in this case, there is a cultural tendency for more people who grow up in Japan than people who grow up in Indianapolis to learn how to use chopsticks. That is, growing up in Japan is the causally important factor in using chopsticks; having a certain genetic marker is only associated with chopstick use in a statistical way, and only because those people who grow up in Japan are also more likely to have the marker than those who grew up in Indianapolis. The genetic marker is in no way causally related to chopstick use! That the marker ends up associated with chopstick use is therefore just an accident of design (Hamer and Copeland, 1998, 43; Bailey 1997 develops a similar example).
In this way, most—if not all—of the results of genome-wide association studies (GWASs) can be accounted for by population stratification. Hamer and Sirota (2000) is a warning to psychiatric geneticists to not be quick to ascribe function and causation to hits on certain genes from association studies (of which GWASs are).
Many studies, for example, Sniekers et al (2017), Savage et al (2018) purport to “account for” less than 10 percent of the variance in a trait, like “intelligence” (derived from non-construct valid IQ tests). Other GWA studies purport to show genes that affect testosterone production and that those who have a certain variant are more likely to have low testosterone (Ohlsson et al, 2011). Population stratification can have an effect here in these studies, too. GWASs; they give rise to spurious correlations that arise due to population structure—which is what GWASs are actually measuring, they are measuring social class, and not a “trait” (Richardson, 2017b; Richardson and Jones, 2019). Note that correcting for socioeconomic status (SES) fails, as the two are distinct (Richardson, 2002). (Note that GWASs lead to PGSs, which are, of course, flawed too.)
Such papers presume that correlations are causes and that interactions between genes and environment either don’t exist or are irrelevant (see Gottfredson, 2009 and my reply). Both of these claims are false. Correlations can, of course, lead to figuring out causes, but, like with the chopstick example above, attributing causation to things that are even “replicable” and “strongly significant” will still lead to false positives due to that same population stratification. Of course, GWAS and similar studies are attempting to account for the heriatbility estimates gleaned from twin, family, and adoption studies. Though, the assumptions used in these kinds of studies are shown to be false and, therefore, heritability estimates are highly exaggerated (and flawed) which lead to “looking for genes” that aren’t there (Charney, 2012; Joseph et al, 2016; Richardson, 2017a).
Richardson’s (2017b) argument is simple: (1) there is genetic stratification in human populations which will correlate with social class; (2) since there is genetic stratification in human populations which will correlate with social class, the genetic stratification will be associated with the “cognitive” variation; (3) if (1) and (2) then what GWA studies are finding are not “genetic differences” between groups in terms of “intelligence” (as shown by “IQ tests”), but population stratification between social classes. Population stratification still persists even in “homogeneous” populations (see references in Richardson and Jones, 2019), and so, the “corrections for” population stratification are anything but.
So what accounts for the small pittance of “variance explained” in GWASs and other similar association studies (Sniekers et al, 2017 “explained” less than 5 percent of variance in IQ)? Population stratification—specifically it is capturing genetic differences that occurred through migration. GWA studies use huge samples in order to find the genetic signals of the genes of small effect that underline the complex trait that is being studied. Take what Noble (2018) says:
As with the results of GWAS (genome-wide association studies) generally, the associations at the genome sequence level are remarkably weak and, with the exception of certain rare genetic diseases, may even be meaningless (13, 21). The reason is that if you gather a sufficiently large data set, it is a mathematical necessity that you will find correlations, even if the data set was generated randomly so that the correlations must be spurious. The bigger the data set, the more spurious correlations will be found (3).
Calude and Longo (2016; emphasis theirs) “prove that very large databases have to contain arbitrary correlations. These correlations appear only due to the size, not the nature, of data. They can be found in “randomly” generated, large enough databases, which — as we will prove — implies that most correlations are spurious.”
So why should we take association studies seriously when they fall prey to the problem of population stratification (measuring differences between social classes and other populations) along with the fact that big datasets lead to spurious correlations? I fail to think of a good reason why we should take these studies seriously. The chopsticks gene example perfectly illustrates the current problems we have with GWASs for complex traits: we are just seeing what is due to social—and other—stratification between populations and not any “genetic” differences in the trait that is being looked at.
High IQ Societies
1500 words
The most well-known high IQ society (HIS hereafter) is Mensa. But did you know that there are many more—much more exclusive—high IQ societies? In his book The Genius in All of Us: Unlocking Your Brain’s Potential (Adam, 2018) Adam chronicles his quest to raise his IQ score using nootropics. (Nootropics are supposed brain-enhancers, such as creatine that supposedly help in increasing cognitive functioning.) Adam discusses his experience taking the Mensa test (Mensa “is Mexican slang for stupid woman“; Adam, 2018) and talking to others who did with him on the same day. One highschool student he talked to wanted to put that he was a Mensa member on his CV; yet another individual stated that they accepted a challenge from a family member, since other members were in Mensa, she wanted to show that she had what it took.
Adam states that they were handed two sheets of paper with 30 questions, to be answered in three or four minutes, with questions increasing in difficulty. The first paper, he says, had a Raven-like aspect to it—rotating shapes and choosing the correct shape that’s next in the sequence. But, since he was out of time for the test, he says that he answered “A” to the remaining questions when the instructor wasn’t looking, since he “was going to use cognitive enhancement to cheat later anyway” (Adam, 2018: 23). (I will show Adam’s results of his attempted “cognitive enhancement to cheat” on the Mensa exam at the end of this article.) The shapes-questions were from the first paper, and the second was verbal. On this part, some words had to be defined while others had to be placed into context, or be placed into a sentence in the right place. Adam (2018: 23) gives an example of some of the verbal questions:
Is ‘separate’ the equivalent of ‘unconnected’ or ‘unrelated’? Or ‘evade’ — is it the same as ‘evert’, ‘elude’ or ‘escape’?
[Compare to other verbal questions on standard IQ tests:
‘What is the boiling point of water?’ ‘Who wrote Hamlet?’ ‘In what continent is Egypt?’ (Richardson, 2002: 289)
and
‘When anyone has offended you and asks you to excuse him—what ought you do?’ ‘What is the difference between esteem and affection?’ [this is from the Binet Scales, but “It is interesting to note that similar items are still found on most modern intelligence tests” (Castles, 2013).]]
So it took a few weeks for Adam’s results to get delivered to his home. His wife opened the letter and informed him that he had gotten into Mensa. (He got in despite answering “A” after the time limit was up.) This, though, threw a wrench into his plans: his plan was to use cognitive enhancers (nootropics) to enhance his cognition and attempt to score higher and get into Mensa that way. However, there are much more exclusive IQ clubs than Mensa. Adam (2018: 30) writes:
Under half of the Mensa membership, for example, would get into the Top One Percent Society (TOPS). And fewer than one in ten of those TOPS members would make the grade at the One in a Thousand Society. Above that the names get cryptic and the spelling freestyle.
There’s the Epida society, the Milenija, the Sthiq Society, and Ludomind. The Universal Genius Society takes just one person in 2,330, and the Ergo Society just one in 31,500. Members of the Mega Society, naturally, are one in a million. The Giga Society? One in a billion, which means, statistically, just seven people on the planet are qualified to join. Let’s hope the know about it. If you are friends with one of them, do tell them.
At the top of the tree is the self-proclaimed Grail Society, which sets its membership criteria so high — one in 76 billion — that it currently has zero members. It’s run by Paul Cooijmans, a guitarist from the Netherlands. About 2,000 people have tried and failed to join, he says. ‘Be assured that no one has come close.’
Wow, what exclusive clubs! Mensans are also more likely to have “psychological and physiological overexcitabilities” (Karpinski et al, 2018) such as ADHD, autism, and other physiologic diseases. How psycho and socially awkward a few members of Mensa are is evidenced in this tweet thread.

How spooooky. Surely the high IQ Mensans have un-thought-of ways of killing that us normies could never fathom. And surely, with their high IQs, they can outsmart the ones who would attempt to catch them for murder.
A woman named Jamie Loftus got into Mensa and she says that you get a discount on Hertz car rentals, a link to the Geico insurance website, you get access to the Mensa dating site “Mensa Match” (there is also an “IQ” dating site called https://youandiq.com/), an email address, a cardboard membership card, and access to Mensa events in your area. Oh, and of course, you have to pay to take the test and pay yearly to stay in. (Also read Loftus’ other articles on her Mensa experience: one where she describes the death threats she got, and another in which she describes how Mensans would like her to not write bad things about them (Mensans). Seems like Mensans are in their “feels” about being attacked for their little—useless—club.)
One of the founders of Mensa—Lancelot Ware—stated that he “get[s] disappointed that so many members spend so much time solving puzzles” (quoted in Tammet, 2009: 40). If Mensa were anything but “members [who] spend so much time solving puzzles“, then I think Ware would have stated as much. While the other founder of Mensa—Ronald Berrill— “had intended Mensa as “an aristocracy of the intellect”, and was unhappy that a majority of Mensans came from humble homes” (the Wikipedia article on Mensa International cites Serebriakoff, 1986 as the reference for the quote).
So, when it comes to HISs, what do they bring to the world? Or is it just a dues-paid club so that the people on top can get money from people attempting to stroke their egos saying “Yea, I scored high on a test and am in a club!”
The supervisor of the Japanese Intelligence Network (JIN) writes (his emphasis):
Currently, the ESOTERIQ society has seven members and the EVANGELIQ has one member.
I can perfectly guarantee that the all members exactly certainly undoubtedly absolutely officially keep authentic the highest IQ score performances.
Especially, the EVANGELIQ is the most exclusive high IQ society which has at least one member.
Do you think the one member of EVANGELIQ talks to himself a lot? From the results of Karpinski et al (2018), I would hazard the guess that, yes, he does. Here is a list of 84 HISs, and there is an even more exclusive club than the Grail Society: the Terra Society (you need to score 205 on the test where the SD is 15 to join).
So is there a use for high IQ societies? I struggle to think of one. They seem to function as money-sinks—to sucker people into paying their dues just because they scored high on a test (with no validity). The fact that one of the founders of Mensa was upset that Mensa members spend so much time doing puzzles is very telling. What else do they do with their ‘talent’ other than solve puzzles all day? What has the Mensa group—and any of the other (quite possible, but 84 are linked above) hundreds of HISs—done for the world?
Adam—although he guessed at the end of the first Mensa exam (the Raven-like one)—got into Mensa due to his second Mensa test—the verbal one. Adam eventually retook the Mensa exam after taking his nootropic cocktails and he writes (2018: 207):
The second envelope from Mensa was waiting for me when I returned from work, poking out beneath a gas bill. I opened the gas bill first. Its numbers were higher than I expected. I hoped the same would be true of the letter that announced my new IQ.
It was. My cognitively enhanced score on the language test had crept up to 156, from 154 before. And on the Culture Fair Test [the Raven-like test], the tough one with the symbols, it had soared to 137, from 128. That put me on the ninety-ninth percentile on both.
My IQ as measured by the symbols test — the one I had tried to improve on using the brain stimulation — was now 135, up from 125, and well above the required threshold for Mensa Membership.
Adam used Modafinil (a drug used to treat sleeplessness due to narcolepsy, obstructive sleep apnea, and shift work sleep disorder) and electrical brain stimulation. So Adam increased his scores, but he—of course—has no idea what causes his score increases: the nootropic, the electrical stimulation, practice, already having an idea of what was on the test, etc.
In any case, that’s ancillary to the main discussion point in this article: What has Mensa—and other HISs—done for the world? Out of the hundreds of HISs in the world, have they done anything of note or are they just a club of people who score highly on a test who then have to pay money to be in the club? There is no value to these kinds of ‘societies’; they’re just a circlejerk for good test-takers. Mensans have a higher chance of having mental disorders, which is evidenced by the articles above by Jamie Loftus, where they threaten her life with their “criminal element”.
So, until I’m shown otherwise, Mensa and other HISs are just a circlejerk where people have to pay to be in the club—and that’s all it is.
How Things Change: Perspectives on Intelligence in Antiquity
1300 words
The cold winter theory (CWT) is a theory that purports to explain why those whose ancestors evolved in colder climes are more “intelligent” than those whose ancestors evolved in warmer climes. Popularized by Rushton (1997), Lynn (2006), and Kanazawa (2012), the theory—supposedly—accounts for the “haves” and the “have not” in regard to intelligence. However, the theory is a just-so story, that is, it explains what it purports to explain without generating previously unknown facts not used in the construction of the theory. PumpkinPerson is irritated by people who do not believe the just-so story of the CWT writing (citing the same old “challenges” as Lynn which were dispatched by McGreal):
The cold winter theory is extremely important to HBD. In fact I don’t even understand how one can believe in racially genetic differences in IQ without also believing that cold winters select for higher intelligence because of the survival challenges of keeping warm, building shelter, and hunting large game.
The CWT is “extremely important to HBD“, as PP claims, since there needs to be an evolutionary basis for population differences in “intelligence” (IQ). Without the just-so story, the claim that racial differences in “intelligence” are “genetically” based crumbles.
Well, here is the biggest “challenge” (all other refutations of it aside) to the CWT. Notions of which population are or are not “intelligent” change with the times. The best example is what the Greeks—specifically Aristotle—wrote about the intelligence of those who lived in the north. Maurizio Meloni, in his 2019 book Impressionable Biologies: From the Archaeology of Plasticity to the Sociology of Epigenetics captures this point (pg 41-42; emphasis his):
Aristotle’s Politics is a compendium of all these ideas [Orientals being seen as “softer, more delicate and unwarlike” along with the structure of militaries], with people living in temperate (mediocriter) places presented as the most capable of producing the best political systems:
“The nations inhabiting the cold places and those of Europe are full of spirit but somewhat deficient in intelligence and skill, so that they continue comparatively free, but lacking in political organization and the capacity to rule their neighbors. The peoples of Asia on the other hand are intelligent and skillful in temperament, but lack spirit, so that they are in continuous subjection and slavery. But the Greek race participates in both characters, just as it occupies the middle position geographically, for it is both spirited and intelligent; hence it continues to be free and to have very good political institutions, and to be capable of ruling all mankind if it attains constitutional unity.” (Pol. 1327b23-33, my italics)
Views of direct environmental influence and the porosity of bodies to these effects also entered the military machines of ancient empires, like that of the Romans. Offices such as Vegetius (De re militari, I/2) suggested avoiding recruiting troops from cold climates as they had too much blood and, hence, inadequate intelligence. Instead, he argued, troops from temperate climates be recruited, as they possess the right amount of blood, ensuring their fitness for camp discipline (Irby, 2016). Delicate and effemenizing land was also to be abandoned as soon as possible, according Manilius and Caesar (ibid). Probably the most famous geopolitical dictum of antiquity reflects exactly this plastic power of places: “soft lands breed soft men”, according to the claim that Herodotus attributed to Cyrus.
Isn’t that weird, how things change? Quite obviously, which population is or is not “intelligent” is based on the time and place of the observation. Those in northern Europe, who are purported to be more intelligent than those who live in temperate, hotter climes—back in antiquity—were seen to be less intelligent in comparison to those who lived in more temperate, hotter climes. Imagine stating what Aristotle said thousands of years ago in the present day—those who push the CWT just-so story would look at you like you’re crazy because, supposedly, those who live in and evolved in colder climes had to plan ahead and faced a tougher environment in comparison to those who lived closer to the equator.
Imagine we could transport Aristotle to the present day. What would he say about our perspectives on which population is or is not intelligent? Surely he would think it ridiculous that the Greeks today are less “intelligent” than those from northern Europe. But that only speaks to how things change and how people’s perspectives on things change with the times and who is or is not a dominant group. Now imagine that we can transport someone (preferably an “IQ” researcher) to antiquity when the Greeks were at the height of their power. They would then create a just-so story to justify their observations about the intelligence of populations based on their evolutionary history.
Anatoly Karlin cites Galton, who claims that ancient Greek IQ was 125, while Karlin himself claims IQ 90. I cite Karlin’s article not to contest his “IQ estimates”—nor Galton’s—I cite it to show the disparate “estimates” of the intelligence of the ancient Greeks. Because, according to the Greeks, they occupied the middle position geographically, and so they were both spirited and intelligent compared to Asians and northern Europeans.
This is similar to Wicherts, Boorsboom, and Dolan (2010) who responded to Rushton, Lynn, and Templer. They state that the socio-cultural achievements of Mesopotamia and Egypt stand in “stark contrast to the current low level of national IQ of peoples of Iraq and Egypt and that these ancient achievements appear to contradict evolutionary accounts of differences in national IQ.“ One can make a similar observation about the Maya. Their cultural achievements stand in stark contrast to their “evolutionary history” in warm climes. The Maya were geographically isolated from other populations and they still created a writing system (independently) along with other cultural achievements that show that “national IQs” are irrelevant to what the population achieved. I’m sure an IQ-ist can create a just-so story to explain this away, but that’s not the point.
Going back to what Karlin and Galton stated about Greek IQ, their IQ is irrelevant to their achievements. Whether or not their IQ was 120-125 or 90 is irrelevant to what they achieved. To the Mesopotamians and Egyptians, they were more intelligent than those from northern climes. They would, obviously, think that based on their achievements and the lack of achievements in the north. The achievements of peoples in antiquity would paint a whole different picture in regard to an evolutionary theory of human intelligence—and its distribution in human populations.
So which just-so story (ad hoc hypothesis) should we accept? Or should we just accept that which population is or is not “intelligent” and capable of constructing militaries is contingent based on the time and the place of the observation? Looking at “national IQs” of peoples in antiquity would show a huge difference in comparison to what we observe today about the “national IQs” (supposedly ‘intelligence’) of populations around the world. In antiquity, those who lived in temperate and even hotter climes had greater achievements than others. Greeks and Romans argued that peoples from northern climes should not be enlisted in the military due to where they were from.
These observations from the Greeks and Romans about who and who not to enlist in the military, along with their thoughts on Northern Europeans prove that perspectives on which population is or is not “intelligent” is contingent based on the time and place. This is why “national IQs” should not be accepted, not even accounting for the problems with the data (Richardson, 2004; also see Morse, 2008; also see The Ethics of Development: An Introduction by Ingram and Derdak, 2018). Seeing the development of countries/populations in antiquity would lead to a whole different evolutionary theory of the intelligence of populations, proving the contingency of the observations.
What Rushton Got Wrong
1700 words
JP Rushton’s career was pretty much nothing but peddling bullshit. In the beginning of his career, he was a social learning theorist. He published a book Altruism, Socialization, and Society (Rushton, 1980). I bought the book a few years back when I was still a hardcore Rushton defender to see what he wrote about before he started pushing IQ and evolutionary theories about human races and I thought it was pretty good. In any case, Rushton got a lot wrong. So much so, that his career was, in my opinion, wasted peddling bullshit. Rushton was shown to be wrong time and time again on r/K theory and cold winter theory; Rushton was shown to be wrong time and time again on his crime theorizing; and Rushton’s and Jensen’s papers on the causes of the black-white IQ gap rest on a misunderstanding of heritability. In this piece, I will cover those three subjects.
Recently, two new papers have appeared that have a bone to pick with Rushton: One by Flynn (2019) and the other by Cernovsky and Litman (2019). Flynn discusses Rushton’s claims on the method of correlated vectors, his cold winter theory (that Asians and Europeans were subjected to harsher climates which led to higher levels of intelligence and therefore IQ) and his misuse of regression to the mean. He also discussed how the black-white IQ gap is environmental in nature (which is the logical position to hold, since IQ tests are tests of middle-class knowledge and skills (Richardson, 2002) and they are not construct valid).
Cold Winters Theory
Rushton theorized that, due to exposure to harsher environments, that Europeans and East Asians evolved to be more intelligent than Africans who stayed in the, what I assume to be, less harsh environments of Africa (Rushton, 1985). This is Rushton’s “Differential K theory.” Flynn (2019) writes that he “can supply an evolutionary scenario for almost any pattern of current IQ scores.” And of course, one can do that with any evolutionary adaptive hypothesis.
Even Frost (2019) admits that “there is no unified evolutionary theory of human intelligence, other than the general theory of evolution by natural selection.” But since “natural selection” is not a mechanism (Fodor, 2008; Fodor and Piattelli-Palmarini, 2010), then it cannot explain the evolution of intelligence differences, nevermind the fact that, mostly, these claims are pushed by differences in non-construct valid IQ test scores.
In any case, Rushton’s theory is a just-so story.
r/K selection
Judith Anderson (1991) refuted Rushton’s hypothesis on ecological grounds. Rushton asserted that Africans were r-selected whereas Asians and Europeans were more K-selected. Rushton, however, did not even use alpha-selection, which is selection for competitive ability. So r- and K selection is based on density-independence and density-dependence. K-selection is expected to favor genotypes that persist at high densities—increasing K—whereas r-selection is expected to favor genotypes that increase more quickly at low densities—increasing r. Alpha-selection can also occur at high or low population densities but is more likely in high densities. Though alpha-selection “favours genotypes that, owing to their negative effects on others, often reduce the growth rate and the maximum population size” (Anderson, 1991: 52). I further discussed the huge flaws with Rushton’s r/K model here. So Rushton’s theory fails on those grounds, along with many others.
Race
When it came to race, Rushton was a lumper, not a splitter. What I mean by these terms is simple: lumpers lump together Native Americans with East Asians and Pacific Islanders with Africans while splitters split them into further divisions. Why was Rushton a lumper? Because it fit more with his theory, of course. I remember back when I was a Rushton-ist, and I was, too, a lumper, that to explain away the low IQs of Native Americans—and in turn their achievements—was that they still had their intelligence from the cold winters and that’s when they did their achievements. Then, as they spent more time in hotter climates, they became dumber. In any case, there is no justification for lumping Native Americans with East Asians. Looking through Rushton’s book, he gives no justification for his lumping, so I can only assume that it is bias on his part. Now I will justify the claim that splitting is better than lumping. (Rushton also gave no definition of race, and according to Cernovsky and Litman (2019: 54), Rushton “failed to provide any scientific definition of race …”
Race is both a social and biological construct. I can justify the claim that Natives and East Asians are distinct races in one way here: ask both groups if the other is the same race. What do you think the answer will be? Now, onto genetics.
Spencer (2014) discusses the results from Tishkoff et al (2009), saying that when they added 134 ethnic groups to the ones found in the HDGP sample of 52, the K=5 partition clustered Caucasians, Mongoloids, and three distinct sets of Africans. Mongoloids, in this case, being East Asians, Native Americans, and Oceanians. But Tishkoff et al oversampled African ethnic groups. This, though, does not undercut my argument: of course when you oversample ethnic groups you will get the result of Tishkoff et al (2009) and since Africans were oversampled, the populations more genetically similar were grouped into the same cluster, which, of course, does not mean they are the same race.
Census racial discourse is just national racial discourse. The census uses defers to the OMB to define race. How does the OMB define race? The OMB defines “race” as “sets of” populations. Race in US racial discourse designates a set of population groups, thus, race is a particular, not a kind.
I can then invoke Hardimon’s (2017) argument for the existence of minimalist races:
1 There are differences in patterns of visible physical features which correspond to geographic ancestry.
2 These patterns are exhibited between real groups.
3 These groups that exhibit these physical patterns by geographic ancestry satisfy conditions of minimalist race.
C Race exists.
Now we can say:
1 If Native Americans and East Asians are phenotypically distinct, then they are different races.
2 Native Americans and East Asians are phenotypically distinct.
C Therefore Native Americans and East Asians are different races.
Crime
Rushton arbitrarily excluded data that did not fit his theory. How dishonest. Cernovsky and Litman (2019) write:
When Rushton presented crime statistics derived from 2 Interpol Yearbooks as allegedly supporting his thesis that Negroids are more crime inclined than Caucasoids, he arbitrarily excluded disconfirmatory data sets. When all data from the same two Interpol Yearbooks are re-calculated, most of the statistically significant trends in the data are in the direction opposite to Rushton’s beliefs: Negroids had lower crime rates than Caucasoids with respect to sexual offenses, rapes, theft, and violent theft or robbery, with most correlation coefficients exceeding .60. While we do not place much credence in such Interpol statistics as they only reproduce information provided by government officials of different countries, our re-analysis indicated that Rushton excluded data that would discredit his theory.
Further throwing a wrench into Rushton’s assertions is his claim that Mongoloids constitutes both East Asians and Native Americans. Well, Central America has some of the highest crime rates in the world—even higher than in some African countries. What is the ad-hoc justification for explaining away this anomaly if they truly are the same race? If they are the same race, why is the crime rate so much higher in Central America? Surely, Rushton’s defenders would claim something along the lines of recent evolution towards X, Y, and Z. But then I would say, then on what basis are they the same race? No matter what Rushton’s defenders say, they are boxed into a corner.
IQ
Lastly, Rushton and Jensen (2005) argued, on the basis of heritability estimates, and twin studies, that the black-white IQ gap is largely genetic in nature. But there are a few problems. They rely largely on a slew of trans-racial adoption studies, all of which have been called into question (Thomas, 2017). IQ tests, furthermore, are not construct valid (Richardson and Norgate, 2015; Richardson, 2017). Heritability estimates also fail. This is because, in non-controlled environments these stats do not tell us much, if anything (Moore and Shenk, 2016). Likewise, Guo (2000: 299) concurs, writing “it can be argued that the term ‘heritability’, which carries a strong conviction or connotation of something ‘heritable’ in everyday sense, is no longer suitable for use in human genetics and its use should be discontinued.” (For more arguments against heritability, read Behavior Genetics and the Fallacy of Nature vs Nurture.)
Rushton and Jensen (2005) also relied on the use of twin studies, however, all of the assumptions that researchers use to attempt to immunize their arguments from refutation are circular and ad hoc; they also agree that MZs experience more similar environments than DZs, too (Joseph et al, 2014; Joseph, 2016, see a summary here; Richardson, 2017). In any case, the fact that G and E interact means that heritability estimates are, in effect, useless in humans. Farm animals are bred in highly controlled environments; humans are not. Thus, we cannot—and should not—accept the results of twin studies; they cannot tell us whether or not genes are responsible for any behavioral trait.
Conclusion
There was a lot that Rushton got wrong. His cold winters theory is a just-so story; East Asians and Native Americans are not the same race; heritability estimates are not a measure of how much genes have to do with phenotypic variation within or between groups; IQ tests are not construct valid; r/K selection theory was slayed as early as 1991 and then again in 2002 (Graves, 2002); twin studies are not informative when it comes to how much genes influence traits, they only measure environmental similarity; and finally, Rushton omitted data that did not fit his hypothesis on racial differences in crime.
It’s sad to think that one can spend a career—about 25 years—spewing nothing but pseudoscience. One of the only things I agree with him on is that races are real—but when it comes to the nuances, I disagree with him, because there are five races, not three. Rushton got a lot wrong, and I do not know why anyone would defend him, even when these glaring errors are pointed out. (For a good look into Rushton’s lies, see Dutton’s (2018) book J. Philippe Rushton: A Life History Perspective and my mini-review on the book.)
Cold Winter Theory, the Vitamin D Hypothesis and the Prediction of Novel Facts
2400 words
HBDers purport that as one moves further north from Africa that IQ raises as a function of how the population in question needed to survive. The explanation is that as our species migrated out of Africa, more “intelligence” was needed and this is what explains the current IQ disparities across the world: the ancestors of populations evolving in different areas with different demands then changed their “IQs” and this then is responsible for differential national development between nations. Cold winter theory (CWT) explains these disparities.
On the other hand is the vitamin D hypothesis (VDH). The VDH purports to explain why populations have light skin at northern latitudes. As the migration north out of Africa occurred, peoples needed to get progressively lighter in order to synthesize vitamin D. The observation here is that as light skin is selected for in locations where UVB is absent, seasonal or more variable whereas dark skin is selected for where UVB is stronger. So we have two hypotheses: but there is a problem. Only one of these hypotheses makes novel predictions. Predictions of novel predictions are what science truly is. A predicted fact is a novel fact for a hypothesis if it wasn’t used in the construction of the hypothesis (Musgrave, 1988). In this article, I will cover both the CWT and VDH, predictions of facts that each made (or didn’t make) and which can be called “science”.
Cold winter theory
The cold winter theory, formulated by Lynn and Rushton, purports to give an evolutionary explanation for differences in national IQs: certain populations evolved in areas with deathly cold winters in the north, while those who lived in tropical climes had, in comparison to those who evolved in the north, an “easier time to live”. Over time as populations adapted to their environments, differences in ‘intelligence’ (whatever that is) evolved due to the different demands of each environment, or so the HBDers say.
Put simply, the CWT states that IQ differences exist due to different evolutionary pressures. Since our species migrated into cold, novel environments, this was the selective pressure needed for higher levels of ‘intelligence’. On the other hand, humans who remained in Africa and other tropical locations did experience these novel, cold environments and so their ‘intelligence’ stayed at around the same level as it was 70,000 years ago. Many authors hold this theory, including Rushton (1997), Lynn (2006), Hart, (2007) Kanazawa (2008), Rushton and Templer (2012; see my thoughts on their hypothesis here) and Wade (2014). Lynn (2013) even spoke of a “widespreadonsensus” on the CWT, writing:
“There is widespread consensus on this thesis, e.g. Kanazawa (2008), Lynn (1991, 2006), and Templer and Arikawa (2006).”
So this “consensus” seems to be a group of his friends and his own publications. We can change this sentence to ““There is widespread consensus on this thesis, including two of my publications, a paper where the author assumes that the earth is flat: “First, Kanazawa’s (2008) computations of geographic distance used Pythagoras’ theorem and so the paper assumed that the earth is flat (Gelade, 2008).” (Wicherts et al, 2012) and another publication where the authors assume hot weather leads to lower intelligence. Oh yea, they’re all PF members. Weird.” That Lynn (2013) calls this “consensus” is a joke.
What caused higher levels of ‘intelligence’ in those that migrated out of Africa? Well, according to those who push the CWT, finding food and shelter. Kanazawa, Lynn, and Rushton all argue that finding food, making shelter and hunting animals were all harder in Eurasia than in Africa.
One explanation for high IQs of people who evolved recently in northern climes is their brain size. Lynn (2006: 139) cites data showing the average brain sizes of populations, along with the temperatures in that location:
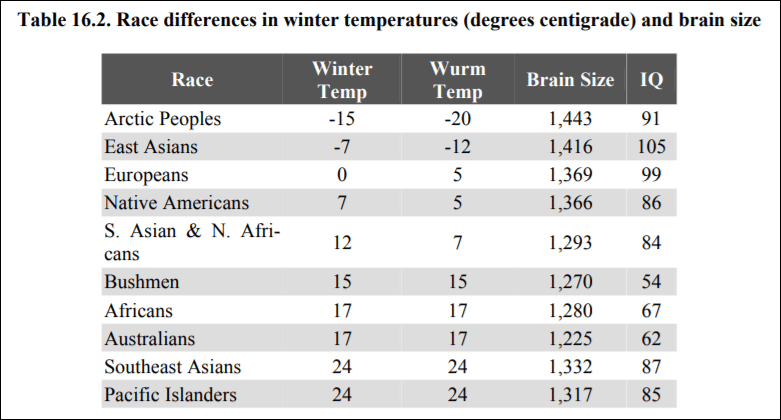
Do note the anomaly with the Arctic peoples. To explain this away in an ad-hoc manner, Lynn (2006: 156-7) writes:
These severe winters would be expected to have acted as a strong selection for increased intelligence, but this evidently failed to occur because their IQ is only 91. The explanation for this must lie in the small numbers of the Arctic Peoples whose population at the end of the twentieth century was only approximately 56,000 as compared with approximately 1.4 billion East Asians.
This is completely ad-hoc. There is no independent verifier for the claim. That the Arcitic don’t have the highest IQs but experienced the harshest temperatures and therefore have the biggest brain size is a huge anomaly, which Lynn (2006) attempts to explain away by population size.
He does not explain why natural selection among Arctic peoples would result in larger brain sizes or enhanced visual memory yet the same evolutionary pressures associated with a cold environment would not also produce higher intelligence. Arctic peoples have clear physical adaptations to the cold, such as short, stocky bodies well-suited to conserving heat.
Furthermore, the argument that Lynn attempts is on the mutations/population size is special pleading—he is ignoring anomalies in his theory that don’t fit it. However, “evolution is not necessary for temperature and IQ to co-vary across geographic space” (Pesta and Poznanski, 2014).
If high ‘intelligence’ is supposedly an adaptation to cold temperatures, then what is the observation that disconfirms a byproduct hypothesis? On the other hand, if ‘intelligence’ is a byproduct, which observation would disconfirm an adaptationist hypothesis? No possible observation can confirm or disconfirm either hypothesis, therefore they are just-so stories. Since a byproduct explanation would explain the same phenomena since byproducts are also inherited, then just saying that ‘intelligence’ is a byproduct of, say, needing larger heads to dissipate heat (Lieberman, 2015). One can make any story they want to fit the data, but if there is no prediction of novel facts then how useful is the hypothesis if it explains the data it purports to explain and only the data it purports to explain?
It is indeed possible to argue that hotter climates need higher levels of intelligence than colder climates, which has been argued in the past (see Anderson, 1991; Graves, 2002; Sternberg, Grigorenko, and Kidd, 2005). Indeed, Sternberg, Grigorenko, and Kidd (2005: 50) write: “post hoc evolutionary arguments … can have the character of ad hoc “just so” stories designed to support, in retrospect, whatever point the author wishes to make about present-day people.” One can think up any “just-so” story to explain any data. But if the “just-so” story doesn’t make any risky predictions of novel facts, then it’s not science, but pseudoscience.
Vitamin D hypothesis
The VDH is simple: those populations that evolved in areas with seasonal, absent, or more variable levels of UVB have lighter skin than populations that evolved in areas with strong UVB levels year-round (Chaplan and Jablonksi, 2009: 458). Robins (2009) is a huge critic of the VDH, though her objections to the VDH have been answered (and will be discussed below).
The VDH is similar to the CWT in that it postulates that the adaptations in question only arose due to migrations out of our ancestral lands. We can see a very strong relationship between high UVB rays and dark skin and conversely with low UVB rays and light skin. Like with the CWT, the VDH has an anomaly and, coincidentally, the anomaly has to do with the same population involved in the CWT anomaly.
Arctic people have dark-ish skin for living in the climate that they do. But since they live in very cold climates then we have a strange anomaly here that needs explaining. We only need to look at the environment around them. They are surrounded by ice. Ice reflects UVB rays. UVB rays hit the skin. Arctic people consume a diet high in vitamin D (from fish). Therefore what explains Arctic skin color is UVB rays bouncing off the ice along with their high vitamin D diet. The sun’s rays are, actually, more dangerous in the snow than on the beach, with UVB rays being 2.5 more times dangerous in the snow than beach.
Evolution in different geographic locations over tens of thousands of years caused skin color differences. Thus, we can expect that, if peoples are out of the conditions where their ancestors evolved their skin color, that there would then be expected complications. For example, if human skin pigmentation is an adaptation to UV rays (Jablonski and Chaplan, 2010), we should expect that, when populations are removed from their ancestral lands and are in new locations with differing levels of UV rays, that there would be a subsequent uptick in diseases caused by vitamin D deficiencies.
This is what we find. We find significant differences in circulating serum vitamin D levels, and these circulating serum vitamin D levels then predict health outcomes in certain populations. This would only be true if sunlight influenced vitamin D production and that skin progressively gets lighter as one moves away from Africa and other tropical locations.
Skin pigmentation regulates vitamin D production (Neer, 1975). This is due to the fact that when UVB rays strike the skin, we synthesize vitamin D, and the lighter one’s skin is, the more vitamin D can be synthesized in areas with fewer UVB rays. (Also see Daraghmeh et al, 2016 for more evidence for the vitamin D hypothesis.)
P1) UV rays generate vitamin D in human skin
P2) Human populations that migrate to climates with less sunlight get fewer UV rays
P3) To produce more vitamin D, the skin needs to get progressively lighter
C) Therefore, what explains human skin variation is climate and UV rays linked to vitamin D production in the skin.
Novel predictions
Science is the generation of novel facts from risky predictions (Musgrave, 1988; Winther, 2009). And so, hypotheses that predict novel facts from risky predictions are scientific hypotheses, whereas those hypotheses that need to continuously backtrack and think up ad-hoc hypotheses are then pseudoscientific. Pseudoscience is simple enough to define. The Stanford Encyclopedia of Philosophy defines it as:
“A pretended or spurious science; a collection of related beliefs about the world mistakenly regarded as being based on scientific method or as having the status that scientific truths now have.”
All theories have a protective belt of ad hoc hypotheses. Theories become pseudoscientific when they fail to make new predictions and must take on more and more ad-hoc hypotheses that have no predictive value. If the ad-hoc hypotheses that are added to the main hypothesis have no predictive value then the new explanations for whichever hypothesis that is in danger of being falsified are just used to save the hypothesis from being refuted and it thus becomes pseudoscience.
In the case of CWT, it makes no prediction of novel facts; it only explains the data that it purports to explain. What is so great about the CWT if it makes no predictions of novel facts and only explains what it purports to explain? One may attempt to argue that it has made some ‘novel’ predictions but the ‘predictions’ that are proposed are not risky at all.
For example, Hart (2007: 417) makes a few “predictions”, but whether or not they’re “risky” or “novel” I’ll let you decide (I think they’re neither, of course). He writes that very few accomplishments will be made by Africans, or Australian or New Guinean Aborigines; members of those groups will not be highly represented in chess; and that major advances in scientific fields will come from those of European ancestry or the “Monglids”, Koreans, Chinese or Japanese.
On the other hand, Hart (2007: 417) makes two more “predictions”: he says that IQ data for Congoid Pygmies, Andaman Islanders, and Bantu-speaking people are few and far between and he believes that when enough IQ testing is undertaken there he expects IQ values between 60 and 85. Conversely, for the Lapps, Siberians, Eskimoes, Mongols and Tibetans, he predicts that IQ values should be between 85-105. He then states that if these “predictions” turn out to be wrong then he would have to admit that his hypothesis is wrong. But the thing is, he chose “predictions” that he knew would come to pass and therefore these are not novel, risky predictions but are predictions that Hart (2007) knows would come to pass.
What novel predictions has the VDH made? This is very simple. The convergent evolution of light skin was predicted in all hominids that trekked out of Africa and into colder lands. This occurred “because of the importance of maintaining the potential for producing pre-vitamin D3 in the skin under conditions of low annual UVB (Jablonski and Chaplin, 2000; Jablonski, 2004)” while these predictions “have been borne out by recent genetic studies, which have demonstrated that depigmented skin evolved independently by different molecular mechanisms multiple times in the history of the human lineage” (Chaplan and Jablonksi, 2009: 452). This was successfully predicted by Chaplan and Jablonski (2000).
The VDH still holds explanatory scope and predictive success; no other agent other than vitamin D can explain the observation that light skin is selected for in areas where there is low, absent or seasonal UVB. Conversely, in areas where there is a strong, year-round presence of UVB rays, dark skin is selected for.
Conclusion
Scientific hypotheses predict novel facts not known before the formulation of the hypothesis. The VDT has successfully predicted novel facts, whereas I am at a loss thinking of a novel fact that the CWT predicted.
In order to push an adaptationist hypothesis for CWT and ‘intelligence’, one must propose an observation that would confirm the adaptationist hypothesis while at the same time disconfirming the byproduct hypothesis. Since byproducts are inherited to, the byproduct hypothesis would predict the same things that an adaptationist hypothesis would. Thus, the CWT is a just-so story since no observation would confirm or disconfirm either hypothesis. On the other hand, the CWT doesn’t make predictions of novel facts, it makes “predictions” that are already known and would not undermine the hypothesis if disproved (but there would always be a proponent of the CWT waiting in the wings to propose an ad-hoc hypothesis in order to save the CWT, but I have already established that it isn’t science).
On the other hand, the VDT has successfully predicted that hominins that trekked out of Africa would have light skin which was then subsequently confirmed by genomic evidence. The fact that strong UVB rays year-round predict dark skin whereas seasonal, absent, or low levels of UVB predict light skin has been proved to be true. With the advent of genomic testing, it has been shown that hominids that migrated out of Africa did indeed have lighter skin. This is independent verification for the VDH; the VDH has predicted a novel fact whereas the CWT has not.

Delaying Gratification and Social Trust
1900 words
Tests of delayed gratification, such as the Marshmallow Experiment, show that those who can better delay their gratification have better life outcomes than those who cannot. The children who succumbed to eating the treat while the researcher was out of the room had worse life outcomes than the children who could wait. This was chalked up to cognitive processes by the originator of the test, while individual differences in these cognitive processes also were used as explanations for individual differences between children in the task. However, it doesn’t seem to be that simple. I did write an article back in December of 2015 on the Marshmallow Experiment and how it was a powerful predictor, but after extensive reading into the subject, my mind has changed. New research shows that social trust has a causal effect on whether or not one would wait for the reward—if the individual trusted the researcher he or she was more likely to wait for the other reward than if they did not trust the researcher, in which they were more likely to take what was offered in the first place.
The famous Marshmallow Experiment showed that children who could wait with a marshmallow or other treat in front of them while the researcher was out of the room, they would get an extra treat. The children who could not wait and ate the treat while the researcher was out of the room had worse life outcomes than the children who could wait for the other treat. These lead researchers to the conclusion that the ability to delay gratification depended on ‘hot’ and ‘cold’ cognitive processes. According to Walter Mischel, the originator of the study method, the ‘cool’ system is the thinking one, the cognitive system, which reminds you that you get a reward if you wait, while the ‘hot’ system is the impulsive system, the system that makes you want the treat now and not want to wait for the other treat (Metcalfe and Mischel, 1999).
Some of these participants were followed up on decades later, and those who could better delay their gratification had lower BMIs (Schlam et al, 2014); scored better on the SAT (Shoda, Mischel, and Peake, 1990) and other tests of educational attainment (Ayduk et al, 2000); along with other positive life outcomes. So it seems that placing a single treat—whether it be a marshmallow or another sweet treat—would predict one’s success, BMI, educational attainment and future prospects in life and that there are underlying cognitive processes, between individuals that lead to differences between them. But it’s not that simple.
After Mischel’s studies in the 50s, 60s and 70s on delayed gratification and positive and negative life outcomes (e.g., Mischel, 1958; Mischel, 1961; Mischel, Ebbeson, and Zeiss, 1972) it was pretty much an accepted fact that delaying gratification somehow was related to these positive life outcomes, while the negative life outcomes were partly a result of the lack of ability to delay gratification. Though in 2014, a study was conducted showing that ability to delay gratification depends on social trust (Michaelson et al, 2013).
Using Amazon’s Mechanical Turk, (n = 78, 34 male, 39 female and 5 who preferred not to state their gender) completed online surveys and read three vignettes in order—trusty, untrustworthy and neutral—while using a scale of 1-7 to note how likeable, trustworthy, and how sharing their likelihood of sharing. Michaelson et al (2013) write:
Next, participants completed intertemporal choice questions (as in Kirby and Maraković, 1996), which varied in immediate reward values ($15–83), delayed reward values ($30–85), and length of delays (10–75 days). Each question was modified to mention an individual from one of the vignettes [e.g., “If (trustworthy individual) offered you $40 now or $65 in 70 days, which would you choose?”]. Participants completed 63 questions in total, with 21 different questions that occurred once with each vignette, interleaved in a single fixed but random order for all participants. The 21 choices were classified into 7 ranks (using the classification system from Kirby and Maraković, 1996), where higher ranks should yield higher likelihood of delaying, allowing a rough estimation of a subject’s willingness to delay using a small number of trials. Rewards were hypothetical, given that hypothetical and real rewards elicit equivalent behaviors (Madden et al., 2003) and brain activity (Bickel et al., 2009), and were preceded by instructions asking participants to consider each choice as if they would actually receive the option selected. Participants took as much time as they needed to complete the procedures.
When one’s trust was manipulated in the absence of a reward, within the group of subjects influenced their ability to delay gratification, along with how trustworthy one was perceived to be, influenced their ability to delay gratification. So this suggests that, in the absence of rewards, when social trust is reduced, ability to delay gratification would be lessened. Due to the issues of social trust manipulation due to the order of how the vignettes were read, they did a second experiment using the same model using 172 participants (65 males, 63 females, and 13 who chose not to state their gender). Though in this experiment, a computer-generated trustworthy, untrustworthy and neutral face was presented to the participants. They were only paid $.25 cents, though it has been shown that the compensation only affects turnout, not data quality (Burhmester, Kwang, and Gosling, 2011).
In this experiment, each participant read a vignette and there was a particular face attached to it (trustworthy, untrustworthy and neutral), which were used in previous studies on this matter. They found that when trust was manipulated in the absence of a reward between the subjects, this influenced the participants’ willingness and to delay gratification along with the perceived trustworthiness influencing it as well.
Michaelson et al (2013) conclude that the ability to delay gratification is predicated on social trust, and present an alternative hypothesis for all of these positive and negative life outcomes:
Social factors suggest intriguing alternative interpretations of prior findings on delay of gratification, and suggest new directions for intervention. For example, the struggles of certain populations, such as addicts, criminals, and youth, might reflect their reduced ability to trust that rewards will be delivered as promised. Such variations in trust might reflect experience (e.g., children have little control over whether parents will provide a promised toy) and predisposition (e.g., with genetic variations predicting trust; Krueger et al., 2012). Children show little change in their ability to delay gratification across the 2–5 years age range (Beck et al., 2011), despite dramatic improvements in self-control, indicating that other factors must be at work. The fact that delay of gratification at 4-years predicts successful outcomes years or decades later (Casey et al., 2011; Shoda et al., 1990) might reflect the importance of delaying gratification in other processes, or the importance of individual differences in trust from an early age (e.g., Kidd et al., 2012).
Another paper (small n, n = 28) showed that the children’s perception of the researchers’ reliability predicted delay of gratification (Kidd, Palmeri, and Aslin, 2012). They suggest that “children’s wait-times reflected reasoned beliefs about whether waiting would ultimately pay off.” So these tasks “may not only reflect differences in self-control abilities, but also beliefs about the stability of the world.” Children who had reliable interactions with the researcher waited about 4 times as long—12 minutes compared to 3 minutes—if they thought the researcher was trustworthy. Sean Last over at the Alternative Hypothesis uses these types of tasks (and other correlates) to show that blacks have lower self-control than whites, citing studies showing correlations with IQ and delay of gratification. Though, as can be seen, alternative explanations for these phenomena make just as much sense, and with the new experimental evidence on social trust and delaying gratification, this adds a new wrinkle to this debate. (He also shortly discusses ‘reasons’ why blacks have lower self-control, implicating the MAOA alleles. However, I have already discussed this and blaming ‘genes for’ violence/self-control doesn’t make sense.)
Michaelson and Munakata (2016) show more evidence for the relationship between social trust and delaying gratification. When children (age 4 years, 5 months, n = 34) observed an adult as trustworthy, they were able to wait for the reward, compared to when they observed the adult as untrustworthy they ate the treat thinking that, since they observed the adult as untrustworthy, they were not likely to get the second marshmallow than if they waited for the adult to return if they believed him to be untrustworthy. Ma et al (2018) also replicated these findings in a sample of 150 Chinese children aged 3 to 5 years old. They conclude that “there is more to delay of gratification than cognitive capacity, and they suggest that there are individual differences in whether children consider sacrificing for a future outcome to be worth the risk.” Those who had higher levels of generalized trust waited longer, even when age and level of executive functioning were controlled for.
Romer et al (2010) show that people who are more willing to take risks may be more likely to engage in risky behavior that provides insights to that specific individual on why delaying gratification and having patience leads to longer-term rewards. This is a case of social learning. However, people who are more willing to take risks have higher IQs than people who do not. Though SES was not controlled for, it is possible that the ability to delay gratification in this study came down to SES, with lower class people taking the money, while higher class people deferred. Raine et al (2002) showed a relationship between sensation seeking in 3-year-old children from Mauritius, which then was related to their ‘cognitive scores’ at age 11. As usual, parental occupation was used as a measure of ‘social class’, and since SES does not capture all aspects of social class then controlling for the variable does not seem to be too useful. Because a confound here could be that children from higher classes have more of a chance to sensation seek which may cause higher IQ scores due to cognitive enrichment. Either way, you can’t say that IQ ’causes’ delayed gratification since there are more robust predictors such as social trust.
Though the relationship is there, what to make of it? Since exploring more leads to, theoretically, more chances to get things wrong and take risks by being impulsive, those who are more open to experience will have had more chances to learn from their impulsivity, and so learn to delay gratification through social learning and being more open. ‘IQ’ correlating with it, in my opinion, doesn’t matter too much; it just shows that there is a social learning component to delaying gratification.
In conclusion, there are alternative ways to look at the results from Marshmallow Experiments, such as social trust and social learning (being impulsive and seeing what occurs when an impulsive act is carried out may have one learn, in the future, to wait for something). Though these experiments are new and the research is young, it’s very promising that there are other explanations for delayed gratification that don’t have to do with differences in ‘cognitive ability’, but depend on social trust—trust between the child and the researcher. If the child sees the researcher is trustworthy, then the child will wait for the reward, whereas if they see the researcher is not trustworthy, they ill take the marshmallow or whatnot, since they believe the researcher is not trustworthy and therefore won’t stick to their word. (I am also currently reading Mischel’s 2014 book Marshmallow Test: Mastering Self-Control and will have more thoughts on this in the future.)
