
Home » 2017 (Page 5)
Yearly Archives: 2017
There is No ‘Marching Up the Evolutionary Tree’
2000 words
The notion that there is any ‘progress’ to evolution is something that I have rebutted countless times on this blog. My most recent entry being Marching Up the ‘Evolutionary Tree’? which was a response to Pumpkin Person’s article Marching up the evolutionary tree. Of course, people never ever change their views in a discussion (I have seen it, albeit it is rare) due, mainly to, in my opinion, ideology. People have so much time invested in their little pet theories that they cannot possibly fathom at the thought of being wrong or being led astray by shoddy hypotheses/theories that confirm their pre-existing beliefs. I will quote a few comments from Pumpkin Person’s blog where he just spews his ‘correlations with brain size and ‘splits’ on the ‘evolutionary tree” that ‘proves that evolution is progressive’, then I will touch on two papers (I will cover both in great depth in the future) that directly rebut his idiotic notion that so-called brain size increases across our evolutionary history (and even before we became humans) are due to ‘progress in evolution’
One of my co-bloggers Phil wrote:
I think you mistyped that, but i see your point. Problem, however, most of your used phylogenies were unbalanced.
Based on the definition you provided, but not based on any meaningful definition. To me, an unbalanced tree is . . .
This is literally meaningless. Keep showing that you’ve never taken a biology class in your life, it really shows.
All it is is ignorance to basic biological thinking, along with an ideology to prove his ridiculous Rushtonian notion that ‘brain size increases prove that evolution is progressive’.
You have yet to present ANY scientific logic, and my argument about taxonomic specificity is clearly beyond you.
Scientific logic?! Scientific logic?! Please. Berkely has a whole page on misconceptions on evolution that directly rebut his idiotic, uneducated views on evolution. It doesn’t help that his evolution education most likely comes from psychologists. Nevertheless, PP’s ‘argument’ is straight garbage. Taxonomic specificity’ is meaningless when you don’t have an understanding of basic biological concepts and evolution. (I will have much more to say on his ‘taxonomic specificity’ below.)
PP writes:
Was every tree perfect? No, but most were pretty close, and keep in mind that any flawed trees would have the effect of REDUCING the correlation between brain size/encephalization and branching, because random error is a source of statistical noise which obscures any underlying relationship. So the fact that I repeatedly found such robust correlation in spite of alleged problems with my trees, makes my conclusions stronger, not weaker.
The fact that you ‘repeatedly’ found ‘correlations’ in spite of the ‘problems’ with your trees makes your ‘conclusions’ weaker. Comparing organisms over evolutionary time and you notice a ‘trend’ in brain size. Must mean that evolution is progressive and brain size is its calling card!!
PP writes:
I’m right and all the skeptics you cite are wrong.
Said like a true idealogue.
Here is where PP’s biggest blunder comes in:
It’s not how many splits they have that I’ve been measuring, it’s how many splits occur on the tree before they branch off. Here’s a source from 2017:
Eukaryotes represent a domain of life, but within this domain there are multiple kingdoms. The most common classification creates four kingdoms in this domain: Protista, Fungi, Plantae, and Animalia.
So you needed ‘a source from 2017’ to tell you something that is literally taught on the first day of biology 101? Keep showing how uneducated you are here.
Nothing fallacious about a correlation between number of splits and brain size/encephalization.
Post hoc, ergo propter hoc is a Latin phrase for “after this, therefore, because of this.” The term refers to a logical fallacy that because two events occurred in succession, the former event caused the latter event.[1][2]
…
Magical thinking is a form of post hoc, ergo propter hoc fallacy, in which superstitions are formed based on seeing patterns in a series of coincidences. For example, “these are my lucky trousers. Sometimes good things happen to me when I wear them.”
P1: X happened before Y.
P2: (unstated) Y was caused by something (that happened before Y).
C1: Therefore, X caused Y.
Here is PP’s (fallacious) logic:
P1: splits (X) happened before Y (brain size increase)
P2: (unstated) brain size increase was caused by something (that happened before brain size increaes [splits on the tree])
C1: therefore, splits caused brain size increase
Now, I know that PP will argue that ‘splits on the evolutionary tree’ denote speciation which, in turn, denotes environmental change. This is meaningless. You’re still stating that Y was caused by something (that happened before Y) and therefore inferring that X caused Y. That is the fallacy (which a lot of HBD theories rest on).
PP writes:
You don’t get it. Even statistically insignificant correlations become significant when you get them FIVE TIMES IN A ROW. If you want to believe it was all a coincidence, then fine.
Phylogenies are created from shared derived factors. Berkely is the go-to authority here on this matter. (No that’s not appeal to authority.) Biologists collect information about a given animal and then infer the evolutionary relationship. Furthermore, PP’s logic is, again, fallacious. Berkely also has tips for tree reading, which they write:
Trees depict evolutionary relationships, not evolutionary progress. It’s easy to think that taxa that appear near one side of a phylogenetic tree are more advanced than other organisms on the tree, but this is simply not the case. First, the idea of evolutionary “advancement” is not a particularly scientific idea. There is no unbiased, universal scale for “advancement.” Second, taxa with extreme versions of traits (which might be perceived as more “advanced”) may occur on any terminal branch. The position of a terminal taxon is not an indication of how adaptive, specialized, or extreme its traits are.
He may emphatically argue (as I know he will) that he’s not doing this. But, as can be seen from his article, X is ‘less advanced’ than Y, therefore splits, brain size, correlation=progress. This is dumb.
For anyone who wants to know how (and how not to) read phylogenies, read Gregory (2008). These idotic notions that PP espouses are what Freshman in college believe due to ‘intuitiveness’ about evolution. It’s so rampant that biologists have writen numerous papers on the matter. But some guy with a blog and no science background (and an ideology to hammer) must know more than people who do this for a living (educate people on phylogenies).
On Phil’s response to see the Deacon paper that I will discuss below, PP writes:
That’s not a rebuttal.
Yes it is, as I will show shortly.
The first paper I will discuss is Deacon’s (1990) paper Fallacies of Progression in Theories of Brain-Size Evolution. This is a meaty paper with a ton of great ideas about phylogenies, along with numerous fallacies that people go to when reading trees (my favorite being the Numerology fallacy, which PP uses, see below).
Deacon argues that since people fail to analyze allometry, this anatomists have mistaken artifacts for evolutionary trends. He also argues that many structural’brain size increases’ from ‘primitive to advanced forms’ (take note here, because this is what PP did and this is what discredits his idiotic ideology) are the result of allometric processes.
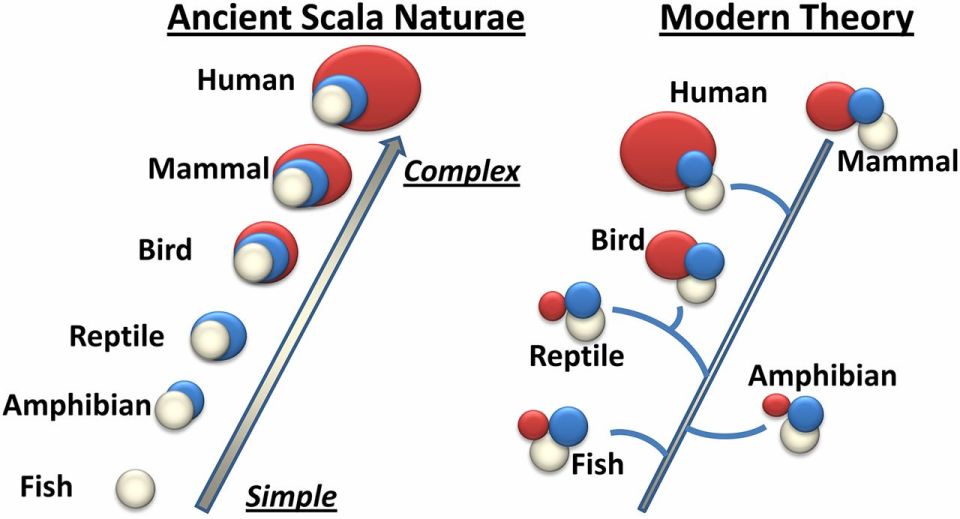
Source: Evolution of consciousness: Phylogeny, ontogeny, and emergence from general anesthesia Mashour and Alkire (2013)
This paper (and picture) show it all. This notion of scala naturae (which Rushton (2004) attempted to revive with r/K selection theory has been rebutted by me) was first proposed by Aristotle. We now know how the brain structure evolved, so the old ‘simple scala naturae‘ is, obviously, out of date in the study of brain evolution.
This paper is pretty long and I don’t have time to discuss all of it so I will just provide one quote that disproves PP’s ‘study’:
Whenever a method is discovered for simplifying the representation of a complex or apparently nonsystematic numerical relationship, the method of simplification itself provides new insight into the phenomenon under study. But reduction of a complex relationship to a simple statistic makes it far easier to find spurious relationships with other simple statistics. Numerology fallacies are apparent correlations that turn out to be artifacts of numerical oversimplification. Numerology fallacies in science, like their mystical counterparts, are likely to be committed when meaning is ascribed to some statistic merely by virtue of its numeric similarity to some other statistic, without supportive evidence from the empirical system that is being described.
Deacon also writes in another 1990 article titled Commentary on Ilya I. Glezer, Myron So Jacobs, and Peter J Morgane (1988) Implications of the “initial brain’9 concept for brain evolution in Cetacea:
The study of brain evolution is one of the last refuges for theories of progressive evolution in biology, but in this field its influence is still pervasive. To a great extent the apparent “progress” of mammalian brain evolution vanishes when the effects of brain size and functional specialization are taken into account.
(It’s worth noting that in the author’s response to Deacon, he did not have any qualms about ‘progressive brain-size’.)
In regards to PP’s final ‘correlation’ on human races and brain-size, this is a perfect quote from McShea (1994: 1761):
If such a trend [increase in brain size leading to ‘intelligence’] in primates exists and it is driven, that is, if the trend is a direct result of concerted forces acting on most lineages across the intelligence spectrum, then the inference is justified. But if it is passive, that is, forces act only on lineages at the low-intelligence end, then most lineages will have no increasing tendency. In that case, most primate species—especially those out on the right tail of the distribution like ours—would be just as likely to lose intelligence as to gain it in subsequent evolution (if they change at all).
The ‘trend’ is passive. Homo floresiensis is the best example. We are just as likely to lose our ‘intellect’ and our ‘big brains’ as we are to ‘get more intelligent’ and ‘smaller brains’. The fact of the matter is this: environment dictates brain size/whatever other traits an organism has. Imagine a future environment that is a barren wasteland. Kilocalories are scarce; do you think that humans would keep their big brains—which are two percent of their body weight accounting for a whopping 25 percent of total daily energy needs—without enough high-quality energy? When brain size supposedly began to increase in our taxa is when erectus learned to control fire and cook meat (Hlublik et al, 2017).
All in all, there is no ‘progress’ to evolution and, as Deacon argues, so-called brain-size increases across evolutionary time disappear after adjustments for body size and functional specialties are taken into account. However, for the idealogue who looks for everything they can to push their ideology/worldview, things like this are never enough. “No, that wasn’t a rebuttal! YOU’RE WRONG!!” Those are not scientific arguments. If one believes in ‘evolutionary progress’ and that brain-size increases are the proof in the pudding that evolution is ‘progressive’ (re has a ‘direction’), then they must rebut Deacon’s arguments on allometry and his fallacies in his 1990 paper. Stop equating evolution with ‘progress’. Though, I can’t fault laymen for believing that. I can, however, fault someone who supposedly enjoys the study of evolution. You’re wrong. The people you cite (who are out of their field of expertise) are wrong.
Evolution is an amazing process. To equate it with ‘progress’ does not allow one to appreciate the beauty of the process. Evolution does carry baggage with it, and if I weren’t so used to the term I would use Descent by Modification (DbM, which is what Darwin used). Nevertheless, progressionists will hide out in whatever safehold they can to attempt to push their idealogy that is not based on science.
(Also read Rethinking Mammalian Brain Evolution by Terrence Deacon. I go more in depth on these three articles in the future.)
Testosterone: “The Crime Gene?”
1150 words
I came across this video on YouTube last night by a geneticist/science writer Steve Jones. He is also the Emeritus Professor of genetics at University College London. This makes what he says in the video I will speak about below very troubling—especially to a man of his caliber with the knowledge he has—views he has on the hormone.
In the very beginning of the video titled Testosterone and Crime: What Can Genes Tell Us About Behavior?, Jones says “But in fact, there are genes—there is a gene—for crime, which causes nearly all the crime, and is widely used and we understand a great deal about it. It’s a chemical gene it produces a particular chemical, which we understand in detail is the chemical testosterone. Testosterone—we all have it but some of us have rather more than others—testosterone is of course a gene that is made—switched on by the Y chromosome and makes males male. Women have a small amount but only a small amount and as they get older … Now testosterone is a dangerous, dangerous thing to have. I don’t recommend it, those of you who have it, don’t get it. And if you’ve got some, don’t get any more.” What bullshit! This guy is a literal genetics Ph.D. saying this; this is proof that knowledge/educational attainment does not stop you from saying dumb, untrue things.
“I don’t know that this character does it, but certainly plenty of bodybuilders inject steroids—testosterone—into themselves. They damage themselves severely. Their life expectancy goes down strikingly. They die for all those male reasons. They die from violence, they die from suicide, they die from car accidents, they die from heart disease, all those things are true of males. … But even if you look at males and females in general, there is kind of a depressing picture for half of the room, I’m not sure which half.” Jones then talks about how men die at a much higher rate than women for a slew of reasons. This is his logic: Men have higher testosterone than women. Testosterone is shown to cause violence, aggression, heart disease, risk-taking, etc. Men have way more testosterone than women. Therefore testosterone is the reason why men die more than women and commit more violence than women. This is horrible logic—coming from a geneticist no less!
“Men actually—less expectedly perhaps—are much less good at dealing with parasites and infectious disease than women are. And that’s because testosterone—the male hormone—suppresses the immune system. Now the immune system fights off the parasites and we don’t do nearly as well.” There is actually some empirical data for his argument here. Back in 2013, it was shown that testosterone, gene expression, and the immune system were linked. They discovered that higher levels of testosterone prevented Module 52 genes from turning on. So higher levels of testosterone result in more Module 52 expression. Testosterone also does exert immune-suppressing effects, “increasing the severity of malaria, leishmaniasis, amebiasis, and tuberculosis, while at the same time supporting the clearance of toxoplasmosis (Bernin & Lotter, 2014; Nhamoyebonde & Leslie, 2014)” (Giefing-Kroll et al, 2015). The suppressive effects of testosterone on the immune system and how down-regulates “the systemic immune response by cell type specific effects in the context of immunological disorders.” (Trigunaite, Dimo, and Jorgensen, 2015).
The effects of testosterone replacement therapy (TRT) on the immune system have not been looked into, but it has a positive effect on elderly men (Osterberg, Bernie, and Ramasamy, 2014). However, Braude, Tang-Martinez, and Taylor (1999) challenge the wisdom that testosterone is an immuno-depressor. This is Jones’ only claim that is not outright wrong; there is data out there for both positions (of course I think that Braude, Tang-Martinez and Taylor, 1999 drive a solid argument against the testosterone-causes-immuno-suppression hypothesis).
The Jones says one of the dumbest things I’ve ever heard “And men, of course, are murdered much more than women. And who murders them—of course—other men. … Men murder at a much higher rate than women. … And that effect is striking—that effect is true worldwide—all over the world men, testosterone, murder at 10 times the rate of women. … So it’s a universal, it’s a biological universal, it’s clearly due to testosterone. There’s no question. The evidence is absolutely clear. So it’s a genetic phenomenon, it’s a gene for crime.” Should I be nice here and assume that whatever ‘gene’ he’s proposing that ’causes’ testosterone production actually causes the crime? Or should I take what he said at face value—that testosterone is a literal gene that causes crime? I think I’ll go with the second one.
“It’s certainly genetic, it’s also environmental. And you can’t disentangle it. You can change part of it—the environment—you can’t change the other part—the genes. And I always find it kind of odd that the public is so interested in the bit you can’t change—the genes—and is so uninterested in the bit you can—the environment.” This is wrong. Not all of it, but most of it. I don’t think that people are more interested in genes and toss aside environment—especially for testosterone. Because, as I documented yesterday, hereditarians assume that since testosterone has a heritability of around .6 then it must be mostly genetic in nature. This is wrong. As Jones said, the environment effects testosterone production too (though he didn’t go into the mechanisms).
The Left goes to the environment side—change the environment, change hormone production (this is true)—whereas the Right goes to the genes side—can’t change genes and environment is a product of genes so nothing can be done. (Oversimplified, don’t crucify me.) Both are wrong. Strong genetic determinism (gene G almost always leads to the development of trait T. (G increases the probability of T and the probability of T, given G, is 95% or greater) doesn’t make sense because a large majority of traits are moderately or weakly determined by genetics (Resnick and Vorhaus, 2006).
In sum, Jones is clueless about testosterone. He only really said one thing that is not outright wrong (but it is questionable). It doesn’t cause crime, it doesn’t cause men to murder more. The press has gotten all of these views into people’s heads because they want to demonize men—and the hormone that is largely responsible for male-ness. It’s incredible that this guy is both a geneticist, science writer and professor of genetics and still calls testosterone a ‘gene’ saying that it is responsible for ‘most of the crime’ committed. Anyone who has been reading this blog for the past year or so since I have began revising many of my main views knows how wrong this is. People really need to get a clue on testosterone and stop spreading bullshit. I know that I’ll have to keep correcting misconceptions on testosterone for a good long time (like with r/K theory) but I enjoy writing about both things so it’s not too big a deal. I just wish people would actually educated themselves on basic physiology so that the trainwreck of a video that Jones made does not get made.
No, Black Women Do Not Have Higher Testosterone than White Women (And More On Hereditarian Claims on Racial Testosterone Differences)
1850 words
It has been over a year since I wrote the article Black Women and Testosterone, and I really regret it. Yes, I did believe that black women had higher levels of testosterone than white women due to one flimsy study and another article on pregnant black women. I then wised up to the truth about testosterone and aggression/crime/race/sex and revised the articles (like I have done with r/K selection theory). However, after I revised my views on the supposed differences in testosterone between black men/white men and black women/white women, people still cite the article, disregarding the disclaimer at the top of the article. I quoted Mazur (2016), who writes (emphasis mine):
The pattern [high testosterone] is not seen among teenage boys or among females.
…
There is no indication of inordinately high T among young black women with low education.
…
Honor cultures are cast as male affairs, but with T data in hand for both sexes, it is worth exploring whether or not a similar pattern exists among women. Mean T was calculated as a function of age for the four combinations of race and education used in Table 1 but now for women. All plots show T declining with age, from about 35 ng/dL in the 20–29 age group to about 20 ng/dL among women 60 years and older. The four plots essentially overlap without discernible differences among them. Given the high skew of T among adult females, both raw and ln-transformed values were analyzed with similar results. There is no indication of inordinately high T among young black women with low education.
…
In the present study, at least, the sexes differ because the very high T seen among young black men with low education does not occur among young black women with low education.
This is very clear… Mazur (2016) analyzed the NHANES 2011-2012 data and this is what he found. I understand that most HBD bloggers do believe this, well, like a lot of their strong assertions (which I have rebutted myself), they’re wrong. They don’t get it. They do not understand the hormone.
The reason why I’m finally writing this (which is long overdue) is that I saw a referral from this website today: https://www.minds.com/RedPillTV who writes about the aforementioned black women and testosterone article:
It is known that blacks have the highest levels of testosterone out of the major races of humanity. However, what’s not known is that black women have higher rates than white women. The same evolutionary factors that make it possible for black men to have high testosterone make it possible for women as well.
https://notpoliticallycorrect.me/2016/09/06/black-women-and-testosterone/
…..No. It seems that people just scroll on by the disclaimer at the top that is bolded and italicized and just go to the (now defunct) article and attempt to prove their assertion that black women have higher testosterone than white women with an article that I have stated myself I no longer believe and have provided the rationale/data for the position. This shows that people have their own biases and no matter what the author writes about their views that have changed due to good arguments/data, they will still attempt to use the article to prove their assertion.
I’ve written at length that testosterone does not cause 1) aggression, 2) crime and 3) prostate cancer. People are scared of testosterone mostly due to the media fervor of any story that may have a hint of ‘toxic masculinity’. They (most alt-righters) are scared of it because of Lynn/Rushton/Templer/Kanazawa bullshit on the hormone. Richard Lynn doesn’t know what he’s talking about on testosterone. No, Europeans did not need lower levels of aggression in the cold; Africans didn’t need higher levels of aggression (relative to Europeans) to survive in the tropics. The theory that supposed differential testosterone differences between the races are “the physiological basis in males of the racial differences in sexual drive which form the core of the different r/K reproduction strategies documented by J.P. Rushton” (Lynn, 1990: 1203). The races, on average, do not differ in testosterone as I have extensively documented. So hereditarians like Lynn and others need to look for other reasons to explain blacks’ higher rate of sexual activity.
Rushton’s views on the testosterone and supposed r/K continuum have been summarily rebutted by me. These psychologists’ views on the hormone (that they don’t understand the production of nor do they understand the true reality of the differences between the races) are why people are afraid of testosterone. No, testosterone is not some ‘master switch’ as Rushton (1999) asserts. Rushton asserts that racial differences in temperament are mediated by the hormone testosterone. He further dives into this assertion stating “Testosterone level correlates with temperament, self-concept, aggression, altruism, crime, and sexuality, in women as well as in men (Harris, Rushton, Hampson, & Jackson, 1996). It may ‘correlate’ with aggression and crime, but as I have documented, they do not cause either.
The aggression/testosterone correlation is only .08 (Archer, Graham-Kevan, and Davies, 2005). Furthermore, the diurnal variation in testosterone does not directly correlate to when testosterone levels are highest in the day (at 8 am and drop thereafter), with adults peaking in crime at 10 pm and kids at 3 pm, with rises at 8 pm and 12 pm (not surprisingly, kids go in to school around 8 am, go to recess at 12 and leave at 3).

(Source: The Office of Juvenile Justice and Delinquency Prevention (OJJDP))
If you’ve read as much Rushton as I have, you’ll notice that he begins to sound like a broken record when talking about certain things. One of the most telling is Rushton’s repeated assertions that blacks average 3-19 percent higher testosterone than whites. The 3 percent number comes from Ellis and Nyborg (1992) and the 19 percent number comes from Ross et al (1986) (which Rushton should know that after adjustments for confounding, it decreased to 13 percent). These are the only studies that hereditarians ever cite for these claims that blacks average higher testosterone than whites. That seems a bit fishy to me. Cite a 30-year-old study along with a 25-year-old study (with such huge variation from Rushton and those who cite him for this matter—3-19 percent!!) as ‘proof’ that blacks average such higher levels of testosterone in comparison to whites.
Ross et al (1986) is one of the most important studies to rebut for this hereditarian claim that testosterone causes all of these maladies in black American populations. Ross et al (1986) propose that higher levels of the hormone lead to the higher rates of prostate cancer in black American populations. However, meta-analyses do not show this (Zagars et al, 1998; Sridhar et al, 2010).
Rushton et al’s assertions—largely—lie on this supposed testosterone difference between the races and how it supposedly leads to higher rates of crime, prostate cancer, aggression, and violence. However, the truth of the matter is, this is all just hereditarian bullshit. Larger analyses—as I have extensively documented—do not show this trend. And even accepting the claim that blacks have, say, 19 percent higher levels of testosterone than whites, it still would not explain the supposed prostate cancer rates between the races (Stattin et al, 2003; Michaud, Billups, and Partin, 2015). Even if blacks had 19 percent higher testosterone than whites, it would not explain higher levels of crime nor aggression due to such a hilariously low correlation of .08 (Archer, Graham-Kevan, and Davies, 2005).
Finally, I have a few words for Michael Hart and his (albeit sparse) claims on testosterone in his 2007 book Understanding Human History.
Hart (2007) writes:
(Many of these differences in sexual behavior may be a consequence of the fact that
blacks, on average, have higher levels of testosterone than whites.7) (pg. 127)
And….. footnote number 7 is…. surprisingly (not): 7) Ross, R., et al. (1986). Not going to waste my time on this one, again. I’ve pointed out numerous flaws in the study. (I will eventually review the whole thing.)
It seems unlikely, though, that the higher testosterone level in blacks — which is largely genetic in origin — has no effect on their sexual behavior (pg. 128; emphasis mine)
This is bullshit. People see the moderately high heritability of testosterone (.60; Harris, Vernon, and Boomsma, 1998) and jump right to the “It’s genetics!!!” canard without even understanding its production in the body (it is a cholesterol-based hormone which is indirectly controlled by DNA, there are no ‘genes for’ testosterone). Here are the steps: 1) DNA codes for mRNA; 2) mRNA codes for the synthesis of an enzyme in the cytoplasm; 3) luteinizing hormone stimulates the production of another messenger in the cell when testosterone is needed; 4) this second messenger activates the enzyme; 5) the enzyme then converts cholesterol to testosterone
I have documented numerous lines of evidence showing that testosterone is extremely sensitive to environmental factors (Mazur and Booth, 1998; Mazur, 2016), and due to the homeodynamic physiology we have acquired due to ever-changing environments (Richardson, 2017), this allows our hormones to up- or down-regulate depending on what occurs in the environment. The quote from Hart is bullshit; he doesn’t know what he’s talking about.
For females in Siberia, the disadvantages of failing to find a man who would
provide for her and her children during their childhood were much greater than they were in tropical climates, and females who were not careful to do so were much less likely to pass on their genes. Furthermore, because females in harsh climates were so demanding on this point, males who seemed unlikely to provide the needed assistance found it hard to find mates. In other words, there was a marked sexual selection against such males. Such selection could result, for example, in the peoples living in northerly climates gradually evolving lower levels of testosterone than the peoples living in subSaharan Africa. (pg. 131)
This is a bullshit just-so story. Africans in Africa have lower levels of testosterone than Western men (Campbell, O’Rourke, and Lipson, 2003; Lucas and Campbell, and Ellison, 2004; Campbell, Gray, and Ellison, 2006).
Note also that a difference in testosterone level frequently affects not
only the sexual behavior of a young male, but also his aggressiveness.
No it does not (Archer, Graham-Kevan, and Davies, 2005).
Thankfully, that’s all he wrote about testosterone. There is so much bullshit out there. Though, people who like and seek out the truth will learn that there are no racial differences and that testosterone does not cause crime/aggression/prostate cancer and that it’s just hereditarian bullshit.
The evidence I have amassed and the arguments I have given point to a few things: 1) the races do not differ in testosterone/there is a small negligible difference; 2) testosterone does not cause crime; 3) testosterone does not cause aggression; 4) black women do not have higher levels of testosterone than white women; 5) high levels of testosterone do not cause prostate cancer; and 6) even allowing a 19 percent black/white difference will not have hereditarian claims hold true.
So for anyone who comes across my old articles on testosterone and sex/race, do a bit more reading of my newer material here to see my new viewpoints/arguments. DO NOT cite these articles as proof for your claims of higher levels of black men/women. DO cite the old articles ALONG WITH the new ones to show how and why my views changed along with the studies I have cited that changed my view. (Actually understanding the production of testosterone in the body was a huge factor too, which I talk about in Why Testosterone Does Not Cause Crime.)
Doctors, IQ and Job Performance
1650 words
Job performance is supposedly one measure that validates the construct of IQ tests since they correlate so highly with IQ tests (Schmidt et al, 1986). However, there are problems with the methods used to get the high correlations (sometimes doubling correlations, there are also questions to the robusticity of the studies meta-analyzed); corrections used have to make a number of assumptions; uncertainty of the interpretation of what the supposed IQ and job performance correlations mean; other non-cognitive factors may also explain differences in job performance. Most surprisingly, intelligence test scores did not predict promotion to senior doctor and intelligence does not predict careers.
Job performance and IQ
Does IQ really correlate around .5 with job performance like is so commonly stated? There are a number of problems citing such the commonly used meta-analyses for evidence that IQ does indeed predict job performance.
Richardson and Norgate (2015) show that one should use caution when interpreting the results of IQ and job performance on the basis of numerous criteria. It is important to note that job performance is rated by supervisors, which is, of course, a problem since supervisors tend to be subjective in their ratings. Further, supervisor ratings have low correlations with work performance, while work knowledge has a correlation of around .3 (Richardson and Norgate 2015; Richardson, 2002). So, one of the main things that the correlation hinges upon is strongly subjective.
However, one of the most important things to note here is that the validation of IQ tests is relied on with correlations with other tests. For instance, blood alcohol and level of consumption are valid constructs. The higher your blood alcohol is, the more alcohol you consumed. There is no such validity for the construct of IQ—except correlations with other tests—which is a huge problem. This goes back to the fact that there is no individual theory of intelligence differences (Deary, 2001: 14) and no neurophysiological theory of g (Jensen, 1998: 257).
So IQ tests don’t have the same construct validity that other models that describe biologic/physiologic functions do; hundreds of studies before the 70s showed low correlations between IQ and job performance; corrections for error make a lot of assumptions; the common claim that the IQ/job performance correlation increases with more complex jobs is not observed in more recent studies; and there is great uncertainty in the interpretation of the IQ and job performance correlation, due to the fact that there is no construct validity to IQ tests. This goes back to the question: What is it that IQ tests test (Richardson, 2002)? Is it the ever-elusive general factor of intelligence? I’m skeptical there.
Richardson (2017) writes:
The committee described the differences as “puzzling and somewhat worrisome.” But they noted how the quality of the data might explain it. For example, the 264 newer studies have much greater numbers of participants, on average (146 versus 75). It was shown how the larger samples produced much lower sampling error and less range restriction, also requiring less correction (with much less possibility of a false boost to observed correlations). And there was no need to devise estimates to cover for missing data. So, even by 1989, these more recent results are indicative of the unreliability of those usually cited. But it is the earlier test results that are still being cited by IQ testers. (pg. 89)
IQ and job performance correlations are also substantially weaker in other parts of the world, such as the Middle East and China, where motivation and effort explain school and work performance and not cognitive ability (Byington and Felps, 2010). So, again, caution is to be taken when interpreting any IQ and job performance correlation, as well as—most importantly—asserting that higher IQ means better job performance.
In his 2015 book Intelligence in the Flesh, Guy Claxton wrote:
We saw earlier that Google is not impressed by people’s track records of success, but is equally sceptical of high IQs. Laszlo Bock, the senior vice-president in charge of ‘people operations’ – the head of HR – says: ‘For every job the No. 1 thing we look for is general cognitive ability, and it’s not I.Q. It’s learning agility. It’s the ability to process on the fly.‘ Behind the ability to learn quickly lies what Bock calls ‘intellectual humility.’ You have to be able to give up the knowledge and expertise you thought would see you through, and look with fresh eyes. People with a high IQ ofen have a hard time doing that. They are certainly no better than average at tolerating uncertainty or being able to adopt fresh perspectives.
Now that we know to take caution when speaking about the IQ and job performance correlation, what do IQ tests say about success as a doctor?
Doctors and IQ
Since becoming a doctor is so demanding and takes a lot of time and motivation to complete a doctoral degree, most rightly assume that it takes a higher than average intelligence to acquire these accolades and become a medical doctor. However, reality is more nuanced.
McManus et al (2003) put forth three hypotheses: 1) the achievement argument: A-levels ensure maximum competence on sciences which are basic to medicine (biology and chemistry); 2) the ability argument: Academic success depends mainly on cognitive ability; and 3) the motivation argument: Using A-levels is effective because it University education not only reflects intelligence but motivation and good, consistent study skills.
There is evidence that IQ is irrelevant to becoming a doctor and that it did not predict dropping out of the program, career outcome, amount of research publications published, or stress, burnout and satisfaction with taking a career in medicine (McManus et al, 2003). Diplomas, higher academic degrees, and research publications were significantly correlated with personality.
McManus et al (2003) write:
Intelligence did not independently predict dropping off the register, career outcome, or other measures.
…
Intelligence does not predict careers, thus rejecting the ability argument. A levels predict because they assess achievement, and the structural model shows how past achievements predict future achievement.
And on the causes for dropping out:
All 511 students registered with the General Medical Council, but only 464 were on the 2001 Medical Register. The 47 doctors who left the register (a mean of 11.1 years after qualifying; SD 5.9; range 2-23) had lower A level grades but not lower AH5 scores (table A, bmj.com); see http://www.bmj.com for ROC analysis. Two doctors subsequently returned to the register. Of the remainder, three had died, contact details were available for 35, and no information was available for seven.
So lower intelligence scores were not the cause for dropping out.
McManus et al (2003), however, could not distinguish between the motivation and achievement argument, but falsified the intelligence argument (Hypothesis 2 was falsified, but not 1 and 3).
This was also replicated by McManus et al (2013), where they should that IQ scores did not predict promotion to senior doctor. A-level scores, yet again, predicted success better when it came to doctoral success.
Conclusion
The relationship between IQ and job performance is not as clear-cut as most would like to believe. One of the most important factors there, in my opinion, is the subjectivity of supervisors on the performance of their workers. Numerous factors could influence a supervisors’ view of an individual, biasing the supervisor to a high rating. Furthermore, the corrected correlations are a problem. More recent analyses show a correlation of .25 (Richardson, 2017: 89).
Perhaps more importantly, two studies show that there is no predictive effect on job performance when it comes to IQ for doctors (McManus et al, 2003; McManus et al, 2013). They show that A-level scores predict success better, with personality variables mediating other relationships—not IQ scores.
The fact of the matter is, job performance and IQ is on shaky ground since IQ tests are not constructed valid, and the job performance ratings are based on supervisor ratings which are highly subjective. Analyses in other locations around the world show that IQ does not predict job performance, however, motivation and effort do. IQ does not predict a doctor’s job performance; job performance tests do not prove the validity of IQ tests.
IQ does not predict a doctor’s job performance; job performance tests do not prove the validity of IQ tests.
[Edit: I have come across more data on doctors IQ. Some studies show that complaints by patients on their doctors are related to infractions. Perry and Crean (2005) show that the average IQ for a doctor is 125. They also state that neurocognitive impairment may be responsible for 63% of all physician related adverse events. This same observation is also noted in other studies (Pitkanen, Hurn, and Kopelman, 2008; Lauri et al, 2009; Kataria et al, 2014). Also of note is that these papers—to the best of my knowledge—do not explore the role of stress in cognitive decline. Though Pitkanen, Hurn, and Kopelman (2008) note that depression, PTSD, amnesia, transient global amnesia, alcoholic brain damage, frontotemporal dimentia, dimentia, alzheimer’s disease, vascular dimentia, and post-traumatic amnesia (PTA) influence cognitive decline in doctors.
Veena et al, (2015) show that 88 percent of medical students had near average intelligence, putting in 6 hours a day of studying, while 10 percent of students had above average IQ, spent less time studying but were sincere in their classes.
Veena et al (2015) conclude:
Students with near average IQ work hard in their studies and their academic performance was similar to students with higher IQ. So IQ can`t be made the basis for medical entrance; instead giving weight-age to secondary school results and limiting the number of attempts may shorten the time duration for entry and completion of MBBS degree.
So students with average intelligence work just as hard (if not harder) than people with above average IQ and have similar educational achievement. This shows that IQ can’t be the basis for medical school entry.
This is a really interesting matter and I will cover it more in the future. I’ve been wondering for years if there is data on physician/doctoral malpractice and race I have yet to come across any papers on the matter. If anyone knows of any, please leave some citations.]
r/K Selection Theory Rebuttals
2100 words
The other day Anonymous Conservative (AC) published an article titled Criticism Of r/K Theory In The Comments. I’m not too worried about what he wrote in the main article (I may tackle that later if I feel up to it), but what I am worried about is someone’s critique of my article r/K Selection Theory: A Response to Anonymous Conservative. Since this guy uses AC’s writings who, of course, is influenced by Rushton’s application of r/K to humans, it shows that he’s pretty clueless about 1) the theory as a whole and 2) the theory’s ultimate status in biology. (Also check out Phil’s comments in the AC thread.)
The individual in question, one ‘Samuel Skinner’ calls my critique of AC “genuinely bad” and that he would “cover the most obvious mistakes“, well let’s take a look at my ‘genuinely bad‘ critique to AC.
RR: You don’t get it. Mongoloids being r-selected is straight from Rushton. He asserts that they have cold-adaptations. Cold adaptations are due to cold weather. Cold weather is an agent of r-selection (temperature extreme).
Samuel Skinner: Mongoloids have a variety of genetic adaptions to cold. If you drop one buck naked in the winter, they will still freeze to death. The actual adaption they have is wearing thick clothing covering the entire body, something that is both K and not existent in Africa. Needless to say knowing how to gather materials, make clothing and maintain it is a K selective pressure.
So “the actual adaptation they have” is to “wear thick clothing“? This is bullshit and you know it. I covered human physiological adaptations to the cold last month: Human Physiological Adaptations to Climate. Clothes weren’t made in Africa? “Knowing how to gather materials, make clothing and maintaining it” is not a “K selective pressure“.
RR: Endemic (native) disease is an agent of K-selection. Since the disease is constant, then the population under that agent of K-selection can prepare ahead for disease.
Samuel Skinner: That requires the preparation to actually work; if preparation has less effect on genetic pay offs then having children faster, having children faster wins.
The preparation does work. In the case of malaria (an endemic disease), one-fifth of patients use traditional malarial remedies in malaria-stricken countries (Wilcox and Bodecker, 2004).
Endemic and infectious disease is an agent of K-selection:
(From Anderson, 1991: 53)
RR: Do groups not work together in Africa to reach common goals? In the Pleistocene as well? Citations? Think before you write (and cite), because hunting bands in our species began with Homo erectus.
Samuel Skinner: NPC talks about clannishness and IQ difference in other posts. So he does believe that groups in Africa do not work together to reach common goals. I’m honestly not sure what he is thinking here.
Yes I do. But to say that ‘Africans don’t work together’ is stupid because Africa is a huge continent. Which African ethnies? Etc. And that’s also an incorrect claim.
RR: Density-dependent pressures are things such as endemic disease in Africa—which is necessary for a K-selected history since density-dependent natural selection occurs at or close to the environmental carrying capacity
Samuel Skinner: Yes, if a disease is transmitted through person to person contact and non-discriminatory. Malaria is transmitted through mosquitoes; the amount adding additional people increases its rate is negligible.
“This therefore provides empirical confirmation that sex ratio has an immediate impact on transmission success and that it is density-dependent” (Mitri et al, 2009). Endemic disease (like malaria) work in a density-dependent fashion (Anderson, 1991: 51).
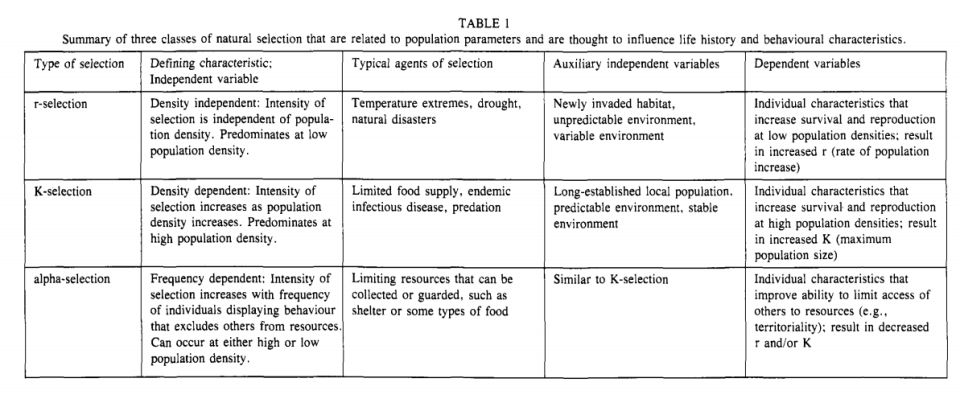
Here is what people like Samuel Skinner and AC don’t get: r/K selection theory WAS discarded; it is no longer in use. Age-specific mortality better explains these trends than r/K selection (Reznick et al, 2002: 1518). I’ve also covered how the so-called ‘unidimensional construct’ or r on one end and K at another is wrong: “It appears that the original HKSS items are best represented as four distinct but related dimensions, and do not represent a unidimensional construct. This conclusion is reinforced by relationships between HKSS total scores and life history measures: The significant correlations that were found were contrary to the predictions made by the Differential K literature (Figueredo et al., 2013; Rushton, 1985). We found that high K scores were related to earlier sexual debut and unrelated to either pubertal onset or number of sexual partners. This suggests that the HKSS does not reflect an underlying “K dimension” (Copping, Campbell and Muncer, 2014).
It truly is tiring rebutting the same old bullshit arguments on r/K theory. I see AC’s bullshit on Twitter when I search ‘r/K Selection Theory’, but the individual who pushes the bullshit will not accept my invitation to come to this blog and discuss it with me.
The most important thing to know here is that the unidimensional construct that Pianka (1970) formulated is wrong. Joseph Graves (2002) reviews some of the literature on the theory, showing that Pianka’s (1970) verbal theory is wrong, and that r/K selection fell out of favor in the late 70s. It’s worth noting that Pianka gave NO experimental rationale (Graves, 2002: 135) to his unidimensional construct (which Copping, Campbell and Muncer, 2014). Do you see how this theory holds no weight in evolutionary biology anymore?
Samuel Skinner also says: “So they changed the name and kept some of the components. If the components they dropped are ones AC is using, say so.”
Here is what Reznick et al (2002) write:
Although life-history theory has shifted away from a focus on r- and K-selection, the themes of density-dependent regulation, resource availability, and environmental fluctuations are integral to current demographic theory and are potentially important in any natural system
I see the term density-dependent regulation, which I do not see on AC’s blog (the only thing that comes up if you search that term on his blog are the responses to me… that should tell you something). In regards to resource availability Reznick et al (2002: 1517) write: We have also found a potential role of resource availability, either as a consequence of environmental factors that are correlated with, but otherwise independent of predators, or as a consequence of indirect effects of predation (Reznick et al. 2001)”. If I were you I’d read some of the literature on this before writing more bullshit.
Skinner also writes: “Again, not following. The link between fertility and disease is pretty clear- after a die off the population rebounds. If a population is near carrying capacity and suffers a die off, the growth rate of the survivors increases.” Except African populations have had much more time to reach their environmental carrying capacity and to experience the K-selected agents of natural selection, like endemic disease (Anderson, 1991: 59).
Then AC jumps in and writes: “You cannot take a Biology 101 class without learning about r/K. It is in the textbooks, and it is seen as an excellent theory, akin to Newtonian Physics. Sure relativity and Quantum Mechanics came along and showed that Newtonian physics wasn’t the entire ball of wax. But you still learn Newtonian Physics, because it is fundamental to understanding everything else.” This, again, is bullshit. AC, have you taken a Bio 101 class? I took one. Not one mention of this discredited theory, I have an in use biology textbook (Understanding Biology, 2nd edition, Mason et al, 2017; check pages 905-908 in the textbook to verify this) and in the section on reproductive strategies (which is what r/K selection theory is, at its core) r/K selection is not mentioned once. Why make claims that you know you cannot verify?
AC: “What we are doing here is not something where you can point to a single old study, and say, here it all is, in one place. Bringing all this together is new, even if what is being brought together is well established.“
That doesn’t mean it’s right.
AC: The issue is, you have one area of study of humans (political science) where it is long established that humans spontaneously diverge into two groups, which the literature has recognized are so divergent that they call them Left and Right, as in each points in the opposite direction.
So stop dodging me and answer this question: Are liberals and conservatives local populations? If so, where did they evolve?
AC: “Now I know you didn’t read the book because you are hung up on the use of the phrase “r/K Theory.” In the book there is a chapter devoted to that. I use the meme of r/K Theory for the same reason it is taught in biology – it is a quick way to bring people up to speed on the purposes of these traits, and how they affect reproduction/survival under different conditions.”
Don’t worry; I’ll read your book soon enough and will probably have tons of material to rebut. Anyway, using discredited bio theories isn’t a good way to push something.
AC: “If it is done right, this will ultimately be a massive field of study with thousands of biologists and political scientists taking it apart and trying to figure how aggressive stimuli affect people’s r/K traits, vs sexual stimuli, vs pleasureable things like food, vs quick blips of K followed by long periods of r, vs long constant K, vs disease mortality that is totally random, and on and on.”
You have some strange dreams. It won’t happen. Individuals WITHIN A SPECIES are not R OR K. R AND K ARE NOT ADJECTIVES (Anderson, 1991: 57).
AC: “On Rushton, unless he ever mentioned politics (he didn’t),“
That’s meaningless though. You’re using the continuum he grabbed from Pianka (1970). THEREFORE, you’re wrong with your application since Pianka (1970) was rebutted decades ago (Graves, 2002)!
AC: “You have married black conservatives and married white conservatives and married Asian conservatives. They all have more in common psychologically than the leftists of their fellow races. Mixing them along racial lines only muddies the waters, and hides that all races have been exposed to harshness and ease, and have adapted the requisite psychologies to function and persist under either.“
No it doesn’t ‘muddy the waters’. I believe now you’ll point to black Trump supporters going against BLM or white Leftists going against their interests. SO WHAT. You can create any just-so story you’d like, you won’t be right.
Something AC doesn’t get is that using the discredited r/K continuum, conservatives would be r (lower IQ, more children; women who reported being religious stated that having children was more important to them; Hayford and Morgan, 2008) in comparison to liberals who would be K (fewer children, higher IQs). Of course, he just immediately states that cons are K and libs are r, since the verbal theory from Pianka (1970) had the ‘good traits’ on K and ‘bad traits’ on r. (Read r/K theory: Conservatives = r, liberals = K (reminder to the ignorant)). I’ve already covered that libs are more intelligent than cons (Kanazawa, 2010; Kanazawa, 2014), and that conservative countries have lower IQs (and are non-white and third world) in comparison to liberal countries (which are majority white…). Conservatives are more likely to be religious (Morrison, Duncan, and Parton, 2015; McAdams et al, 2015), and religious people have lower IQs (Zuckerman, Silberman, and Hall, 2013; Ritchie, Gow, and Deary, 2014; Pennycook et al, 2016; Dutton and Linden, 2017). Intelligence is also associated with social and economic liberal views (Carl, 2014). Lastly, research into the psychology of continents shows that liberal continents are more intelligent than conservative continents (African countries conservative, European countries liberal… what’s that tell you?) (Stankov and Lee, 2016). So, using Rushton’s/Pianka’s continuum, who looks r and K now?
This, as usual, is the perfect example of implicit bias. My team is best and has the good traits, the other team is worse and has the bad traits. It’s dumb, it doesn’t make sense. AC will try to get ‘the truth’ about this theory out to people, well he has a foil in myself. I enjoy talking about this and debating it, but it seems like most people don’t understand the ecology behind the theory. They have their biases and will search for anything to confirm them. That’s not science.
Stop pushing r/K theory. It’s long dead. Just because some non-specialist idealogue pushes something and warps studies to fit his views while ignoring contrary evidence, DOES NOT mean that the theory is ‘back’ in style or anything to that effect. One biased person picked up the dead body of the (discredited) r/K continuum and attempted to revive it. Well I’ve shot it back down. It’s dead. Let it rest in peace and stop attempting to revive it.
Also see my other articles on r/K Selection Theory
r/K Selection Theory: A Response to Truth-Justice
r/K Selection Theory: A Response to Anonymous Conservative
E.O. Wilson on Rushton’s r/K Theory and More on Endemic Disease
r/K Selection Theory: A Response to Rushton
Also read: r/k selection political theory is rubbish
Pumpkinperson on the history of Black Africa
By Afrosapiens, 3650 words.

This article is a point by point refutation of Pumpkin Person’s extremely inaccurate and unscientific depiction of Black Africa’s history based on astrophysicist Michael Hart’s book Understanding Human History. While it might sound like a waste of time to give any attention to the writings of a clueless blogger, I found it was the perfect occasion to share the main specialist views on civilizational development and Sub-Saharan African history that many are still unaware of.
Although a couple of our commenters have been citing a lot of the accomplishments of black Africa, Dr. Michael H. Hart paints a very different picture in his book Understanding Human History.
To begin with, we have to question the value of Michael Hart’s account of human history when we know that this man is only an astrophysicist with no specialist background in history or archeology of any region of the world. Aside from Hart’s blatant incompetence in these areas of study, I can’t fail to mention his close links with the white nationalist movement and his well known association with American Renaissance. Knowing this, it is hard to believe that an incompetent writer with known ideological leanings would have produced an objective description of human history.
Hart’s book was published in 2007 so some of his claims may no longer be accepted as the archeological record has since become more complete and politically correct.
Pumpkin Person needs to elaborate on how the archaeological record could be “politically correct” or incorrect. Archeology is factual, not political. Either way, Michael Hart’s claims were wrong in 2007 and are just as wrong as of 2017 as his account of African history is in contradiction with the earliest reports by explorers of the continent.
For starters, Hart claims that farming was not practiced in Africa until it was brought to Egypt by Southwest Asians in 6000 BC and from there it spread to Ethiopia, Sudan and then West Africa by 3000 BC. Central and Southern Africa however, were still living in the paleolithic until 1000 BC, according to Hart.
This claim is obviously wrong and unsupported by genetic or botanical evidence. Pumpkin Person, doesn’t understand that societies do not invent “farming”, instead populations domesticate specific plants. The first plants were domesticated in West Africa around 5000BCE, these crops (sorghum, African rice, pearl millet, yam, fonio) are direct descendants of their local wild ancestors and were not grown in the Middle East and North Africa. This fact makes an introduction from those regions impossible, especially since transaharan communication was impossible before the domestication of the camel in the horn of Africa or southern Arabia around 3000 BCE. An other fact that Pumpkin Person seems to ignore is that populations do not transition from hunting and gathering to farming just from being exposed to agricultural populations, foreign crops are instead adopted by sedentary horticulturalist populations that have already domesticated non-grain plants. For this reason, the most common mode of diffusion of farming is not contact with another population but migration of the farmers themselves, which is why agriculture did not reach the southern half of Africa until the farming Bantu populations of West African origin gradually settled the region.
By 600 BC iron smelting occurred in Nigeria. Hart writes “It seems probable that knowledge of iron work had been introduced from the North or brought from the eastern Sudan.” Introduced or brought in by Caucasoids?
Once again, the external introduction hypothesis is unsupported by any sort of evidence, especially since West Africans started smelting copper in the Sahel by 2000 BCE, which was the first stage of metal working development before iron-metallurgy. Evidence from metal working and crop domestication confirm West Africa’s status as a place of independent transition from the paleolithic to the neolithic.
Hart notes that prior to 1500, sub-Saharan Africa could be divided into two wildly different sections. The exposed zone and the secluded zone. The exposed zone was all the parts that were in contact with Caucasoids, such as West Africa, Ethiopia, Somalia, small remote parts of the Indian Ocean colonized by Arab traders, and parts of the Atlantic coast where Portuguese traders had set up shop. The rest of sub-Saharan Africa was the secluded zone. A terrifying region roughly twice the size of Europe.
Being familiar with African historiography, I was very surprised to learn about this pretended division between a “secluded” and an “exposed” zone marking the history of the continent before 1500. Such a division never appears in the literature and searching for it on the Internet only led me to Pumpkin Person’s article, which implies that this distinction only exists in Pumpkin Person and Michael Hart’s heads. Also, it’d be interesting to find an actual map of the pretended “secluded zone” as well as a scientific translation of its “terrifying” character.
Nevertheless, it is true that African regions that were more exposed to the outside world benefited from the exchange of goods, knowledge and technology more than the more isolated parts of the continent, similarly to the rest of the world. However, places like the pre-islamic Sahel and savanna (Ghana Empire, Nok Civilization, Djenne-Djeno), the Gulf of Guinea (Benin, Yoruba states, Igbo states), the Great Lakes regions (Rwanda, Buganda), the Lower Congo (Kongo Kingdom, Kuba Kingdom) and Zimbabwe developed complex organized societies independently from Eurasian contact before 1500.
While the exposed zone was not poor, and benefitted from written languages brought by Muslim slave traders, Hart feels the indigenous peoples still failed to make a single contribution to World civilization.
Bold claims here. Firstly, it is well acknowledged that the University of Timbuktu founded under the rule of the Mali Empire was one of the Islamic world’s main learning centers staffed by local West African scholars with thousands of religion, science, poetry, history and novel manuscripts still remaining to this day. Secondly, “the Muslim slave traders” were not foreigners of North African or Middle Eastern ancestry as Pumpkin Person or Hart seem to imply, these Muslims were Black African Muslims (close to half Sub-Saharans are Muslim) and they were not “slave traders” per se. They indeed traded slaves, along with gold, ivory and gum and other African products.
But it is the vast secluded zone that bears the brunt of Hart’s poison pen. Described as a primitive and backward region until as recently as the 19th century, Hart notes that there were:
Interesting, but what is this “secluded zone” that he’s referring to? Can someone name some populations of this “secluded zone”?
-no wheeled vehicles, nor even the potter’s wheel
Which is common to every isolated region with low population density.
– no method of even joining together pieces of wood
It’s extremely hard to understand what he’s referring to. Given that most Africans all over the continent built wooden houses, or assembled different pieces of metal and wood to manufacture tools, weapons or musical instruments, this allegation doesn’t stand the test of reality.
-no beasts of burden or draft animals (though cattle was raised)
These characteristics are far from being exclusive to Africa even if we’re only mentioning the “secluded zone”, these animals were absent in the Americas too. Keeping large animals was made even more difficult in tropical Africa by the presence of tsetse flies killing animals and humans by transmitting African trypanosomiasis also known as sleeping sickness.
-not a single written language in the entire region, and thus no law codes, no philosophical works, no literature or even oral epic-poetry
Before expanding on the topic of writing, I must quickly react on this obviously wrong assertion that any place in Africa was devoid of oral literature. Besides the very rich record of such an oral literary tradition, African societies all over the continent are noticed by the existence of a social caste of storytellers best exemplified by the West African griots. As for writing, although it is true that most of Subsaharan Africa remained illiterate until colonization and the literate parts adapted or adopted foreign scripts (writing was only invented in Egypt, Sumer, China and Mesoamerica according to most specialists), evidence, mainly from the Cross River region of current day Nigeria, shows that Africans had developed proto-writing with the Nsibidi system used in courts and were thus only a few centuries away from developing a complete, fluid and ideographic writing system, tonal languages making alphabets hard to use.
-no coins or money
This remark makes no sense since all forms of exchange were barter or a slightly improved form of it before the introduction of real, modern fiat money. Anyway, differently shaped pieces of metal, shells and salt were common means of transaction all over Africa in precolonial times.
– no math beyond simple arithmetic,
Although the absence of written language greatly limits the development of mathematic science, it is obviously wrong to claim that Africans anywhere in the continent were unable of calculation above the level of simple arithmetic. Indeed, as this paper demonstrates in the case of central Africa, various memorization techniques were used to execute complex calculations prior to colonization.
-no cities beyond small towns
Anyone who knows that the difference between a city and a small town or a village is not the intelligence but the number of its inhabitants can only wonder what this is supposed to prove besides the fact that Africa’s population density was and is still very low, which is in line with the leading and unchallenged position among specialists that complex societies are the consequence of population density.
no temples, large monuments nor domes, arches, schools, hospitals, libraries nor paved roads.
Same thing as with cities, monumental architecture was not the product of superior intelligence, instead, it relied on huge pools of laborers to erect such structures whose construction commonly spanned over several decades or centuries.
Hart credits the ruins of Great Zimbabwe as the most notable construction in the secluded zone, but feels it was nothing compared to the Machu Picchu in South America, or Cambodia’s Angkor Wat complex, or Mesoamerica’s large cities and religious buildings. Hart notes that the giant statues on the tiny isolated Polynesian Easter Island were more impressive than anything found in the entire, secluded zone of black Africa.
This passage contains many inaccuracies. Firstly, Angkor Wat was by no means an isolated place. It was a Hindu, then Buddhist temple, and both religions went to Cambodia from India. As an assemblage of multiple stones to form a fortification system, Great Zimbabwe certainly necessitated more complex skills than carving statues in volcanic monoliths as seen in Easter Island. Machu Picchu, which is not a monument but an abandoned town is actually very similar to Great Zimbabwe, both are settlements built with locally available materials with a relatively simple architecture. Regarding Mesoamerican pyramids, they are absolutely not comparable to either Machu Picchu, Great Zimbabwe or Easter Island monoliths as they were built in a highly populated literate region with advanced mathematics and geometry which greatly facilitate architectural development.
-Almost no maritime skills. Hart notes the stunning fact that took Indonesians from the other side of the Indian Ocean, coming from 3000 miles away, to inhabit Madagascar in 500 AD, because Africans still had not reached it, even though it was only 250 miles off the East African coast. Nor did they reach the Cape Verde Islands, just a few hundred miles off the West African coast.
Africans are continental peoples, contrary to Indonesians who had spent millennia on archipelagos where seafaring across calm waters was the only means of communication between tiny islands. The African coast is straight and boarded by tumultuous oceanic waters, without peninsulas nor islands visible from the coast. For the same reason, Europeans never reached Madeira, the Azores or the Americas (apart from the Vikings, reaching Greenland and Newfoundland from Iceland at an unknown period) before the age of discoveries, Native Americans never reached Bermuda or the Galapagos and East Asians didn’t reach the Americas or any island in the Pacific. Continentality does not promote the development of seafaring skills whereas oceanic waters, with no island in sight from the coast give the impression of a boundary of the world. Nevertheless, Bantu peoples reached the Comoros in the sixth century soon after reaching the Eastern coast from their West African homeland, from there, they settled Madagascar at about the same time as Austronesians.
Hart also claims the secluded zone was primitive when it came to political and ethical matters, noting the lack of democracy and civil liberties and the common use of slavery and occasional cannibalism.
I wonder if this part has to be taken seriously. In fact, those things were common features in Africa, in and out of the “secluded” zone. But they were also common all over the world until someone invented and then enforced the idea of human rights. Duh!
Why was the secluded zone of black Africa so far behind virtually everyone else on Earth? In Guns, Germs and Steel, Jared Diamond argues that black Africa was simply cut off from the rest of the World, and thus didn’t have access to advances in knowledge, however Hart rejects this explanation because Native Americans were even more geographically isolated than black Africans, yet their societies were so much more advanced.
Wrong, Mesoamerica has impressive pyramids, the Andes have ancient ruined cities but those things definitely aren’t a common sight from Alaska to Patagonia. In fact, the area of the Americas where complex societies never existed is much larger than the whole Subsaharan part of Africa and is also much more “backward” since most populations did not acquire metallurgy and barely practiced agriculture, which makes them paleolithic societies.
Instead Hart favours the cold winters explanation. Races who left Africa tens of thousands of years ago, and got at least some exposure to the ice age, evolved higher intelligence to survive the cold, and once the ice age ended, this allowed them to create advanced culture and technologies.
This explanation is not supported by any genetic, archaeological, anthropological evidence. No Wurm-glaciation-related bottleneck has ever been reported by any geneticist, nor did any other related adaption on another trait. The only noticeable anthropometric change that came after the Wurm Glaciation is shrinking brain and body sizes. Also, the cradles of the neolithic revolution (all in low subtropical latitudes) were actually mildly affected by the last glacial maximum whereas such a scenario would have led one to expect agriculture or metallurgy to appear in more northerly regions.
Secondly, there is already a leading theory on the emergence and development of civilization that isn’t challenged and fits observable patterns. This theory does not focus on “qualitative” factors of human populations such as intelligence but simply on quantitative factors such as population density and exposure to long distance trade.

And it is no coincidence that complex societies emerged and developed in environments that were able to sustain high population densities thanks to their climate and vegetation, the quality of their soil, some characteristics of their terrain that prevented population dispersal and facilitated crowding, low disease burden and access to world trade. For these reasons, the different regions of the world experienced different trajectories of social development.
Australia and Oceania

Mostly lying in the tropical zone and greatly isolated from the Eurasian landmass, indigenous Australian and Oceanian societies developed in hostile environments and tiny islands preventing demographic expansion. Whereas Polynesia was settled by Austronesian populations that developed seafaring skills in the Indonesian Archipelago, Australia and Melanesia had no contact with the outer world until European exploration. No agriculture was ever developed in Australia, however Papua New Guinea is one place of independent domestication of crops, which along with continental Asian cultivates spread to Micronesia, Polynesia and Melanesia.
Central And Northern Asia

As a flat, arid and cold continental mass, Central and Northern Asia’s environments do not favor population density and complex social organization. Nomadism was traditionally a prevalent mode of subsistence in the region and and only a few complex permanent settlements emerged along the southern silk roads that were crucial to trans-Eurasian trade. Although the region has virtually no indigenous advancements, the Turkic and Mongolic warlike nomadic tribes have been able to take over the well established empires of Europe, East Asia, India, Persia and the Near-East.
East Asia

Benefiting from some of the most fertile soils of the world, a temperate climate enabling long growing seasons and lowering the prevalence of disease, as well as a terrain made of enclosed plains and valleys in Northern China and narrow peninsulas and islands in Japan and Korea. East Asia’s environment has allowed the development of very complex societies that still boast some of the highest population densities in the world. Expanding southwards to the subtropical area, the Han Chinese found the ideal conditions for year long high yield riziculture allowed by abundant rainfall and fertile soils. East Asia is noticeable within the Eurasian landmass for the indigenous development of its agriculture and writing and its historical resistance to foreign influences, which likely resulted in a delayed social development relative to the potential conferred by its excellent environmental conditions.
Europe

Receiving neolithic technologies from the near east, complex societies first developed in the southern peninsulas of Greece and Italy where the terrain and the Mediterranean climate quickly allowed high population densities. By the end of the first millennium AD, Mediterranean technologies were established in the northern areas and the large scale movement of deforestation cleared vast agricultural areas with fertile soils under an excellent temperate low-disease climate that led to a population boom that quickly allowed Europe to rise to global prominence.
Middle East and North Africa

Often called the cradle of civilization, the Middle East and North Africa reunite the optimal conditions for the emergence of complex societies. A warm, temperate climate with balanced rainfall combined with fertile valleys (Nile and Mesopotamia) allowing year-long irrigation, all enclosed by inhospitable deserts preventing population dispersal. Moreover, the region finds itself at the crossroads of the Old World and has dispersed then received technologies and commodities from neighboring eras.
North America and the Arctic

Similarly to South America and contrary to Subsaharan Africa as depicted by Pumpkin Person and Michael Hart, North America shows a stark contrast between highly developed Mesoamerica and the mostly paleolithic other regions and is a perfect illustration of the fundamental role of population density in the emergence of civilization. Whereas the narrow temperate highlands and warm lowlands of the Mesoamerican isthmus enabled highly productive yearlong agriculture and prevented population dispersal thus leading to very high population density and civilization in isolation from the Old World, the northern areas remained underpopulated due to a vast, flat continental landmass.
Nevertheless, the eastern temperate areas of Canada and the United States, benefiting from a balanced climate and fertile soils sustained some small scale agriculture but it is only after European settlement that these ideal conditions were fully exploited. Another specificity of the Americas compared to the Old World is the absence of disease due to lack of domestication of large animals. Whereas this could have been beneficial for demographic growth in precolumbian times, it proved to be fatal quickly after contact with the old-world as the indigenous populations had evolved no genetic immunity to resist Old World disease or to spread New World disease to the invaders.
South America

Comparably to North America, the development of complex societies is restricted to the very narrow Andine Altiplano, a temperate highland plateau where indigenous populations subsisted on the cultivation of potatoes. A colder climate and a shorter growing season prevented Andine societies to achieve population densities that equaled that of Mesoamerica and for this reason, they couldn’t develop complex technologies to the same level. The rest of the South American landmass has similar environmental characteristics to Subsaharan Africa which is a very warm area of flat arid grasslands and equatorial rainforests. The soils are poor for grain crops and the population densities are accordingly low.
South-East Asia

Entirely lying in the tropical zone, South-East Asia includes the Indochinese peninsula and the Indonesian Archipelago. Whereas some volcanic islands like Java as well as more temperate regions in Cambodia, Thailand and Vietnam were able to sustain high population densities, most of the local technology and cultural elements were acquired from the Indian Subcontinent and, to a lesser extant, East Asia. The constellation of islands in Indonesia led to the formation of thalassocracies whose maritime tradition allowed the settlement of Austronesian peoples in remote islands like Hawaii, Madagascar and Easter, but curiously not Australia.
Southern Asia

Southern Asia was for a long time the second most advanced region in the world after the Middle East and North Africa and similarly adopted and spread technologies and cultural practices from and to the neighboring regions. Centered around the Indus and the Ganges valleys as well as the Deccan plateau, Southern Asia has fertile soils, warm and moderately humid climates in that alternate with more arid climates where a large variety of crops can be grown all year thanks to powerful rivers that allow irrigation. Seasonal monsoon provide ideal rainfall for rice cultivation. Along with Eastern China, Northern India currently has some of the most densely populated areas of the world.
Subsaharan Africa

Subsaharan Africa is a vast, flat landmass under very warm climates which result in environments made of deserts, arid grasslands and equatorial rainforests. Short growing seasons, high disease burden and population dispersal (slave trade included) have made it particularly difficult to achieve sufficient population densities that lead to more complex societies compared to the rest of the world from which the region remained partially isolated. Nevertheless, centralized states were established in the Sahel and the northern Savannas of West Africa, in the Gulf of Guinea, the Lower Congo, the Ethiopian Highlands, the Great Lakes region, the Swahili Coast and Southern Africa. Contrary to the imaginary “secluded zone” theory proposed by Pumpkin Person and Michael Hart, social complexity is in Africa as elsewhere in the world more a function of population density than a function of exposure to “more evolved races”.
For further information on “secluded zones”, you will enjoy this documentary
Why Do Jamaicans, Kenyans, and Ethiopians Dominate Running Competitions?
2050 words
Much has been written about the genotypic and phenotypic differences in Jamaicans, Kenyans, and Ethiopians. Why do they dominate these competitions? Is it cultural? Genetic? Does training matter more? Grit? Expertise? There are multiple reasons that they have such an advantage, the most important one being their morphology/somatype. Of course other physiologic and morphologic factors come into play for these three populations, but the greatest physical advantage they have is their somatype which lends itself to running—whether short, medium or long distance.
Back in July, I argued that the wide-hipped Neanderthals were stronger than the recently migrated Homo sapiens, due mostly to pelvic anatomy (along with Neanderthal protein intake). That’s one of the keys to explaining African dominance in running: their long slender bodies with high limb ratios.
Kenyans and Ethiopians
Kenyan distance running is driven by an ethny named the Kalenjin, particularly of the Nandi tribe. Much research has been undertaken on the physiology and morphology of certain subpopulations of Kenyans, with a complex genotype, phenotype, and even SES interaction driving the dominance of this subpopulation (Tucker, Onywera, and Santos-Concejero, 2015). Another important factor is their low BMI. Kenyans have the lowest BMIs in the world at 21.5, which considerably helps in regards to distance running (Radovanovic et al, 2014; Shete, Bute, and Deshmukh, 2014; Sedeaud et al, 2015).
Kenyans—like Jamaicans and Ethiopians—dominate these competitions due to a complex interaction between genes, environment and SES (Tucker, Onywera, and Santos-Concejero, 2015). Though, of course, a lot of what makes certain Kenyan populations dominate is trainable in other populations. Caucasians can have similar trainability in regards to Vo2 max, oxidative enzymes, and running economy. However, Kenyans are more likely to be slender with longer limbs which is a huge advantage in these competitions. So having a good running economy and a high Vo2 max may be the primary causal factors that cause them to be so good at distance running, with, as I’ve noted in the past, a higher genetic ceiling for high Vo2 max, along with high-altitude training (Larsen, 2003). Though Saltin et al (1995) conclude that physical activity during childhood combined with intense training as a teenager explains the higher Vo2 max in Kenyan boys. Other factors such as low blood lactate and ammonia accumulation are also important.
Genetics, though, is the most likely explanation for African distance-running dominance (Vancini et al, 2014; see Scott and Pitsiladis, 2007 for alternative view that as of yet there are no genetic evidence for African running superiority).
Not all studies show that Kenyans have more slow-twitch (type I) fibers than Caucasians, though the oxygen cost of running at a given velocity was found to be lower in elite Kenyan runners compared to non-Kenyans, which may be due to body dimensions. Apparently, there is no indication that Kenyans possess a pulmonary system that confers a physiologic advantage over non-Kenyans (Larsen and Sheel, 2015). Ethiopian diets, however, met the most recommendations for macronutrients, but fluids were lacking (Beis et al, 2011), similar to what is found on similar studies in Kenyans (Onywera et al, 2003).
It is important to note that not all of the literature out there says that there are mainly physiologic/genetic reasons for their success in distance running; other factors that may be at play are somatype which leads to exceptional biomechanical and metabolic efficiency, high-altitude training, and the want to succeed for economic and social advancement (Wilbur and Pitsiladis, 2012). Oxygen transport of the blood doesn’t explain Kenyan dominance either, they have similar oxygen transport as elite German runners (Prommer et al, 2010). Though, women and men from Ethiopia and Kenya, although they only account for <0.1% of the marathons and half-marathons, achieved the fastest times and were the youngest in the half-marathons and full-marathons (Knechtle et al, 2016). Similar results were seen in Switzerland, with male Africans being faster and younger than non-Africans (Aschmann et al, 2013).
From the years 2000-2014, Knechtle et al (2017) analyzed the Boston, Berlin, New York, and Chicago marathon along with the Stockholm marathon. Over this time period, Ethiopian men improved their times, but Ethiopian women didn’t. Age increased in Ethiopian men, but not women. Female and male marathon runners from Ethiopia were the fastest (Knechtle et al 2017). More studies, though, are needed to unravel the complex relationship between environmental and genetic factors that cause East Africans to dominate distance running (Onywera, 2009). However, elite endurance athletes consistently test higher than non-elite athletes on running economy, Vo2 max, and anaerobic threshold (Lorenz et al, 2013), and mechanical work may be able to predict recreational long distance performance (Tartaruga et al, 2013).
Jamaicans
Jamaican sprinting dominance has been chalked up to numerous factors, most recently, symmetry of the knees and ankles (Trivers, Palestis, and Manning, 2013; Trivers et al, 2014). Trivers et al (2014) write in the Discussion:
Jamaicans are the elite sprinters of the world. Why? If symmetry of knees and ankles is a factor, why should Jamaicans be especially symmetrical (there is no knowledge of whether they actually are)? One possibility is heterozygosity for genes important to sprinting. The slave trade greatly increased heterozygosity on the West African side by mixing genes up and down the West coast of Africa from Senegal to Nigeria [15], [16]. Recently a mtDNA haplotype has been isolated that correlates with success in African American–but not Jamaican–sprinters [17]. Since there is a general (if often weak) positive relationship between heterozygosity and body symmetry [18] we are eager to do targeted studies of genomics on areas associated with sprinting, including energy substrate utilization, muscle fibre-type distribution and body composition analyses (with specific reference to the shape and size of the glutei maximi). Fast twitch (anaerobic) muscle fibres are characterized by specific adaptations which benefit the performances of explosive high-intensity actions such as those involved in sprinting. Notably, West Africans appear to have a higher fast twitch muscle fibre content than do comparable Europeans (67.5% vs 59% in one sample [19], as cited in [20]).
It’s interesting to note that the mtDNA haplotype predicts success in African American sprinters, but not Jamaicans. In regards to mtDNA haplotypes, Jamaican sprinters had statistically similar mtDNA haplotypes, which suggests that the elite sprinters arose from the same source population which indicates that there is no population stratification or isolation on sprint performance. African American sprinters and non-sprinters, on the other hand, had statistically significant differences in mtDNA, which implies that maternal ancestry plays a part in sprinting performance (Deason et al, 2011). Studying both maternal and paternal haplotypes to see where source populations originate is important in these fields, since if we know where their population came from, then we can better understand the hows and whys of elite running performance—especially between race. Though demographic studies on Jamaicans show that elite sprinters come from the same demographic population, so genetics cannot possibly account for Jamaican sprinting success, so their sprinting success may be related to environmental and social factors (Irving et al, 2013). We know little about the genomics of elite sporting performance (Pitsiladis et al, 2013), so the physical correlates (somatype) and physiologic correlates will do for now.
Usain Bolt is the current fastest man in the world, due in part to his anthropometric advantage (Krzystof and Mero, 2013). As everyone knows, you cannot teach speed (Lombardo and Deaner, 2014). Bolt himself has a large advantage, in part, to his power development and biomechanical efficiency compared to the people he competes with (Beneke and Taylor, 2010). Though one study has noted that a human may be able to run faster quadrupedally than bipedally–stating that at the 2048 Olympic Games, that the fastest human on the planet may well be a quadrupedal runner (Kinugasa and Usami, 2016). One of the most important factors of acceleration in the 100m sprint is stride frequency (Mackala, Fostiak, and Kowalski, 2015).
In Afro-Caribbean adolescents, body height and stride number to body height ratio were the main determinants of sprint performance (Copaver, Hertogh, and Hue, 2012). Body height being a predictor of sprint performance is nothing new; taller people have longer limbs; longer limbs cover more distance per step. Indeed, sprinters are taller than the American population, there is more variability in men than in women, sprinters have lower body mass and the height range excludes people who are really tall or really short (Uth, 2005).
Fiber typing
I will touch on fiber typing again since I’ve come across new information on it.
East Asians are less likely to have the RR allele of the ‘sprint gene’ (MacArthur and North, 2004) (ACTN3) while Bantus are more likely to have it. Alpha-actinen-3 is a skeletal muscle isoform which is encoded by the ACTN3 gene. Alpha-actinen-3 deficiency is common in the general population (North, 2008; Berman and North, 2010), which means that most people in the general population are XX. Eighteen percent of the population on earth is homozygous for this mutation (Ivarsson and Westerblad, 2015). This allele is the 577X allele, and Bantus are less likely to have it while Eurasians are more likely to have it. The frequency of the RR genotype is also highest in Bantus than in Asians (Mills et al, 2001). This is one very important reason why Eurasians are not faster than Africans (somatype matters too, of course).
Elite sprinters are more likely to be RR and less likely to be XX. Why does this matter? It matters because the RR genotype with the right morphology, fiber type (fast twitch) and contractile properties of the individual fast twitch fibers contribute to heightened performance with an RR genotype (Broos et al, 2016). Jamaicans are also less likely to have the XX genotype (~2 percent) along with Kenyans (Scott et al, 2010). So this shows that since Jamaicans are less likely to be XX, they’re more likely to be RR. So since XX i negatively associated with sprint status, then populations that have a lower frequency will be more likely to have more sprinters, whereas a population that has the genotype will have fewer sprinters.
This is one of many genetic factors that account for elite sprinting performance between populations. So, clearly, the right muscle fiber type combined with the right genotype from the ACTN3 gene infers an advantage, contrary to Daniel MacArthur’s claims that it does not (one of the authors of numerous studies on the ACTN3 gene).
Conclusion
The genetics of sprinting/distance running is currently poorly understood. Though we have a few candidates (and they’re really good, showing variation where they should) like the RR ACTN3 genotype combined with fast twitch fibers. This is very important to note. If you’re missing this, and you’re short with a low Vo2 max and low limb length, there’s an extremely high chance you will not be an elite sprinter/distance runner. I cannot emphasize enough how much the physical factors mean when it comes to this.
It is possible that SES variables combined with other psycho-social factors could explain why these three populations excel so well in these sports. Though, on the other hand, you cannot discount that the individual has to have the right somatype and physical capabilities first. Contrary to popular belief, fiber typing DOES give an advantage, especially if combined with other variables. Low BMI is very important, as are long limbs and a taller than average height.
When it comes to Jamaicans, symmetry of the knees and ankles help considerably, along with a low body mass and taller body. SES factors could be driving the will to compete in these three populations, however, the physical ability needs to be there first, then it needs to be nurtured. Over the next 5 to 10 years, we will have a better understanding of why some populations excel over others and that will largely be due to somatype, physiology, and genetic factors, with SES and other psycho-social factors driving the want to excel in the sport.
The physical differences that underlie the success of these three populations needs more study. Elite athletes of Jamaican, Kenyan, and Ethiopian descent need to be studied more to untangle the physiologic, psychological, physical and social factors that have them excel so well. We know that certain combinations of traits infer a great advantage in certain populations, we now just need enough elite athletes of these populations to study to see how and why they excel so much. The current body of research reviewed here is a good start, though it does leave some questions unanswered.
Weight Loss and the Microbiome
1450 words
Last month I argued that there was more to weight loss than CI/CO. One of the culprits is a virus called Ad-36. Obese people are more likely to have Ad-36 antibodies in comparison to lean people, which implies that they have/had the virus and could be a part of the underlying cause of obesity. However, a paper was recently published that your stool can predict whether or not you can lose weight. This is due to how certain bacteria in the gut respond to different macronutrients ingested into the body.
ScienceDaily published an article a few days ago titled Your stools reveal whether you can lose weight. In the article, they describe the diets of the cohort, which followed 31 people, some followed the New Nordic Diet (NND), while others followed the Average Danish Diet (ADD) (Hjorth et al, 2017; I can’t find this study!! I’ll definitely edit this article after I read the full paper when it is available). So 31 people ate the NDD for 26 weeks, and lost 3.5 kg (7.72 pounds for those of us who use freedom numbers) while those who ate the ADD lost an average of 1.7 kg (3.75 pounds for those of us who use freedom numbers). So there was a 1.8 kg difference in pounds lost between the two diets. Why?
Here’s the thing: when people were divided by their microbiota, those who had a higher proportion of Prevotella to Bacteriodoites lost 3.5 more kg (7.72 pounds) in 26 weeks when they ate the NND in comparison to the ADD. Those who had a lower proportion of Prevotella to Bacteriodoites lost no additional weight on the NND. Overall, they say, about 50 percent of the population would benefit from the NND, while the rest of the population should diet and exercise until new measures are found.
The New Danish Diet is composed of grains, fruits, and vegetables. The diet worked for one-half of the population, but not for the other. The researchers state that people should try other diets and to exercise for weight loss while they study other measures. This is important to note: the same diet did not induce weight loss in a population; the culprit here is the individual microbiome.
Now that those Bacteroidotes have come up again, this quote from Allana Collen’s 2014 book 10% Human: How Your Body’s Microbes Hold the Key to Health and Happiness:
But before we get too excited about the potential for a cure for obesity, we need to know how it all works. What are these microbes doing that make us fat? Just as before, the microbiotas in Turnbaugh’s obese mice contained more Firmicutes and fewer Bacteroidetes, and they somehow seemed to enable the mice to extract more energy from their food. This detail undermines one of the core tenets of the obesity equation. Counting ‘calories-in’ is not as simple as keeping track of what a person eats. More accurately, it is the energy content of what a person absorbs. Turnbaugh calculated that the mice with the obese microbiota were collecting 2 per cent more calories from their food. For every 100 calories the lean mice extracted, the obese mice squeezed out 102.
Not much, perhaps, but over the course of a year or more, it adds up. Let’s take a woman of average height. 5 foot 4 inches, who weights 62 kg (9st 11 lb) and a healthy Body Mass Index (BMI: weight (kg) /(height (m)^2) of 23.5. She consumes 2000 calories per day, but with an ‘obese’ microbiota, her extra 2 per cent calorie extraction adds 40 more calories each day. Without expending extra energy, those further 40 calories per day should translate, in theory at least, to a 1.9 kg weight gain over a year. In ten years, that’s 19 kg, taking her weight to 81 kg (12 st 11 lb) and her BMI to an obese 30.7. All because of just 2 percent extra calories extracted from her food by her gut bacteria.
This corresponds with the NND/ADD study on weight loss… This proves that there is more than the simplistic CI/CO to weight loss, and that an individual’s microbiome/physiology definitely does matter in regards to weight loss. Clearly, to understand the population-wide problem of obesity we must understand the intricate relationship between the microbiome/brain/gut/body relationship and how it interacts with what we eat. Because evidence is mounting that the individual’s microbiome houses the key to weight loss/gain.
Exercise does not induce weight loss. A brand new RCT (randomized controlled trial) showed that in a cohort of children who were made to do HIIT (high-intensity interval training) did show better cardiorespiratory fitness, but there were no concomitant reductions in adiposity and bio blood markers (Dias et al, 2017). What this tells me is that people should exercise for health and that ‘high’ that comes along with it; if people exercise for weight loss they will be highly disappointed. Note, I am NOT saying to not exericse, I’m only saying to not have any unrealistic expectations that cardio will induce it, it won’t!
Bjornara et al (2016) showed that, when the NND was compared to the ADD, there was better adherence to the NND when compared to the ADD. Poulskin et al (2015) showed that the NND provided higher satisfaction, and body weight reduction with higher compliance with the NND and with physical activity (I disagree there, see above).
This study is important for our understanding of weight loss for the population as a whole. More recent evidence has shown that our microbiome and body clock work together to ‘pack on the pounds‘. This recent study found that the microbiome “regulate[s] lipid (fat) uptake and storage by hacking into and changing the function of the circadian clocks in the cells that line the gut.” The individual microbiome could induce weight gain, especially when they consume a Western diet, which of course is full of fat and sugar. One of the most important things they noticed is that mice without a microbiome fared much better on a high-fat diet.
The microbiome ‘talks’ to the gut lining. Germ-free mice were genetically unable to make NFIL3 in the cell lining of the gut. So germ-free mice lack a microbiome and lower than average production of NFIL3, meaning they take up and store fewer lipids than those with a microbiome.
So the main point about this study is the circadian rhythm. The body’s circadian clock recognizes the day/night system, which of course are linked to feeding times, which turn the body’s metabolism on and off. Cells are not directly exposed to light, but they capture light cues from visual and nervous systems, which then regulates gene expression. The gut’s circadian clock then regulates the expression of NFIL3 and the lipid metabolic machinery which is controlled NFIL3. So this study shows how the microbiome interacts with and impacts metabolism. This could also, as the authors state, explain how and why people who work nights and have shift-work disorder and the concurrent metabolic syndromes that come along with it.
In regards to the microbiome and weight loss, it is poorly understood at the moment (Conlon and Bird, 2015), though a recent systematic review showed that restrictive diets and bariatric surgery “reduce microbial abundance and promote changes in microbial composition that could have long-term detrimental effects on the colon.” They further state that “prebiotics might restore a healthy microbiome and reduce body fat“(Segenfrado et al, 2017). Wolf and Lorenz (2012) show that using “good” probiotic bacteria may induce changes in the obese phenotype. Bik (2015) states that learning more about the microbiome, dysbiosis (Carding et al, 2015), and how the microbiome interacts with our metabolism, brain, and physiology, then we can better treat those with obesity due to the dysbiosis of the microbiome. Clark et al (2012) show how the mechanisms behind the microbiota and obesity.
Weight loss is, clearly, more than CI/CO, and once we understand other mechanisms of weight loss/gain/regulation then we can better treat people with these metabolic syndromes that weirdly are all linked to each other. Diets affect the diversity of the microbiome, the diversity of the microbiome already there though, may need other macro/micro splits in order to show differing weight loss, in the case of the NND and ADD study reviewed above. Changes in weight do change the diversity of the microbiome of an individual, however, the heritable component of the microbiome may mean that some people need to eat different foods compared to others who have a different microbiome. Over time, new studies will show how and why the macro/micronutrient content matters for weight loss/gain.
Clearly, reducing the complex physiological process of weight gain/loss to numbers and ignoring the physiological process and how the microbiome induces weight gain/loss and works together with our other body’s cells. As the science grows here we will have a much greater understanding of our body’s weight loss mechanisms. Once we do that, then we can better help people with this disease.
Does Human Potential Lie in the Embryo?
900 words
The debate on human potential—and whether or not it is innate and ‘in the genes’—is steeped in bias and ideology from both sides (despite the claims that HBD ‘has no ideological bias’). Hereditarians assume that human potential is ‘in the genes’, and some even believe that human potential is testable during embryonic development (like psychologist Stuart Ritchie). However, this assumes two things: 1) that genes are the masters of development, and not the slaves, and 2) that differences in potential are already encoded in the genes of the homunculus. I will show that these two assumptions are wrong.
Embryonic development is a part of a larger whole of a complex process. Cells, in the beginning of embryonic development, are totipotent—meaning they have the ability to become any type of cell (Condic, 2014) depending on what the intelligent system calls for. This is important to note: at the beginning, all cells are the same and, despite having the same genes, “they have the same potential to become any kind of differentiated cell for a particular organism” (Richardson, 2017: 156). It is also possible to grow stem cells in a lab that are pluripotent—which have the ability to become any cell in the body—called iPS cells.
Even embryos that are of low quality do end up developing into healthy babes (emphasis in second para mine):
Embryo quality as we see it under the microscope in the IVF lab gives us some reasonable ability to predict the chances for pregnancy after the embryo transfer procedure. However, because there are many other contributing factors involved that we can not see or measure, the generalizations about “quality” made from grading embryos are often inaccurate.
We see some cycles fail after transferring 3 perfect looking embryos, and we also see beautiful babies born after transferring only one “low grade” embryo. The true genetic potential of the embryo to continue normal development is very difficult to measure accurately unless we utilize preimplantation genetic screening (PGS) to select chromosomally normal embryos for transfer.
So it seems that not even just looking at the quality of the embryo will show you if it will grow into a healthy baby with no birth complications. Potential must come after the embryonic stage of development. Another thing about testing the ‘quality’ of the embryo: it tells nothing about “what is going on inside the embryo genetically“.
The thing is, most chromosomal and other defects in any embryos can be noted under a microscope within 3 days of the embryo forming. And if you paid attention to totipotent cells earlier, you’d know that those cells have the potential to become any cell in the body—which is driven by the body’s intelligent systems/cells.
So embryonic quality really has no bearing on whether or not the embryo will eventually reach birth. As I’ve argued before in Human Mating and Aggression—An Evolutionary Perspective, the age of the mother is one of the strongest predictors of whether or not there will be deleterious effects on the child—mostly after 35 years of age (O’Reilly-Green and Cohen, 1993; van Katwijk and Peeters, 1998; Stein and Susser, 2010; Lampinen, Vehviläinen-Julkunen, and Kankkunen, 2009, Jolly, 2010; Yaniv et al, 2010; Liu et al, 2011). However, there is evidence that a woman can be too young to become a mother (Geronimus, Korenman, and Hillemeier, 1994; Fall et al, 2015) and that children born to young mothers “might be better off if the parents waited a few years” (Myrskyla and Fenelon, 2012). The same holds true for fathers, with it recently being observed that older fathers and their offspring have lower evolutionary fitness even over across four centuries (Arslan et al, 2017). So it seems that the best predictor of embryonic quality is parental age (Scheffer et al, 2017)—not what an embryo really looks like or the totipotent cells already in the embryo.
So there is no test for the genetic potential of embryos and sperm—with the best tell being parental age. Embryonic development is a part of the intelligent developmental system and each stage of embryonic development is brand new, rather than being the cause of an already laid out blueprint. So even though the embryo has all of the same genes (in totipotent cells), they have the potential to become any cell in the body which is directed by the intelligent system (as noted above).
So if you understand embryonic development and how it’s a part of the intelligent system itself and not a part of an already laid out blueprint, then you’ll understand how potential—as we know it— is not in the embryo. They all have the same kinds of totipotent cells which have the chance to become any cell in the body which are then activated and used by the intelligent physiology. The age of both parents are the best predictors of embryonic quality—just by looking at the embryos after they’ve developed from blastocytes, you cannot infer that embryo’s potential.
Ken Richardson also responded to Stuart Ritchie’s article It’s now possible, in theory, to predict life success from a genetic test at birth to which Ken Richardson responded to. Potential is not in the embryo due to the number of totipotent cells in the embryo. Even ‘low-quality’ embryos can become healthy babes, so ’embryonic quality’ is not a good measure of whether or not it will be born with a defect, etc.
Worldwide IQ estimates based on education data
By Afrosapiens, 2851 words
One of the leading theories to explain differences in cognitive test performance between time and place is that intelligence as measured by such tests is affected by exposure to formal schooling and the cognitive demands of a high-technology society (D. Marks, JR. Flynn). One of the strongest evidence for such an effect of schooling on IQ comes from a reform in the Norwegian school system in which an expansion of compulsory schooling was associated with a 3.7 points increase in IQ per additional year of education between pre-reform and post-reform cohorts. In order to test this relationship between years of schooling and commonly reported national IQ averages, I used data from the United Nation’s Development Program to estimate the average IQ of each country’s adult and school-age population. Adult IQs were estimated from mean years of schooling completed by adults aged 25 and older whereas School-population IQs were estimated based on the expected years of schooling that a student is supposed to complete if the enrollment ratios from primary through tertiary education remain constant. All variables were reported in year 2015. Great Britain was chosen as the reference country and assigned a default value of 100 on both variables. For each country, a difference of one year in completed or expected schooling added or removed 3.7 IQ points. Adult IQ and School-age population IQ were averaged to estimate the most probable mean IQ that would be found by randomly reviewing literature without controlling for the age or the health and socio-economic profile of the sampled individuals.
Results
| Country | Main ancestry | School age-Adult IQ average | School age IQ | Adult IQ |
| Australia | West-European | 107 | 115 | 100 |
| Denmark | West-European | 104 | 111 | 98 |
| New Zealand | West-European | 104 | 111 | 97 |
| Iceland | West-European | 103 | 110 | 96 |
| Ireland | West-European | 102 | 109 | 96 |
| Norway | West-European | 101 | 105 | 98 |
| Germany | West-European | 101 | 103 | 100 |
| Netherlands | West-European | 101 | 107 | 95 |
| United States | West-European | 100 | 101 | 100 |
| United Kingdom | West-European | 100 | 100 | 100 |
| Switzerland | West-European | 100 | 99 | 100 |
| Canada | West-European | 100 | 100 | 99 |
| Slovenia | East-European | 100 | 104 | 96 |
| Lithuania | East-European | 99 | 101 | 98 |
| Czech Republic | East-European | 99 | 102 | 96 |
| Estonia | East-European | 99 | 101 | 97 |
| South Korea | North-East Asian | 99 | 101 | 96 |
| Israel | West and Central Asian, North African | 99 | 99 | 98 |
| Sweden | West-European | 98 | 99 | 96 |
| Poland | East-European | 98 | 100 | 95 |
| Finland | East-European | 97 | 103 | 92 |
| France | West-European | 97 | 100 | 94 |
| Japan | North-East Asian | 97 | 96 | 97 |
| Latvia | East-European | 96 | 99 | 94 |
| Belarus | East-European | 96 | 98 | 95 |
| Greece | East-European | 96 | 103 | 90 |
| Hungary | East-European | 96 | 97 | 95 |
| Spain | West-European | 96 | 105 | 87 |
| Hong Kong | North-East Asian | 96 | 98 | 94 |
| Austria | West-European | 96 | 99 | 93 |
| Italy | West-European | 96 | 100 | 91 |
| Slovakia | East-European | 96 | 95 | 96 |
| Argentina | West-European | 95 | 104 | 87 |
| Singapore | North-East Asian | 95 | 97 | 94 |
| Liechtenstein | West-European | 95 | 94 | 97 |
| Russia | East-European | 95 | 95 | 95 |
| Kazakhstan | West and Central Asian, North African | 95 | 95 | 94 |
| Ukraine | East-European | 94 | 96 | 93 |
| Palau | South-East Asian and Polynesian | 94 | 93 | 96 |
| Croatia | East-European | 94 | 96 | 92 |
| Montenegro | East-European | 94 | 96 | 93 |
| Chile | West-European | 94 | 100 | 87 |
| Georgia | West and Central Asian, North African | 94 | 91 | 96 |
| Cyprus | East-European | 93 | 93 | 94 |
| Luxembourg | West-European | 93 | 91 | 95 |
| Malta | West-European | 93 | 94 | 93 |
| Bulgaria | East-European | 93 | 95 | 91 |
| Barbados | Black African | 93 | 96 | 90 |
| Fiji | South-East Asian and Polynesian
South Asian |
93 | 96 | 90 |
| Cuba | West-European | 93 | 91 | 94 |
| Saudi Arabia | West and Central Asian, North African | 93 | 99 | 86 |
| Portugal | West-European | 92 | 101 | 84 |
| Romania | East-European | 92 | 94 | 91 |
| Tonga | South-East Asian and Polynesian | 92 | 93 | 92 |
| Serbia | East-European | 92 | 93 | 91 |
| Belgium | West-European | 91 | 90 | 93 |
| Sri Lanka | South Asian | 91 | 91 | 91 |
| Mongolia | North-East Asian | 91 | 91 | 87 |
| Grenada | Black African | 90 | 98 | 83 |
| Mauritius | South Asian | 90 | 96 | 84 |
| Uzbekistan | West and Central Asian, North African | 90 | 85 | 95 |
| Uruguay | West-European | 90 | 97 | 83 |
| Armenia | West and Central Asian, North African | 90 | 87 | 93 |
| Brunei | South-East Asian and Polynesian | 89 | 95 | 84 |
| Azerbaijan | West and Central Asian, North African | 89 | 87 | 92 |
| Bahrain | West and Central Asian, North African | 89 | 93 | 86 |
| Andorra | West-European | 89 | 90 | 89 |
| Kyrgyzstan | West and Central Asian, North African | 89 | 88 | 91 |
| Albania | East-European | 89 | 92 | 86 |
| Moldova | East-European | 89 | 83 | 95 |
| Venezuela | West-European | 89 | 93 | 86 |
| Trinidad and Tobago | Black African
South Asian |
89 | 87 | 91 |
| Bahamas | Black African | 89 | 87 | 91 |
| Iran | West and Central Asian, North African | 89 | 94 | 83 |
| Seychelles | Black African
South Asian West-European |
89 | 92 | 86 |
| Belize | Black African
Native American |
88 | 87 | 90 |
| South Africa | Black African | 88 | 88 | 89 |
| Malaysia | South-East Asian and Polynesian | 88 | 88 | 88 |
| Bosnia | East-European | 88 | 92 | 84 |
| Samoa | South-East Asian and Polynesian | 88 | 87 | 89 |
| Jordan | West and Central Asian, North African | 88 | 88 | 88 |
| Qatar | West and Central Asian, North African | 88 | 89 | 87 |
| Brazil | West-European | 88 | 96 | 79 |
| Costa Rica | West-European | 88 | 92 | 83 |
| Panama | Native American | 88 | 88 | 87 |
| United Arab Emirates | West and Central Asian, North African | 87 | 89 | 86 |
| Turkey | West and Central Asian, North African | 87 | 94 | 80 |
| Peru | Native American | 87 | 89 | 84 |
| Saint Lucia | Black African | 87 | 88 | 85 |
| Jamaica | Black African | 87 | 87 | 86 |
| Macedonia | East-European | 86 | 87 | 86 |
| Ecuador | Native American | 86 | 91 | 82 |
| Algeria | West and Central Asian, North African | 86 | 93 | 82 |
| Saint-Kitts and Nevis | Black African | 86 | 90 | 82 |
| Bolivia | Native American | 86 | 91 | 81 |
| Mexico | West-European | 86 | 89 | 83 |
| Saint Vincent and the Grenadines | Black African | 86 | 89 | 83 |
| Lebanon | West and Central Asian, North African | 86 | 89 | 83 |
| Oman | West and Central Asian, North African | 86 | 90 | 81 |
| Botswana | Black African | 86 | 86 | 85 |
| Palestine | West and Central Asian, North African | 85 | 87 | 84 |
| Tajikistan | West and Central Asian, North African | 85 | 82 | 89 |
| Tunisia | West and Central Asian, North African | 85 | 94 | 77 |
| Thailand | South-East Asian and Polynesian | 85 | 90 | 80 |
| Micronesia | South-East Asian and Polynesian | 85 | 83 | 87 |
| Colombia | West-European | 84 | 90 | 79 |
| China | North-East Asian | 84 | 90 | 79 |
| Philippines | South-East Asian and Polynesian | 84 | 83 | 85 |
| Suriname | South-East Asian and Polynesian
Black African South Asian |
84 | 87 | 82 |
| Dominican Republic | Black African | 84 | 89 | 79 |
| Indonesia | South-East Asian and Polynesian | 84 | 87 | 80 |
| Dominica | Black African | 84 | 87 | 80 |
| Gabon | Black African | 84 | 86 | 81 |
| Libya | West and Central Asian, North African | 84 | 89 | 79 |
| Turkmenistan | West and Central Asian, North African | 84 | 80 | 87 |
| Kuwait | West and Central Asian, North African | 83 | 89 | 78 |
| Vietnam | South-East Asian and Polynesian | 83 | 86 | 80 |
| Paraguay | Native American | 83 | 85 | 81 |
| Egypt | West and Central Asian, North African | 82 | 88 | 77 |
| Kiribati | Melanesian | 82 | 84 | 80 |
| El Salvador | Native American | 81 | 89 | 75 |
| Zambia | Black African | 80 | 86 | 76 |
| Maldives | South Asian | 80 | 87 | 74 |
| Guyana | Black African
South Asian |
79 | 78 | 82 |
| Namibia | Black African | 79 | 83 | 76 |
| Ghana | Black African | 79 | 82 | 76 |
| Cabo Verde | Black African | 79 | 90 | 69 |
| Nicaragua | Native American | 79 | 83 | 75 |
| Swaziland | Black African | 79 | 82 | 76 |
| India | South Asian | 79 | 83 | 74 |
| Zimbabwe | Black African | 79 | 79 | 79 |
| Vanuatu | Melanesian | 78 | 80 | 76 |
| Honduras | Native American | 77 | 81 | 74 |
| Congo | Black African | 77 | 81 | 74 |
| Kenya | Black African | 77 | 81 | 74 |
| Sao Tome and Principe | Black African | 77 | 84 | 70 |
| Morocco | West and Central Asian, North African | 77 | 84 | 69 |
| Guatemala | Native American | 77 | 79 | 74 |
| Timor-Leste | Melanesian | 76 | 86 | 67 |
| Lesotho | Black African | 76 | 79 | 73 |
| Togo | Black African | 76 | 84 | 68 |
| Iraq | West and Central Asian, North African | 76 | 77 | 75 |
| Cameroon | Black African | 76 | 78 | 73 |
| Angola | Black African | 76 | 82 | 69 |
| Madagascar | South-East Asian and Polynesian
Black African |
76 | 78 | 73 |
| Nepal | South Asian | 75 | 85 | 66 |
| Laos | South-East Asian and Polynesian | 75 | 80 | 70 |
| Nigeria | Black African | 75 | 77 | 73 |
| Comoros | Black African | 75 | 81 | 69 |
| DR Congo | Black African | 75 | 76 | 73 |
| Uganda | Black African | 74 | 77 | 72 |
| Bhutan | South Asian | 74 | 86 | 62 |
| Cambodia | South-East Asian and Polynesian | 74 | 80 | 68 |
| Bangladesh | South Asian | 74 | 77 | 70 |
| Malawi | Black African | 73 | 80 | 67 |
| Solomon Islands | Melanesian | 73 | 75 | 70 |
| Equatorial Guinea | Black African | 72 | 74 | 71 |
| Tanzania | Black African | 72 | 73 | 72 |
| Rwanda | Black African | 72 | 80 | 65 |
| Haiti | Black African | 72 | 73 | 70 |
| Liberia | Black African | 72 | 76 | 67 |
| Benin | Black African | 72 | 79 | 64 |
| Papua New Guinea | Melanesian | 72 | 76 | 67 |
| Syria | West and Central Asian, North African | 71 | 73 | 70 |
| Cote d’Ivoire | Black African | 71 | 73 | 69 |
| Myanmar | South-East Asian and Polynesian | 71 | 73 | 68 |
| Afghanistan | West and Central Asian, North African | 70 | 77 | 64 |
| Burundi | Black African | 70 | 79 | 62 |
| Pakistan | South Asian | 70 | 70 | 70 |
| Mauritania | West and Central Asian, North African
Black African |
69 | 71 | 67 |
| Sierra Leone | Black African | 69 | 75 | 63 |
| Mozambique | Black African | 69 | 73 | 64 |
| Senegal | Black African | 68 | 75 | 61 |
| Gambia | Black African | 68 | 73 | 63 |
| Guinea-Bissau | Black African | 68 | 74 | 62 |
| Yemen | West and Central Asian, North African | 67 | 73 | 62 |
| Guinea | Black African | 66 | 72 | 60 |
| Central African Republic | Black African | 66 | 66 | 66 |
| Ethiopia | North-East African | 66 | 71 | 60 |
| Mali | Black African | 65 | 71 | 59 |
| Sudan | North-East African | 65 | 66 | 64 |
| Djibouti | Black African | 64 | 63 | 66 |
| South Sudan | Black African | 63 | 58 | 69 |
| Chad | Black African | 63 | 67 | 59 |
| Burkina-Faso | Black African | 62 | 68 | 56 |
| Eritrea | Northeast-African | 62 | 58 | 65 |
| Niger | Black African | 58 | 60 |
57 |
The values were rounded to the nearest unit.
In comparison to the mean national IQs mainly reported by Richard Lynn, 65 countries differed by less than 5 IQ points using the present methodology. It can be said that such small differences validate Lynn’s estimates since it is unlikely that years of education have the same cognitive value in every country and likewise, averaging adult IQ and school-age population IQ without controlling for a country’s age structure somewhat weaken the representativeness of my findings. Differences larger than 5 points were found for 30 countries, and in these cases, I suspect it is due to Lynn manipulating the data to fit racial patterns, Sub-Saharan African countries have been systematically under-estimated and East-Asian ones have been systematically over-estimated by Lynn, also, Some nations in Europe, the Middle-East, South-Asia and Latin America seem to have their scores manipulated in order to appear closer to what they would be based on their racial composition.
Such inconsistencies result in incoherences between the reported IQs and the educational and socio-economic outcomes (regardless of which variable influences the other) of the affected countries and support the accusations of racially-motivated fraud in Richard Lynn’s data collection. In the same way, estimating the mean IQs of countries for which direct data is missing by averaging the figures of neighboring countries of similar ethno-racial composition is unwarranted as race does not seem to play a role in a country’s cognitive performance.
In spite of all the deserved criticism that Lynn’s data met, it can be said that most of the commonly cited mean IQs out of Africa and East-Asia are reliable and that a strong relationship between human capital and human development exists whether we measure it by IQ or years of education. The causes of international variation in school quality and enrollment are well-known and come down to school and student characteristics. Schools in developing countries face numerous challenges: lack of basic amenities such as electricity, potable water, air-conditioning and heating, like of educational supplies (school rarely have enough textbooks and rely on chalk and blackboards), high student to teacher ratios (primary school classes with more than 50 students are common low-income countries), chronic teacher absenteeism (teachers usually have a business on the side), obsolete pedagogy, outdated or irrelevant curricula, multilingualism, exam-corruption, low public funding, misguided policies, gender and ethnic discrimination. Pupils are held back by poor health and nutrition resulting in developmental delays, tuition fees and supplies that poor families can’t afford, war, population displacement, absent educational resources at home, low parental education, lack of transportation, child labor, excessive use of grade repetition, mismatch between school curricula and daily life demands and many other factors. Differences in human capital have large implication in terms of workforce qualification and social behavior, which contribute for a large part to a country’s socio-economic development. The present findings provide evidence for large international inequalities in inter-generational change in educational outcomes which are probably the driving cause of the Flynn effect.
Intergenerational change in cognitive performance.
Estimating IQs from the current school enrollment rates and the mean educational attainment of adults provide insights regarding intergenerational differences in cognitive performance. We can see from these figures that the countries that developed the fastest show large intergenerational differences in education/IQ favoring the younger cohorts, these countries are concentrated in South America, Southern Europe, West Africa, the Middle-East and Oceania, Ethiopia and China also show trends that are in line with their recent economic success. On the other hand, many ex-USSR countries, as well as Japan, Cuba, South Africa, Zimbabwe and the Philippines have been stagnant or even declining relative to the United Kingdom and this is also reflect in their poor socio-economic performance in the last decades. War-torn South Sudan and the Central African Republic experience alarming declines in their educational performance that expose them to grave humanitarian crises in the future. Although there is a clear relationship between socio-economic progress and gains in cognitive performance, a country’s ability to capitalize on its intellectual potential remains highly dependent on its leadership and the odds of the world-market, that’s why theories claiming that IQ is the main driver of global inequalities are not tenable in the light of the current evidence.
Update 09/07/2017 – Detailed comparison with Lynn’s Data
To test the predictive power of my estimates in comparison to Lynn’s, I decided to focus only on the world’s 20 most populous countries. The reason for that is that these countries are home to 70% of the world’s population and the law of large numbers says that they are likely more representative of whatever they could represent. On the other hand, the 100+ other countries are home to only 30% of humanity. They are a source of statistical noise due to extreme outlying values and differences in regional political fragmentation that would hide or weaken general trends better evidenced by considering large countries.
Data:
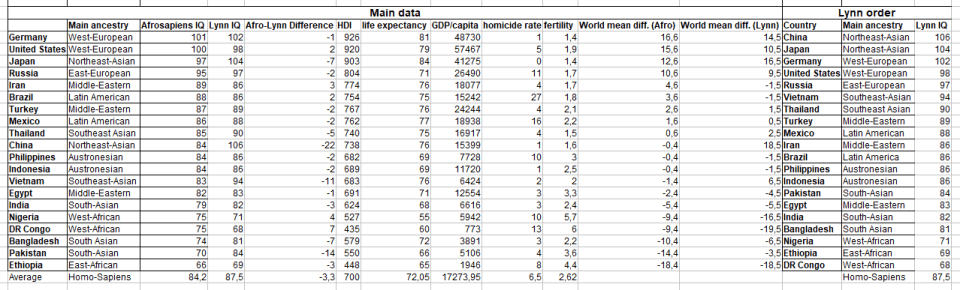
Correlations and averages:
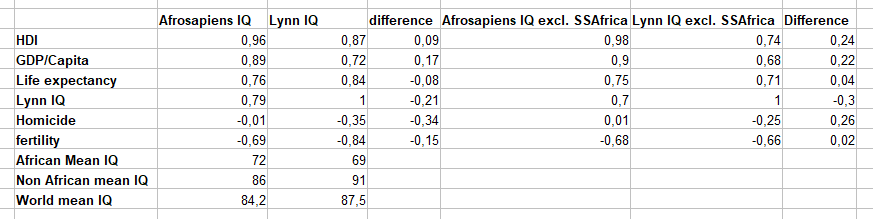
Noticing an abnormal 22 points gap between Sub-Saharan African IQs and the world average on Lynn data, Suspecting that extremely low values would flaw the correlations, I tested if my estimates and Lynn’s would retain the same predictive power with the African IQs excluded. My assumption was that a strong causal relationship would leave the correlations unchanged no matter which countries were included whereas any change in predictive power resulting from excluding some countries would cast doubt on the accuracy of the reported data.
IQ-HDI correlation:
Similarly to my previous calculation including all the countries for which data were available, I found a 0.96 correlation between my estimates and HDI, Lynn’s estimates correlation with HDI was higher (+0.06) than with the worldwide data, but still largely inferior to mine. Removing African countries, the predictive power of my estimates remained the same (+02) whereas Lynn’s significantly decreased (-0.13) and left a predictive gap of 0.24 favoring my estimates. However, given the fact that my estimates are based on variables that are included in the calculation of HDI, such a high predictive power as to be met with caution.
IQ-GDP per capita correlation:
My previous calculation from the worldwide data yielded a correlation coefficient of 0.65 between my IQ estimates and GDP/capita and 0.60 for Lynn’s. Among the 20 most populated countries, the correlation rose by 0.24 points to 0.89 with my estimates and by 0.12 points to 0.72 with Lynn’s. Excluding Sub-Saharan African countries did not affect the predictive power of my estimates (+0.01) and further weakened Lynn’s by 0.04 points, resulting in a 0.22 gap in predictive power favoring my estimates again. This correlation of 0.89 between my IQ estimates and GDP per capita within the world’s population top 20 countries likely is the highest correlate of IQ ever reported in the psychological science and gives strong support to the relationship between schooling, economic development and cognitive ability.
IQ-Life expectancy correlation:
Compared with the worldwide database, the correlation between my IQ estimates and life expectancy was down 0.04 points within the world’s top 20 to 0.76, Lynn’s went up by o.o5 points to 0.84. However, removing Sub-Saharan Africa left the predictive power of my estimates unchanged whereas Lynn’s fell by 0.13 points to 0.71. My estimates again predicted life expectancy better by a small 0.4 points this time.
IQ-Homicide correlation:
Not estimated previously, my data finds an non-existent relationship between IQ and homicide rate (-0.01) and excluding Sub-Saharan Africa confirmed a null relationship between homicide rates and IQ in the rest of the world. Lynn’s estimates showed a low negative correlation between IQ and homicide (-0.35) and the exclusion of African countries further lowered the correlation (-0.25). Lynn’s estimates had a better predictive power which still remained in the range of low statistical significance.
IQ-Fertility correlation:
Adding a new variable, I found a negative correlation of -0.69 between my IQ estimates and Fertility, the correlation remained the same (-0.68) with the African countries excluded. The correlation between Lynn’s IQs and fertility was stronger (-0.84), but removing African data decreased it by 0.18 points to 0.66. My estimates ended up with a slightly stronger predictive power (+0.02).
General patterns:
In addition to having a stronger and globally consistent predictive power, my estimates reveal how Richard Lynn manipulates the data to fit desired racial patterns.
As expected from the 0.96 correlation between my IQ data and HDI, the ranking of countries by cognitive ability shows a perfect gradient from high to low development status. Moreover, the highest gap between two following countries is the 6 points separating Russia and Iran, showing a marked difference between the developed and the developing world.
Ranking countries by Lynn-estimated IQs results in a whole other pattern in which a country’s dominant ancestry seems to be the only variable that matters. East-Asians are on top, followed by Western Europeans, then Eastern-Europeans, South-East Asians, fair skinned Middle-Easterners (Turkey and Iran) and Latin Americans, Austronesians (Indonesia and the Philippines), South Asians and Arabs, and finally Sub-Saharan Africans far below, with a huge 10 points gap (the largest between two following countries in his dataset) separating Bangladesh from Nigeria.
The manipulation is quite apparent, Lynn largely over-estimated China (+22), Japan (+7) to make East-Asians cluster on top, thus protecting himself from accusations of nordicism and giving support to the inter-cultural validity of the IQs that he cherry-picked. The western European and Russian data remained mostly unchanged. Vietnam (+11) and Thailand (+5) were given a bonus for their genetic proximity to North-East Asia that is supposed to make them score in the low 90s despite their lack of development. Little changes were brought to the scores of the Latin American, Middle-Eastern and Austronesian countries usually scoring in the mid-80s. Major fraud (+14 in Pakistan, +7 in Bangladesh) was done to lift up South-Asian countries out of the 70s range and excluding Sub-Saharan Africa as the only region scoring 70 or below and downgrading Nigeria (-4) and the DR. Congo (-7) in the process.
By pointing this out, I’m warning honest researchers and laymen about the dangers of relying on data resulting from undisclosed, unsystematic and un-replicable methodology. And although my estimates do not result from any actual IQ measurement beyond the relationship between IQ and schooling evidenced in Norwegian cohorts, my method uses a single, universal conversion factor applied to representative official data collected by professional demographers whereas Lynn’s and the likes’ cherry-picking of samples is only the hobby of a dozen scholars and pseudo-scholars. This is how I found out strong, consistent and meaningful correlations between IQ and various development variables.
Although they are likely more representative of the worldwide distribution of cognitive ability, my estimates still provide evidence that a large part (the largest part, actually) of the world’s population scoring below one standard deviation on Western-normed IQ tests, which is the case for 11 of the world’s 20 most populated countries. Although this may sound alarming, with Pakistan and Ethiopia scoring in the range of mental disability (70 and 66 respectively), I think this effect comes from using Western populations as a reference for standardization.
In fact, another picture emerges when we compare countries with the world’s average, replacing the eurocentric British Greenwich IQ of 100 by an universal IQ of 84 and thus giving a more accurate idea of what is normal cognitive ability by the standards of humanity. In this sample, China, the Philippines and Indonesia are representative of the top of the bell curve whereas Ethiopia, the United States and Germany are the only outliers left with respective Universal IQs of 81.6, 115.6 and 116.6. For this reason, I recommend the use of Chinese or South-East Asian normalization samples in international IQ comparisons.
