
Home » 2018 (Page 2)
Yearly Archives: 2018
Differences in Body Composition Between Asians and Whites
1700 words
Black-white differences get talked about more than Asian-white differences. (For the purposes of this article, “Asian” refers to Koreans, Chinese, Japanese and Filipinos whereas “white” refers to those of European descent.) One interesting racial difference is that of body fatness between ethnies/races. Blacks have thinner skin folds and lower percent body fat than whites at the same height/BMI, and Asians have higher body fat and larger skinfolds than do whites. The interesting thing about this Asian-white difference is the fact that, at the same BMI, Asians have more upper body fat (trunk) than whites. The interesting thing is that there are two good studies, looking at these types of differences between Asians and whites (one study looking at the aforementioned “Asians” I previously identified and whites in the NYC area and another comparing whites and Chinese living in China.)
Wang et al (1994) studied 687 healthy volunteers (445 whites and 242 Asians, ranging from 18-94 years of age with BMIs in the range of 15-38). They defined ethnicity as the birthplace of one’s grandparents. The “Asian” category included 225 Chinese, 9 Japanese, 6 Koreans and 2 Filipinos; 97 percent of this sample was born in Asia. Then, after an overnight fast to better assess body fat differences and skinfold measures, they were weighed and measured, with their back, butt and feet firmly against the wall.
They measured skinfold thickness at the midarm for the average of the triceps and biceps, trunk thickness was the average circumference of the chest, subscapular, umbilicus, abdomen, and suprailiac. The circumference of the arm was measured at the midarm, while the circumference of the trunk was the average circumference of the upper chest, waist, iliac crest, and chest.
Wang et al (1994) found that whites were significantly taller, heavier and had higher BMIs than Asians. Wang et al (1994: 25) write:
For lean and normal BMIs, Asians were fatter than whites in both sexes, but the differences in estimated fat% between whites and Asians varied by BMI in different directions for males and females: fat% increased with BMI for males but decreased with BMI for females.
Whites were had significantly larger circumference in the measured appendages compared to Asians, while in Asian and white females, the circumference of the arms and waist were not different but other circumferences showed a greater difference, favoring whites. Asians had significantly higher levels of subcutaneous trunk fat (upper body fat) than whites, while white females had more lower (thigh) body fat than Asians. In both sexes, Asians had thicker bicep, subscapular, abdomen, and suprailiac skinfolds than whites, in both sexes. White women had higher levels of subcutaneous fat in their thighs. The only difference between white and Asian males in regard to skinfold area was the thigh, with whites having larger thighs, but were similar at the midarm and trunk. Asian men had a larger trunk skinfold area whereas whites had a larger thigh skinfold area while arm fatness did not differ between the races. Women in both races had larger skinfold areas except in the trunk; for whites, there were no differences between the sexes. In both sexes, Asians had higher values in subcutaneous fat (at the midarm, trunk, and midthigh), but white women had a higher value in the thigh than Asian women.
Wang et al (1994) show that there are significant differences in body fatness at different sites of the body, and so, since most (if not all) BMI equations are based on white populations, then, these equations will not work for Asians and will result in substantial error.
Wang et al (2011) studied differences in body composition between Chinese and white males living in the Shenzhen, Guangdong Province, China. They studied 115 Chinese and 114 white males. In this sample, Chinese males were younger, shorter, had a lower body weight and lower BMI than the white sample. Whites had higher fat mass, fat-free mass and bioelectrical impedance (which assess body composition, which measures lean mas in relation to fat mass; but these can be skewed by how much water one has or has not drunk, and so the DXA scan and hydrostatic weighing are, in my opinion, superior assessors). After adjustment for age and BMI, the percentage of fat mass in the trunk and arm was higher in Chinese than white males. Further, Chinese men had higher diastolic blood pressure (DBP), fasting glucose (FG) and triglycerides (TG), while whites had higher fasting total plasma cholesterol (TC) and high-density lipoprotein (HDL). The only statistically significant differences were between FG and HDL. Even after adjustment, Chinese men had 3.0 mmHg higher DBP than whites.
Chinese men had higher percent body fat than whites and more fat stored around their trunks than whites at the same BMI. Chinese men had higher fasting glucose levels (a risk-factor for obesity) but lower HDL levels at the same BMI as whites. Wang et al (2011) write:
In addition, comparing the two nationally representative studies, NHANES III [32] and China National Nutrition and Health Survey 2002 (CNNHS 2002) [33], Chinese men held a relatively 15.0% lower mean value of BMI than that for American white men. While comparison results from two large-scale epidemiological studies, the Shanghai Diabetes Studies (SHDS) [34] and the NHANES III [35], show that the mean value of PBF for American men is relatively 7.4% higher than that for Chinese men. The relative difference of PBF between American and Chinese males is much less than the difference of BMI, implying that the PBF among American men should be lower than that of Chinese men with the same BMI level.
What this implies is that the proportion of overweight/obese Chinese men are severely underestimated since, as noted earlier, most—if not all—BMI equations are created using strictly white populations. This study also provides more evidence that Chinese men had more central (trunk) adiposity than whites (Britons, in this study; Eston, Evans, and Fu, 1994). Central adiposity and risk for type II diabetes and cardiovascular disease is heightened in those of Chinese descent (Weng et al, 2006). It should also be noted that, in a sample of 129 Pacific Islanders, 120 Asians, 91 Maoris, and 91 Europeans aged 12-91, the relationship between bioelectrical impedance analysis (BIA) is ethnicity-dependent, due to the fact the equations developed for fatness estimation using BIA were more accurate than what was recommended by the manufacturer (Sluyter et al, 2010). Cheng (2011) showed that central adiposity was more predictive of cardiovascular diseases in the Chinese population than was BMI, while Hu et al (2007) showed that central obesity was more related to diabetes mellitus and impaired fasting glucose than to overall obesity in the Chinese population.
So, clearly, obesity-related factors appear at lower BMIs for Asians than Europeans (e.g., Huxley et al, 2008). Pan et al (2004) showed that for most BMI values, incidences of hypertension, diabetes, and hyperuricemia were higher in the Taiwanese sample than in the white and black samples. As BMI got higher, the risk for hypertriglyceridemia and hypertension increased. They showed that BMIs of 22.6, 26, and 27.5 were the cutoffs for the best predictabilty in regard to negative and positive variables for Taiwanese, white and black men, respectively. Pan et al (2004: 31) write:
For BMIs 27, 85% of Taiwanese, 66% of whites, and 55% of blacks had at least one of the studied comorbidities. However, a cutoff close to the median of the studied population was often found by maximizing sensitivity and specificity. Reducing BMI from 25 to 25 in persons in the United States could eliminate 13% of the obesity comorbidity studied. The corresponding cutoff in Taiwan is slightly 24.
Pan et al (2004) conclude that, for Taiwanese (Asians) in their study, they should have a lower BMI cutoff than whites and blacks, though it is tough to ascertain where that cutoff would be.
Bell, Adair, and Popkin (2002) show that “at BMI levels less than 25, prevalence difference figures suggested a stronger association between BMI and hypertension in Chinese men and women but not in Filipino women, compared with non-Hispanic Whites” while “[n]on-Hispanic Blacks and Filipino women had a higher prevalence of hypertension at every level of BMI compared with non-Hispanic Whites and Mexican Americans.”
Since Asians have a higher risk of hypertension than whites after controlling for BMI, this indicates that the effects of obesity are not as important as other factors, be they genetic or environmental (or both, which it obviously is). The higher incidence of obesity-related risk-factors in Asian populations with lower BMIs has been attributed to GxE interactions, which, of course, have been intensified with the introduction of the Western Diet (AKA the SAD [Standard American Diet] diet). This can be most notably seen with the explosion of childhood obesity in China, with the number of obese people in China surpassing the US recently, while China is on its way to have the most obese children in the world. The surging obesity epidemic in China is due to increasingly similar lifestyles to what we have (sedentary populations; highly processed, high fat, high carbohydrate foodstuff).
So since the findings in the reviewed studies suggest that, at a lower BMI, Asians are more susceptible to obesity-related risk-factors, and so, BMI standards must be lowered for Asian populations, which would be BMI 24 for overweight and BMI 27 for obese, which was recommended by the Chinese Ministry of Health (Wang et al, 2010). Cheung et al (2018) show that diet quality is inversely associated with obesity in Chinese adults who have type II diabetes.
In conclusion, Asians at the same BMI have higher body fat percentage than whites, and they also have more obesity-related risk-factors than whites at a lower BMI (Pan et al, 2004; WHO expert consultation, 2004; Wang et al, 2010; Hsu et al, 2015), which implies that they need differing BMI scales, just as blacks need different scales in comparison with whites. Here is a good example of two people with the same BMI (22.3) but different DXA results:
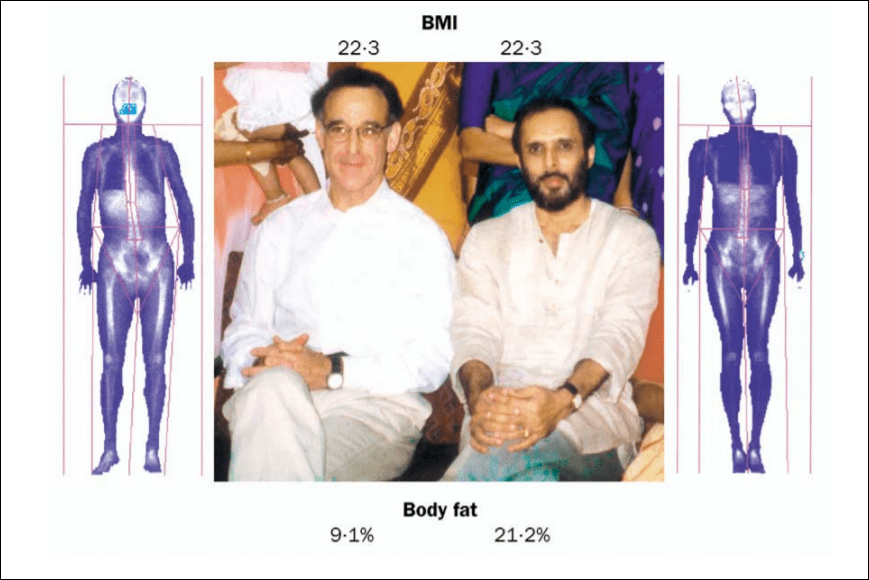
This, of course, shows the strong limitations of the use of the same BMI standards calculated in one ethny and used for another. So, just like at the same BMI blacks have lower body fat and thinner skinfolds than whites (Vickery, Cureton, and Collins, 1988; Wagner and Heyward, 2000; Flegal et al, 2010), at the same BMI as whites, Asians have higher body fat and thicker skinfolds (Wang et al, 1994; WHO expert consultation, 2004; Wang et al, 2011).
What Is the “Human Diet”?
3000 words
Is there one (or, one with slight modifications) diet that all humans should be eating? I’m skeptical of such claims. Though both vegans (one who does not eat or use animal products) and carnivores (one who eats only animal products), in my opinion, have some warped views on diet and human evolution. Both are extreme views; both have wrong ideas about diet throughout our evolution; both get some things right. Though, both are extreme views with little to no support. While it is hard to pinpoint what the “human diet” is, clearly, there were certain things that we ate through our evolutionary niches in our ancestral Africa that we “should” be eating today (in good quantities).
Although it is difficult to reconstruct the diet of early hominids due to lack of specimens (Luca, Perry, and Rienzo, 2014), by studying the eating behavior of our closest evolutionary relatives—the chimpanzees—we can get an idea of what our LCA ate and its eating behavior (Ulijaszek, Mann, and Elton, 2013). Humans have been throughout most every niche we could possibly been in and, therefore, have come across the most common foods in each ecology. If animal A is in ecosystem E with foods X, Y, and Z, then animal A eats foods X, Y, and Z, since animals consume what is in their ecosystem. Knowing this much, the niches our ancestors lived in in the past had to have a mix of both game and plants, therefore that was our diet (in differing amounts, obviously). But it is more complicated than that.
So, knowing this, according to Ulijaszek, Mann, and Elton, (2013: 35) “Mammalian comparisons may be more useful than ‘Stone Age’ perspectives, as many of the attributes of hominin diets and the behaviour associated with obtaining them were probably established well before the Pleistocene, the time stone agers were around (Foley 1995; Ulijaszek 2002; Elton 2008a).” Humans eat monocots (various flowering plants with one seed), which is not common our order. The advent of farming was us “expanding our dietary niche”, which began “the widespread adoption of agriculture [which] is an obvious point of transition to a ‘monocot world’” (Ulijaszek, Mann, and Elton, 2013). Although these foodstuffs dominate our diet, there is seasonality in what types of those foods we consume.
So since humans tend to not pick at things to eat, but have discrete meals (it is worth noting that one should have “three square meals a day” is a myth; see Mattson et al, 2014), we need to eat a lot in the times we do eat. Therefore, since we are large-bodied primates and our energy needs are much higher (due to our large brains that consume 20 percent of our daily caloric consumption), we need higher quality energy. The overall quality and energy density of our diets are due to meat-eating—which folivorous/frugivorous primates do not consume. We have a shorter gut tract which is “often attributed to the greater reliance of faunivory in humans“, though “humans are not confined to ‘browse’ vegetation … and make extensive use of grasses and their animal consumers” (Ulijaszek, Mann, and Elton, 2013: 58). Due to this, we show amazing dietary flexibility and adaptability due to our ability to eat a wide range of foodstuffs in most any environment we find ourselves in.
So “It is difficult to pinpoint what the human diet actually is … Nonetheless, humans are frequently described as omnivores” (Ulijaszek, Mann, and Elton, 2013: 59). Omnivores normally feed at two or more trophic levels, though others define it as just consuming plants and animals (Chubaty et al, 2014). Trophic level one is taken up by plants; level two is taken up by herbivores—primary consumers; level three is taken up by predators—who feed on the herbivores; level four or five is taken up by apex predators or carnivores; while the last level is also taken up by detrivores—those who feed on waste. Though, of course, “omnivory” is a continuum and not a category in and of itself. Humans eat primary producers (plants) and primary consumers (herbivores) and some secondary consumers (like fish), “although human omnivory may only be possible because of technological processing” (Ulijaszek, Mann, and Elton, 2013: 59). Other animals described as “omnivorous” eat only foods from one trophic level and only consume food from another level when needed.
Humans—as a species—rely on meat consumption. Fonseca-Azevedo and Herculano-Houzel (2012) showed that the energetic cost of a brain is directly related to the number of neurons in the brain. So, there were metabolic limitations in regard to brain and body size. The number of hours available to feed along with the low caloric yield of plant foods explains why great apes have such large bodies and small brains—which was probably overcome by erectus, who probably started cooking food around 1.5 mya. If we consumed only a diet of raw foods, then it would have taken us around 9 h/day to consume the calories we would need to power our brains—which is just not feasible. So it is unlikely that erectus—who was the first to have the human body plan and therefore the ability to run, which implies he would have needed higher quality energy—would have survived on a diet of raw plant foods since it would take so many hours to consume enough food to power their growing brains.
We can see that we are adapted to eating meat by looking at our intestines. Our small intestines are relatively long, whereas our long intestines are relatively short, which indicates that we became adapted to eating meat. Our “ability to eat significant quantities of meat and fish is a significant departure from the dietary norm of the haplorhine primates, especially for animals in the larger size classes.” Though “Humans share many features of their gut morphology with other primates, particularly the great apes, and have a gut structure that reflects their evolutionary heritage as plant, specifically ripe fruit, eaters” (Ulijaszek, Mann, and Elton, 2013: 63). Chimpanzees are not physiologically adapted to meat eating, which can be seen in the development of hypercholesterolemia along with vascular disease, even when controlled diets in captivity (Ford and Stanford, 2004).
When consuming a lot of protein, though, “rabbit starvation” needs to be kept in mind. Rabbit starvation is a type of malnutrition that arises from eating little to no fat and high amounts of protein. Since protein intake is physiologically demanding (it takes the most energy to process out of the three macros), Ben-Dor et al (2011) suggest a caloric ceiling of about 35 percent of kcal coming from protein. So erectus’ protein ceiling was 3.9 g/bw per day whereas for Homo sapiens it was 4.0 g/bw per day. Ben-Dor et al (2011) show that erectus’ DEE (daily energy expenditure) was about 2704 kcal, with “a maximum long-term plant protein ceiling of 1014 calories“, implying that erectus was, indeed, an omnivore. So, of course, the consumption of protein and raw plants are physiologically limited. Since erectus’ ceiling on protein intake was 947 kcal and his ceiling on raw plant intake was 1014 kcal, then, according to the model proposed by Ben-Dor et al (2011), erectus would have needed to consume about 744 kcal from fat, which is about 27 percent of his overall caloric intake and 44 percent of animal product intake.
Neanderthals would have consumed between 74-85 percent of their daily caloric energy during glacial winters from fat, with the rest coming from protein (Ben-Dor, Gopher, and Barkai, 2016), while consuming between 3,360 to 4,480 kcal per day (Steegman, Cerny, and Holliday, 2002). (See more on Neanderthal diet here.) Neanderthals consumed a large amount of protein, about 292 grams per day (Ben-Dor, Gopher, and Barkai, 2016: 370). Since our close evolutionary cousins (Neanderthals and erectus) ate large amounts of protein and fat, they were well-acclimated, physiologically speaking, to their high-protein diets. Though, their diets were not too high in protein to where rabbit starvation would occur—fat was consumed in sufficient amounts in the animals that Neanderthals hunted and killed, so rabbit starvation was not a problem for them. But since rabbit starvation is a huge problem for our species, “It is therefore unlikely that humans could be true carnivores in the way felids are” (Ulijaszek, Mann, and Elton, 2013: 66).
We consume a diet that is both omnivorous and eclectic, which is determined by our phylogeny through the form of our guts; we have nutritional diversity in our evolutionary history. We needed to colonize new lands and, since animals can only consume what is in their ecosystem, the foods that are edible in said ecosystem will be what is consumed by that animal. Being eclectic feeders made the migration out of Africa possible.
But humans are not true carnivores, contrary to some claims. “Meat-eating has allowed humans to colonize high latitudes and very open landscapes. However, bearing in mind the phylogenetic constraints that prevent humans from being true carnivores, such expansion was probably not accomplished through meat-eating alone. Instead, humans have used their ability to technologically harvest, produce, and consume a very wide range of foods to help exploit all major biomes” (Ulijaszek, Mann, and Elton, 2013: 67).
Humans, though, lack the gut specialization and dentition to process grasses efficiently. This means that our ancestors ate animals that ate these things, and therefore the C4 they consumed elevated the levels in the fossils we discovered. Information like this implies that our ancestors ate across a wide variety of trophic levels and had substantial dietary diversity throughout evolutionary history.
“Hominins lack the specialized dentition found in carnivorans (the group of animals that includes the cat and dog families) and other habitual meat and bone eaters, so must have pre-processed at least some of the meat in their diet” (Ulijaszek, Mann, and Elton, 2013: 81). This is where stone tools come into play (Zink and Lieberman, 2016). “Processing” food can be anything from taking out nutrients to changing how the food looks. We can look at “food processing” as a form of pre-digestion before consumption. The use of stone tools, and cooking, was imperative for us to begin the processing of meat and other foods. This gave us the ability to “pre-digest” our food before consumption, which increases the available energy in any food that is cooked/processed. For example, cooking denatures protein strands and breaks down the cell walls which gelatinizes the collagen in the meat which allows for easier chewing and digestion. Carmody et al (2016) showed that adaptation to a cooked diet began around 275 kya.
In his book Catching Fire, Wrangham (2009: 17-18) writes:
Raw-foodists are dedicated to eating 100 percent of their diets raw, or as close to 100 percent as they can manage. There are only three studies of their body weight, and all find that people who eat raw tend to be thin. The most extensive is the Giessen Raw Food study, conducted by nutritionist Corinna Koebnick and her colleagues in Germany, who used questionnaires to study 513 raw-foodists who ate from 70 to 100 percent of their diet raw. They chose to eat raw to be healthy, to prevent illness, to have a long life, or to live naturally. Raw food included not only uncooked vegetables and occasional meat, but also cold-pressed oil and honey, and some items were lightly heated such as dried fruits, dried meat, and dried fish. Body mass index (BMI), which measures weight in relation to the square of the height, was used as a measure of fatness. As the proportion of food eaten raw rose, BMI fell. The average weight loss when shifting from a cooked to a raw food diet was 26.5 pounds (12 kilograms) for women and 21.8 pounds (9.9 kilograms) for men. Among those eating a purely raw diet (31 percent), the body weights of almost a third indicated chronic energy deficiency. The scientists’ conclusion was unambiguous: “a strict raw food diet cannot guarantee an adequate energy supply.”
Also, vegetarians and meat-eaters who cooked their food have similar body weights. This implies that cooking food—no matter the type—gives more caloric energy to use for the body and that raw-foodists are fighting a losing battle with biology, consuming raw foods at such a high quantity that our guts are not used for. As can be seen above in the citation from Fonseca-Azevedo and Herculano-Houzel (2012), great apes who eat nothing but raw food have large guts and bodies which are needed to consume the raw plant foods they eat but we cannot thrive on such a diet because it is not calorically nor nutritionally viable for us—most importantly due to the size of our brains and its caloric requirements.
Carmody, Weintraub, and Wrangham (2011) show that modern raw-foodists who subsist on raw meat and plants have nutrient deficiencies and chronic energy deficiencies, even though they process their foods (cooking is a form of processing, as is cutting, mashing, pounding, etc) in different manners, while females experience low fecundity. Thus, the cooking of food seems to be needed for normal biological functioning; we have clearly evolved past consuming all raw foods. So it is clear that cooking—along with meat-eating—was imperative to our evolution. (Which does not mean that humans only ate meat and that eating meat and only meat is part of our evolutionary history.) Cooking food lead to it gelatinizing which denatured the protein, leading to easier mastication of the food, which meant less force since the food was not as hard after cooking. This then led to smaller teeth, over time, which was seen in erectus (Zink and Lieberman, 2016). This was due to cooking along with tool-use: the tool-use lead to smaller particles leading to less force per bite, which eventually led to smaller teeth in our lineage.
Finally, humans are said to be “facultative carnivores.” A facultative carnivore is an animal that does best on a carnivorous diet but can survive—not thrive—on other foodstuffs when meat is not available. This, though, doesn’t make sense. Humans are eclectic feeders—omnivorous in nature. Yes, we began cooking about 1.5 mya; yes meat-eating (and the cooking of said meat) is huge in the evolution of our species; yes without meat and cooking we would not have had the energy requirements to split off from chimpanzees/great apes. But this does not mean that we do “best” on a carnivorous diet. There are about 7,105 ethnic groups in the world (Spencer, 2014: 1029), and so to say that all of these ethnies would do the same or similar, physiologically speaking, on an all-meat diet is crazy talk. The claims that we subsisted on one type of food over the other throughout our evolutionary history is a bold claim—with no basis in evolutionary history.
Marlene Zuk (2013: 103-104), author of Paleofantasy writes:
Another implication of the importance Marlowe attaches to bow hunting is that, rather than starting out as exclusively carnivorous and then adding starches and other plant material to the diet, ancient humans have been able to increase the proportion of meat only after newer technology had come about, a mere 30,000 years ago. Other anthropologists concur that the amount of meat in the human diet grew as we diverged from our other primate ancestors. All of this means that, first, contrary to the claims of many paleo-diet proponents, the earliest humans did not have an exclusively meat-based diet that we are best adapted to eat; and second, our ancestors’ diets clearly changed dramatically and repeatedly over the last tens, not to mention hundreds, thousands of years, even before the advent of agriculture.
The assumption that we were fully (or even mostly) carnivorous and then added plant foods/carbs is clearly false. “Fantasies” like this are “just-so stories”; they are nice-sounding stories, but reality is clearly more nuanced than people’s evolutionary and Stone Age imaginations. This makes sense, though. Since we evolved from an LCA (last common ancestor) with chimpanzees some 6.3 mya (Patterson et al, 2006). So why would it make sense that we would then, ultimately, only subsist on an all-meat diet, if our LCA with chimpanzees was most likely a forager who lived in the trees (Lieberman, 2013).
One thing, though, I’m sure that everyone agrees with is that the environments we have constructed for ourselves in the first world are maladaptive—what is termed an “evolutionary mismatch” (Lieberman, 2013; Genne-Bacon, 2014). The mismatch arises from the high-carb food environments we have constructed, with cheap foodstuffs that is loaded with sugar, salt, and fat which is much more addictive than on their own (see Kessler, 2010). This makes food more palatable and people then want to eat it more. Foods like this, obviously, were not in our OEE (original evolutionary environment), and therefore cause us huge problems in our modern-day environments. Evolutionary mismatches occur when technological advancement increases faster than the genome can adapt. This can clearly be seen in our societies and the explosion of obesity over the past few decades (Fung, 2016, 2018).
We did not evolve eating highly processed carbohydrates loaded with salt and sugar. That much everyone can agree on.
Conclusion
It is clear that both claims from vegans/vegetarians and carnivores are false: there is no one “human diet” that we “should” be eating. Individual variation in different physiologic processes implies that there is no one “human diet”, no matter what type of food is being pushed as “what we should be” eating. Humans are eclectic feeders; we will eat anything since “Humans show remarkable dietary flexibility and adaptability“. Furthermore, we also “have a relatively unspecialized gut, with a colon that is shorter relative to overall size than in other apes; this is often attributed to the greater reliance on faunivory in humans (Chivers and Langer 1994)” (Ulijaszek, Mann, and Elton, 2013: 58). Our dietary eclectism can be traced back to our Australopithecine ancestors. The claim that we are either “vegetarian/vegan or carnivore” throughout our evolution is false.
Humans aren’t “natural carnivores” or “natural vegans/vegetarians.” Humans are eclectic feeders. Animals eat whatever is in their ecosystem. Ergo humans are omnivores, though we can’t pinpoint what the “human diet” is since there is great variability in it due to culture/ecology, we know one thing: we did not subsist on mainly only one food; we had a large variety of food, especially with fallback foods, to consume throughout our evolutionary history. So claims that we evolved to eat a certain way (as vegans/vegetarians and carnivores claim) is false. (Note I am not saying that high carb diets are good; I’ve railed hard on them.)
Do Genes and Polymorphisms Explain the Differences between Eastern and Western Societies?
2150 words
In 2012, biologist Hippokratis Kiaris published a book titled Genes, Polymorphisms, and the Making of Societies: How Genetic Behavioral Traits Influence Human Cultures. His main point is that “the presence of different genes in the corresponding people has actually dictated the acquisition of these distinct cultural and historical lines, and that an alternative outcome might be unlikely” (Kiaris, 2012: 9). This is a book that I have not seen discussed in any HBD blog, and based on the premise of the book (how it purports to explain behavioral/societal outcomes between Eastern and Western society) you would think it would be. The book is short, and he speaks with a lot of determinist language. (It’s worth noting he does not discuss IQ at all.)
In the book, he discusses how genes “affect” and “dictate” behavior which then affects “collective decisions and actions” while also stating that it is “conceivable” that history, and what affects human decision-making and reactions, are also “affected by the genetic identity of the people involved” (Kiaris, 2012: 11). Kiaris argues that genetic differences between Easterners and Westerners are driven by “specific environmental conditions that apparently drove the selection of specific alleles in certain populations, which in turn developed particular cultural attitudes and norms” (Kiaris, 2012: 91).
Kiaris attempts to explain the societal differences between the peoples who adopted Platonic thought and those who adopted Confucian thought. He argues that differences between Eastern and Western societies “are not random and stochastic” but are “dictated—or if this is too strong an argument, they are influenced considerably—by the genes that these people carry.” So, Kiaris says, “what we view as a choice is rather the complex and collective outcome of the influence of people’s specific genes combined with the effects of their specific environment … [which] makes the probability for rendering a certain choice distinct between different populations” (Kiaris, 2012: 50).
The first thing that Kiaris discusses (behavior wise) is DRD4. This allele has been associated with miles migrated from Africa (with a correlation of .85) along with novelty-seeking and hyperactivity (which may cause the association found with DRD4 frequency and miles migrated from Africa (Chen et al, 1999). Kiaris notes, of course, that the DRD4 alleles are unevenly distributed across the globe, with people who have migrated further from Africa having a higher frequency of these alleles. Europeans were more likely to have the “novelty-seeking” DRD7 compared to Asian populations (Chang et al, 1996). But, Kiaris (2012: 68) wisely writes (emphasis mine):
Whether these differences [in DRD alleles] represent the collective and cumulative result of selective pressure or they are due to founder effects related to the genetic composition of the early populations that inhabited the corresponding areas remains elusive and is actually impossible to prove or disprove with certainty.
Kiaris then discusses differences between Eastern and Western societies and how we might understand these differences between societies as regards novelty-seeking and the DRD4-7 distribution across the globe. Westerners are more individualistic and this concept of individuality is actually a cornerstone of Western civilization. The “increased excitability and attraction to extravagance” of Westerners, according to Kiaris, is linked to this novelty-seeking behavior which is also related to individualism “and the tendency to constantly seek for means to obtain satisfaction” (Kiaris, 2012: 68). We know that Westerners do not shy away from exploration; after all, the West discovered the East and not vice versa.
Easterners, on the other hand, are more passive and have “an attitude that reflects a certain degree of stoicism and makes life within larger—and likely collectivistic—groups of people more convenient“. Easterners, compared to Westerners, take things “the way they are” which “probably reflects their belief that there is not much one can or should do to change them. This is probably the reason that these people appear rigid against life and loyal, a fact that is also reflected historically in their relatively high political stability” (Kiaris, 2012: 68-69).
Kiaris describes DRD4 as a “prototype Westerner’s gene” (pg 83), stating that the 7R allele of this gene is found more frequently in Europeans compares to Asians. The gene has been associated with increased novelty-seeking, exploratory activity and human migrations, along with liberal ideology. These, of course, are cornerstones of Western civilization and thought, and so, Kiaris argues that the higher frequency of this allele in Europeans—in part—explains certain societal differences between the East and West. Kiaris (2012: 83) then makes a bold claim:
All these features [novelty-seeking, exploratory activity and migration] indeed tend to characterize Westerners and the culutral norms they developed, posing the intriguing possibility that DRD4 can actually represent a single gene that can “predispose” for what we understand as the stereotypic Western-type behavior. Thus, we could imagine that an individual beating the 7-repeat allele functions more efficiently in Western society while the one without this allele would probably be better suited to a society with Eastern-like structure. Alternatively, we could propose that a society with more individuals bearing the 7-repeat allele is more likely to have followed historical lines and choices more typical of a Western society, while a population with a lower number (or deficient as it is the actual case with Easterners) of individuals with the 7-repeat allele would more likely attend to the collective historical outcome of Eaasterners.
Kiaris (2012: 84) is, importantly, skeptical that having a high number of “novelty-seekers” and “explorers” would lead to higher scientific achievement. This is because “attempts to extrapolate from individual characteristics to those of a group of people and societies possess certain dangers and conceptual limitations.”
Kiaris (2012: 86) says that “collectivistic behavior … is related to the activity of serotonin.” He then goes on to cite a few instances of other polymorphisms which are associated with collective behavior as well. Goldman et al (2010) show ethnic differences in the l and s alleles (from Kiaris, 2012: 86):
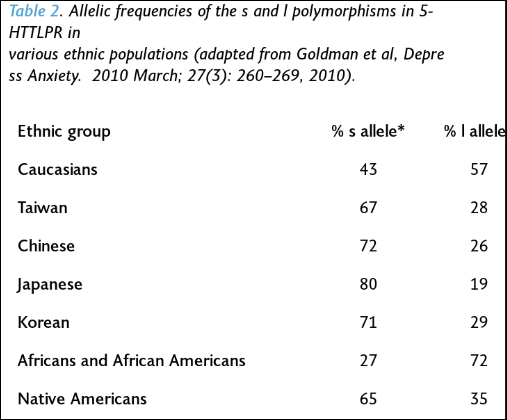
It should also be noted that populations (Easterners) that had a higher frequency of the s allele had a lower prevalence of depression than Westerners. So Western societies are more likely to “suffer more frequently from various manifestations of depression and general mood disorders than those of Eastern cultures (Chiao & Blizinsky, 2010)” (Kiaris, 2012: 89).
As can be seen from the table above, Westerners are more likely to have the l allele than Easterners, which should subsequently predict higher levels of happiness in Western compared to Eastern populations. However, “happiness” is, in many ways, subjective; so how would one find an objective way to measure “happiness” cross-culturally? However, Kiaris (2012: 94) writes: “Intuitively speaking, though, I have to admit that I would rather expect Asians to be happier, in general, than Westerners. I cannot support this by specific arguments, but I think the reason for that is related to the individualistic approach of life that the people possess in Western societies: By operating under individualistic norms, it is unavoidably stressful, a condition that operates at the expense of the perception of individuals’ happiness.”
Kiaris discusses catechol-O-methyltransferase (COMT), which is an enzyme responsible for the inactivation of catecholamines. Catecholamines are the hormones dopamine, adrenaline, and noradrenaline. These hormones regulate the “fight or flight” function (Goldstein, 2011). So since catecholamines play a regulatory role in the “fight or flight” mechanism, increased COMT activity results in lower dopamine levels, which is then associated with better performance.
“Warriors” and “worriers” are intrinsically linked to the “fight or flight” mechanism. A “warrior” is someone who performs better under stress, achieves maximal performance despite threat and pain, and is more likely to act efficiently in a threatening environment. A “worrier” is “someone that has an advantage in memory and attention tasks, is more exploratory and efficient in complex environments, but who exhibits worse performance under stressful conditions (Stein et al., 2006)” (Kiaris, 2012: 102).
Kiaris (2012: 107) states that “at the level of society, it can be argued that the specific Met-bearing COMT allele contributes to the buildup of Western individualism. Opposed to this, Easterners’ increased frequency of the Val-bearing “altruistic” allele fits quite well with the construction of a collectivistic society: You have to be an altruist at some degree in order to understand the benefits of collectivism. By being a pure individualist, you only understand “good” as defined and reflected by your sole existence.”
So, Kiaris’ whole point is thus: there are differences in polymorphic genes between Easterners and Westerners (and are unevenly distributed) and that differences in these polymorphisms (DRD4, HTT, MAOA, and COMT) explain behavioral differences between behaviors in Eastern and Western societies. So the genetic polymorphisms associated with “Western behavior” (DRD4) are associated with increased novelty-seeking, tendency for financial risk-taking, distance of OoA migration, and liberal ideology. Numerous different MAOA and 5-HTT polymorphisms are associated with collectivism (e.g., Way and Lieberman, 2006 for MAOA and collectivism). The polymorphism in COMT more likely to be found in Westerners predisposes for “worrier’s behavior”. Furthermore, certain polymorphisms of the CHRNB3 gene are more common in all of the populations that migrated out of Africa, which predisposed for leaders—and not follower—behavior.
| Trait | Gene | Allele frequency |
| Novelty seeking | DRD4 | 7-repeat novelty seeking allele more common in the West |
| Migration | DRD4 | 7-repeat allele is associated with distance from Africa migration |
| Nomads/settlers | DRD4 | 7-repeat allele is associated with nomadic life |
| Political ideology | DRD4 | 7-repeat allele is more common in liberals |
| Financial risk taking | DRD4 | 7-repeat allele is more common in risk takers |
| Individualism/Collectivism | HTT | s allele (collectivistic) of 5-HTT is more common in the East |
| Happiness | HTT | l allele has higher prevalence in individuals happy with their life |
| Individualism/Collectivism | MAOA | 3-repeat allele (collectivistic) more common in the East) |
| Warrior/Worrier | COMT | A-allele (worrier) more common in the West |
| Altruism | COMT | G-allele (warrior) associated with altruism |
| Leader/Follower | CHRBN3 | A-allele (leader) more common in populations Out-of-Africa |
The table above is from Kiaris (2012: 117) who lays out the genes/polymorphisms discussed in his book—what supposedly shows how and why Eastern and Western societies are so different.
Kiaris (2012: 141) then makes a bold claim: “Since we know now that at least a fraction (and likely more than that) of our behavior is due to our genes“, actually “we” don’t “know” this “now”.
The takeaways from the book are: (1) populations differ genetically; (2) since populations differ genetically, then genetic differences correlated with behavior should show frequency differences between populations; (3) since these populations show both behavioral/societal differences and they also differ in genetic polymorphisms which are then associated with that behavior, then those polymorphisms are, in part, a cause of that society and the behavior found in it; (4) therefore, differences in Eastern and Western societies are explained by (some) of these polymorphisms discussed.
Now for a simple rebuttal of the book:
“B iff G” (behavior B is possible if and only if a specific genotype G is instantiated) or “if G, then necessarily B” (genotype G is a sufficient cause for behavior B). Both claims are false; genes are neither a sufficient or necessary cause for any behavior. Genes are, of course, a necessary pre-condition for behavior, but they are not needed for a specific behavior to be instantiated; genes can be said to be difference makers (Sterelny and Kitcher, 1988) (but see Godfrey-Smith and Lewontin, 1993 for a response). These claims cannot be substantiated; therefore, the claims that “if G, then necessarily B” and “B iff G” are false, it cannot be shown that genes are difference makers in regard to behavior, nor can it be shown that particular genes or whatnot.
Conclusion
I’m surprised that I have not come across a book like this sooner; you would expect that there would be a lot more written on this. This book is short, it discusses some good resources, but the conclusions that Kiaris draws, in my opinion, will not come to pass because genes are not neccesary nor sufficient cause of any type of behavior, nor can it be shown that genes are causes of any behavior B. Behavioral differences between Eastern and Western societies, logically, cannot come down to differences in genes, since they are neither necessary nor sufficient causes of behavior (genes are neccessary pre-conditions for behavior, since without genes there is no organism, but genes cannot explain behavior).
Kiaris attempts to show how and why Eastern and Western societies became so different, how and why Western societies are dominated by “Aristotle’s reason and logic”, while Eastern lines of thought “has been dominated by Confucious’s harmony, collectivism, and context dependency” (Kiaris, 2012: 9). While the book is well-written and researched (he talks about nothing new if you’re familiar with the literature), Kiaris fails to prove his ultimate point: that differences in genetic polymorphisms between individuals in different societies explain how and why the societies in question are so different. Though, it is not logically possible for genes to be a necessary nor sufficient cause for any behavior. Kiaris talks like a determinist, since he says that “the presence of different genes in the corresponding people has actually dictated the acquisition of these distinct cultural and historical lines, and that an alternative outcome might be unlikely” (Kiaris, 2012: 9), though that is just wishful thinking: if we were able to start history over again, things would occur differently, “the presence of different genes in the corresponding people” be dammed, since genes do not cause behavior.
Racial Differences in Physical Functioning
1350 words
Assessing physical functioning is important. Such simple tests—such as walk, stand, and sit tests—can predict numerous things. “Testing” defines one’s abilities after being given a set of instructions. Racial differences exist and, of course, both genetic and environmental factors play a part in health disparities between ethnies in America. Minorities report lower levels of physical activity (PA) than whites, this—most often—leads to negative outcomes, but due to their (average) physiology, they can get away with doing “less” than other ethnies. In this article, I will look at studies which talk about racial differences in physical functioning, what it means, and what can be done about it.
Racial differences in physical functioning
Racial differences in self-rated health at similar levels of health exist (Spencer et al, 2009). Does being optimistic or pessimistic about health effect one’s outcomes? Using 2,929 HABC (Health, Aging, and Body Composition) participants, Spencer et al (2009) examined the relationship between self-rated health (SRH) and race, while controlling for demographic, psychosocial and physical health factors. They found that whites were 3.7 times more likely than blacks to report good SRH.
Elderly blacks were more likely to be less educated, reported lower satisfaction with social support, and also had lower scores on a physical battery test than whites. Further, black men and women were less likely to report that walking a quarter mile was “easy”, implying that (1) they have no endurance and (2) weak leg muscles.
Blacks were also more likely to report higher personal mastery:
Participants were asked whether they agreed or disagreed with the following statements: “ I often feel helpless in dealing with the problems of life ” and “ I can do just about anything I really set my mind to do, ” with response categories of disagree strongly, disagree somewhat, agree somewhat, and agree strongly. (Spencer et al, 2009: 90)
Blacks were also more likely to report higher BMI and more chronic health conditions than whites. White men, though, were more likely to report higher global pain, but were older than black men in the sample. When whites and blacks of similar physical functioning were compared, whites were more likely to report higher SRH. Health pessimists were found to be at higher risk of poor health.
Vazquez et al (2018) showed that ‘Hispanics’ were less likely to report having mobility limitations than whites and blacks even after adjustment for age, gender, and education. Blacks, compared to non-‘Hispanic’ whites were more likely to have limitations on activities of daily living (ADL) and instrumental activities of daily living (IADL) For ADL limitations, questions like “Do participant receive help or supervision with personal care such as bathing, dressing, or getting around the house because of an impairment or a physical or mental health problem?” and for IADLs “Does participant receive help or supervision using the telephone, paying bills, taking medications, preparing light meals, doing laundry, or going shopping?” (Vazquez et al, 2018: 4). They also discuss the so-called “Hispanic paradox” (which I discussed), but could not come to a conclusion on the data they acquired. Nonetheless, ‘Hispanic’ participants were less likely to report mobility issues; blacks were more likely than whites to report significant difficulties with normal activities of daily living.
Araujo et al (2010) devised a lower-extremities chair test: how quickly one can stand and sit in a chair; along with a walking test: the time it takes to walk 50 feet. Those who could not complete the chair test were given a score of ‘0’. Overall, the composite physical function (CPF) score for blacks was 3.45, for ‘Hispanics’ it was 3.66, and for whites, it was 4.30. This shows that older whites were stronger—in the devised tests—and that into older age whites are more likely to not need assistance for everyday activities.
This is important because differences in physical functioning between blacks and whites can explain differences in outcomes one year after having a stroke (Roth et al, 2018). This makes sense, knowing what we know about stroke, cognitive ability and exercise into old age.
Shih et al (2005) conclude:
a nationally representative study of the US population, indicate that among older adults with arthritis: (1) racial disparities found in rates of onset of ADL [activities of daily living] limitations are explained by differences in health needs, health behaviors, and economic resources; (2) there are race-specific differences in risk factors for the onset of ADL limitations; and (3) physical limitations are the most important risk factor for onset of ADL limitations in all racial and ethnic groups.
Safo (2012) showed that out of whites, blacks and “Hispanics”, blacks reported the most (low back) pain, worse role functioning score and overall physical functioning score. Lavernia et al (2011) also found that racial/ethnic minorities were more likely to report pain and have lower physical functioning after having a total knee arthroplasty (TKA) and total hip arthroplasty (THA). They found that blacks and ‘Hispanics’ were more likely to report pain, decreased well-being, and have a lower physical functioning score, which was magnified specifically in blacks. Blacks were more likely to report higher levels of pain than whites (Edwards et al, 2001; Campbell and Edwards, 2013), while Kim et al (2017) showed that blacks had lower pain tolerance and higher pain ratings. (Read Pain and Ethnicity by Ronald Wyatt.)
Sarcopenia is the loss of muscle tissue which is a natural part of the aging process. Sarcopenia—and sarcopenic obesity (obesity brought on by muscle loss due to aging)—shows racial/ethnic/gender differences, too. “Hispanics” were the most likely to have sarcopenia and sarcopenic obesity and blacks were least likely to acquire those two maladies (Du et al, 2018). They explain why sarcopenic obesity may be higher in ‘Hispanic’ populations:
One possibility to explain the higher rates of sarcopenia and SO in the Hispanic population could be the higher prevalence of poorly controlled chronic disease, particularly diabetes, and other health conditions.
[…]
We were surprised to find that Hispanic adults had higher rates of sarcopenia and SO [sarcopenic obesity]. One possible explanation could be the disparity in mortality rates among ethnic populations. Populations that have greater survival rates may live longer even with poorer health and thus have greater chance of developing sarcopenia. Alternatively, populations which have lower survival rates may not live long enough to develop sarcopenia and thus may identify with lower prevalence of sarcopenia. This explanation appears to be supported by the results of our study and current mortality statistics; NH Blacks have the highest mortality rate, followed by NH Whites, and lastly Hispanics.
Differences in physical activity could, of course, lead to differences in sarcopenic obesity. Physical activity leads to an increase in testosterone in lifelong sedentary men (Hayes et al, 2017), while those who had high physical activity compared to low physical activity were more likely to have high testosterone, which was not observed between the groups that were on a calorie-restricted diet (Kumagai et al, 2016). Kumagai et al (2018) also showed that vigorous physical exercise leads to increases in testosterone in obese men:
We demonstrated that a 12-week aerobic exercise intervention increased serum total testosterone, free testosterone, and bioavailable testosterone levels in overweight/obese men. We suggest that an increase in vigorous physical activity increased circulating testosterone levels in overweight/obese men.
(Though see Hawkins et al, 2008 who show that only SHGB and DHT increased with no increase in testosterone.)
So, clearly, since exercise can increase testosterone levels in obese subjects, and higher levels of testosterone are associated with lower levels of adipose tissue; since adequate levels of steroid hormones are needed for lower levels of adipose tissue (Mammi et al, 2012), then since exercise increases testosterone and higher levels of testosterone lead to lower levels of adipose tissue, if physical activity is increased, then levels of obesity and sarcopenic obesity should decrease in those populations.
Conclusion
Racial differences in physical functioning exist; these differences in physical functioning that exist have grave consequences for certain events, especially after a stroke. Differences in physical functioning/activity cause differences in sarcopenia/sarcopenic obesity in different ethnies. This can be ameliorated by targeting at-risk groups with certain outreach. This type of research shows how differences in lifestyle between ethnies cause differences in physical activity between ethnies as the years progress.
(Also read Evolving Human Nutrition: Implications for Public Health, specifically Chapter 8 on socioeconomic status and health disparities for more information on how and why differences like this persist between ethnies in America.)
Three Arguments for the Existence of Race: Establishing Population Groups as Races
2000 words
At least three arguments establish the existence and reality of biological race:
Argument (1) from Michael Hardimon’s (2017) book “Rethinking Race: The Case for Deflationary Realism” (The Argument for the Existence of Minimalist Races, see Chapters 2, 3, and 4):
The conditions of minimalist racehood are as follows:
(C1) … a group, is distinguished from other groups of human beings by patterns of visible physical features
(C2) [the] members are linked be a common ancestry peculiar to members of that group, and
(C3) [they] originate from a distinctive geographic location (Hardimon, 2017: 31).
This is the argument to prove the existence of minimalist races:
P1) There are differences in patterns of visible physical features which correspond to geographic ancestry
P2) These patterns are exhibited between real groups, existing groups (i.e., individuals who share common ancestry)
P3) These real, existing groups that exhibit these physical patterns by geographic ancestry satisfy the conditions of minimalist race
C) Therefore race exists and is a biological reality
Argument (2) from Michael Hardimon’s (2017) book “Rethinking Race: The Case for Deflationary Realism” (The Argument for the Existence of Populationist Races, see Chapters 5 and 6):
P1) The five populations demarcated by Rosenberg et al (2002) are populationist races; K = 5 demarcates populationist races.
P2) Populationist race=minimalist race.
P3) If populationist race=minimalist race, then everything from showing that minimalist races are a biological reality carries over to populationist races.
P4) Populationist races capture differences in genetic variation between continents and this genetic variation is responsible for the distinctive patterns of visible physical features which correspond to geographic ancestry who belong to biological lines of descent which were initiated by geographically isolated founding populations.
C) Therefore, since populationist races=minmalist races, and visible physical features which correspond to geographic ancestry are genetically transmitted by populations who belong to biological lines of descent, initiated by reproductively isolated founding populations, then populationist races exist and are biologically real.
Argument (3) from Quayshawn Spencer’s (2014) paper “A Radical Solution to the Race Problem” (The argument for the Existence of Blumenbachian Populations):
P1) The term “race” in America refers to biologically real entities; when speaking of race in America, Americans defer to the US Census Bureau who defers to the Office of Management and Budget (OMB).
P2) The OMB refers to race as “sets of” categories, while considering “races” to have 5 members, which correspond to the five major geographic regions.
P3) Rosenberg et al show that, at K = 5, meaningful, though small (~4.3 percent) genetic variation exists between continental-populations
C) Since Americans defer to the US Census Bureau who defers to the OMB, and the OMB refers to race as “sets of” categories which then correspond to five clusters found by Rosenberg et al’s (2002) analysis, race (what Spencer, 2014 terms “Blumenbachian populations”) must exist, though “race” is both socially constructed and biologically real.
Put another way, Spencer’s (2014) argument could also be:
P1) The US meaning of “race” is a referent, which refers to the discourse used by the US Census Bureau; the US Census Bureau refers to the discourse used by the Office of Management and Budget (OMB).
P2) The referent of “race”, in US ontology, refers to a set of human population groups, not a biological kind (sets of human population groups as denoted by the OMB), which refer to “Africans”, “Caucasians”, “East Asians”, “Native Americans”, and Pacific Islanders/Oceanians.
P3) The US meaning of race is both biologically real and socially constructed; Americans refer to real, existing groups when they talk about race.
C) If the US meaning of race is a referent which refers to the discourse used by the US Census Bureau and they refer to the OMB who discuss “sets of” population groups, then when Americans talk about race they talk about Blumenbachian partitions, since race is both biologically real and socially constructed.
The claim “Race exists” is now established. Note how Argument (1) establishes the claim that “races” are real, existing groups who are phenotypically distinct populations with differing geographic ancestry. Note how Argument (2) establishes the claim that populationist race = minimalist race and that “races” are a group of populations that exhibit a distinctive pattern of genetically transmitted phenotypic characters which then correspond to that group’s geographic ancestry who belong to a biological line of descent which was initiated by a geographically separated and reproductively isolated founding population. (This definition of “race” a subdivision of Homo sapiens is the best I’ve come across so far.) Finally, note how Argument (3) establishes the claim that race, in the American sense, is both biologically real and socially constructed. All three arguments are sound and logically valid.
Now, which groups fall into which of the five racial categories?
Caucasians
Caucasians denote a wide-range of groups; Europeans, MENA (Middle Eastern/North African) peoples, Indians are a very diverse group, racially speaking, with “Caucasoids”, “Mongoloids” and “Australoids” (Australoids would mean Pacific Islander/Oceanian) (see Kashyap et al, 2006 for an overview of ethnic, linguistic and geographic affiliations of Indians in the study). Ashkenazi Jews are taken to be a specific race in today’s modern racial ontology, however, Ashkenazi Jews do not exhibit a distinctive pattern of genetically transmitted phenotypic characters which then correspond to their geographic ancestry; they do represent a “geographically isolated and reproductively isolated founding population”, but the fact that they do not exhibit a distinctive pattern of genetically transmitted phenotypic characters means they are not a race, according to Arguments (1) and (2). Ashkenazi Jews are Caucasian, and not their own race. Of course, skin color does not denote race, it is only one marker to use to infer which groups are races.
Africans
Africans comprise all of Sub-Saharan Africa. Africa has the most genetic diversity in the human species (see Campbell and Tishkoff, 2010). Africans, in general, have long, slim bodies with a broad nose, dark skin, kinky hair (lip size is different based on the ethny in question). There are over 3,000 different ethnic groups in Africa, who all comprise the same race. Now, since Africans have the most genetic diversity this does not necessarily mean that they are so phenotypically distinct that there are tens, hundreds, thousands of races on the continent. One only needs to refer back to Arguments (1) and (2) to see that brash claims that “all Xs are Ys” don’t make any sense—especially with the arguments laid out above.
East Asians
East Asians denote a minimalist and populationist race (Arguments (1) and (2)) and Blumenbachian partition (Argument (3)). East Asians denote, obviously, those that derive from East Asia (Chinese, Japanese, Koreans, Vietnamese). These peoples are relatively short, on average, have a distinct yellow-ish tint to their skin (which is why they are sometimes called “yellow”), epicanthic folds and shorter limbs (more likely to have the endomorphic phenotype).
Native Americans
Native Americans are derived from a Siberian population that crossed the Bering Land Bridge about 14kya. They then spread throughout the Americas, becoming the “Natives” we know today. They are what used to be termed “red” people, due to their skin color. Native Americans are derived from Siberians, who share affinities with East Asians. (This will be discussed in further depth below.) They have black hair, and dark-ish skin. Populations that lived in the Americans pre-1492 expansion are part of the Native American racial grouping.
Pacific Islanders/Oceanians
The last racial grouping are Pacific Islanders. Spencer (2014: 1032) writes that we can define Oceanians (Pacific Islanders):
as the most inclusive human population born from East Asians in Oceania (Sahul and the Pacific Islands) and from the original human inhabitants of Oceania. Since Sahul was a single landmass composed of present-day Australia, New Guinea, and Tasmania 50,000–60,000 years ago, when humans first inhabited it, and since we know that the original human inhabitants of Oceania interbred to create modern Oceanians, and since temporal parts of populations are genealogically connected, it should be the case that most Oceanians have genealogical connections to the original peoples of some Pacific island. The only Oceanians who will not will be individuals who became Oceanian from interbreeding alone and Oceanians descended from indigenous peoples of Sahul but not indigenous peoples of a Pacific island (e.g., Aboriginal Australians). The final source of evidence comes from counterfactual cases. [Pacific Islanders and Australian Aborigines share a deep ancestry, see McEvoy et al, 2010.]
A group is in race X, if and only if they share a pattern of visible physical features and common geographic ancestry. If they do not share a pattern of visible physical features which correspond to common geographic ancestry then they do not constitute a race. Keep this in mind for the next two sections.
Are Oceanians black?
One claim that gets tossed around a lot (by black nationalists) is the claim that Oceanians are black due to their skin color, certain phenotypic traits. But this could just as easily be explained by convergent evolution, not that they are, necessarily, the same racial grouping. If this were true, then Australian Aborigines would be black, by proxy, since Australian Aborigines and Oceanian are the same race. The claim, though, holds no water. Just because two groups “look similar” (which I do not see), it does not follow that they are the same race, since other conditions need to be met in order to establish the claim that two separate groups belong to the same race.
Are Native Americans Mongoloid?
Lastly is the claim that Native Americans do not denote an actual racial grouping, they are either Mongoloid or a sub-race of Mongoloids.
Many authors throughout history have presumed that Native Americans were Mongoloid. Franz Boas, for example, said that the Maya Indians were Mongoloid, and that, American populations had features the most similar to Mongoloids, so they are thusly Mongoloid. Wikipedia has a great overview of the history of the “Mongoloid” terminology, with examples from authors throughout history. But that is irrelevant. Native Americans genetically transmit heritable phenotypic characters which correspond with their geographic ancestry and are genetically and geographically isolated population groups.
Although the claim that “Native Americans are Mongoloid” has been echoed for hundreds of years, a simple argument can be erected to take care of the claim:
P1) If Native Americans were East Asian/Mongoloid, then they would look East Asian/Mongoloid.
P2) Native Americans don’t look East Asian/Mongoloid, they have a distinct phenotype which corresponds to their geographic ancestry (See Hardimon’s minimalist/populationist race concepts).
C) Therefore, Native Americans are not East Asian/Mongoloid.
Establishing the claim that Native Americans are not East Asian/Mongoloid is simple. Some authors may make the claim that since they look similar (whatever that means, they don’t look similar to me), that they, therefore according to Arguments (1) and (2) they are a separate race and not a sub-race of East Asians/Mongoloids; Argument (3) further establishes the claim that they are a separate race on the basis that they form a distinct cluster in clustering analyses (Rosenberg et al, 2002) and since, Americans defer to the US Census Beureau and the US Census Beureau defers to the OMB who discusses sets of populations, then when Americans talk about race they talk about Native Americans as separate from East Asians/Mongoloids, since, according to Arguments (1) and (2) they have a distinct phenotype.
Generally, they have distinct skin colors (of course, skin color does not equal race, but it is a big tell), they have similar black, straight hair. But they are, in my opinion, just too phenotypically distinct to call them the same race as Mongoloids/East Asians. For the claim “Native Americans and Mongoloids/East Asians” to be true, they would need to satisfy P1 in Argument (1) and P4 in Argument (2). Native Americans do not satisfy P1 in Argument (1) nor do they satisfy P4 in Argument (2). Therefore, Native Americans are not Mongoloid/East Asian.
Conclusion
The claim “Race exists and is a biological reality” is clearly established by three sound, valid arguments—two from Hardimon (2017; chapters 2-6) and one from Spencer (2014). These arguments show, using the latest of genetic clustering studies, that races, as classicly defined, do indeed, exist and that our old views of race hundreds of years ago were, largely, correct. These arguments establish the existence of the old folk-racial categories. Races have distinct phenotypes which are genetically transmitted and are correlated with geographic ancestry. Some may make certain claims that “Oceanians are black” or “Native Americans are Mongoloid”, but these claims do not hold. These two groups in question are phenotypically distinct, and they come from unique geographic locations, therefore they are not a part of the races that some purport them to be.
The Black-White Bench Press Study
2200 words
Blacks vs whites: which race is stronger? Unfortunately, actual studies on actual strength lifts between races are few and far between (and if there are any comparisons between races it’s on an ancillary movement such as quadricep extension; for example see Goodpaster et al 2006). There is, though, one study comparing whites and blacks on a major lift: the bench press. The paper is littered with many problems, most of which make me not able to take the paper seriously. I’ve written about this paper in the past but this article will be much more comprehensive.
When searching for racial comparisons in physical strength, Boyce et al (2014) is one of the only papers one would come across looking at racial differences in strength in one specific (main) lift. The authors used a longitudinal design: they had the police officers’ bench press numbers during their first week on the force and then had data 12.5 years later to assess racial and gender differences in the bench press. They assessed strength scores on the bench press, bench press/lean mass, as well as bench press/body mass.
The assessed 327 police officers: 30 women (13 black, 17 white) and 297 males (41 black and 238 white). Officers that could not be classified as either white or black were removed from the sample. Average number of years between the test at recruitment and later into their career was 12.5 years +/- 2 years while the mean age at the initial recruitment was 26.4 years +/- 3.4 years. The officers were mostly college-educated and were low-middle to upper-middle class.
When the recruits were considered for the job, they had their body mass, percent body fat (with skinfold calipers, which will be covered below) and did a 1RM (one-rep max) on the bench press to assess physical strength. The physical fitness battery (for incoming officers) was as follows (in order): body fat, sit-and-reach flexibility (to see how flexible one is in their lower body/hamstrings), 1RM bench press, and finally a 1.5-mile run. For in-service officers, they had their body fat tested, a treadmill test, bench press, muscular endurance (either curls or sit-ups; curls are a contraindicative exercise if used with a straight bar while sit-ups are contraindicative since they put unneeded strain on the lower back).
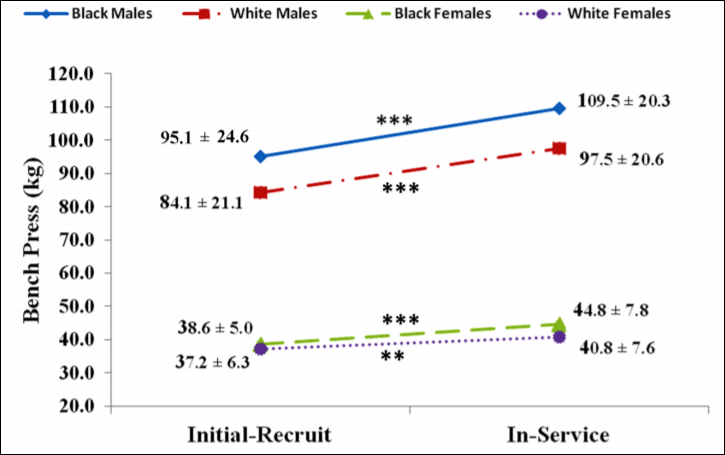
All groups, when combined after 12.5 years, had significant mean gains in strength which were accompanied by gains in body mass, percent fat mass, and lean mass. Black men, at initial recruitment, weighed 187 pounds and benched 210 pounds; white men weighed 180 pounds and benched 185 pounds. Black men benched 1.12 times their body weight whereas white men benched 1.027 times their body weight. At the follow-up assessment, black males weighed 223 pounds and benched 240 pounds. White males weighed 205 pounds and benched 215 pounds. Black males benched 1.07 times their body weight whereas white males benched 1.05 times their body weight. (To find out what percentage of body weight one lifts, take weight lifted and divide it by the weight of the individual.)
Black women, on the other hand at initial recruitment, weighed 130 pounds and benched 85 pounds whereas white women weighed 127 pounds and benched 82 pounds. Black women benched .653 times their body weight whereas white women benched .645 times their body weight. At the follow-up assessment, black women weighed 151 pounds and benched 98 pounds whereas white women weighed 141 pounds and benched 90 pounds. Black women benched .649 times their body weight at the follow-up whereas white women benched .638 times their body weight.
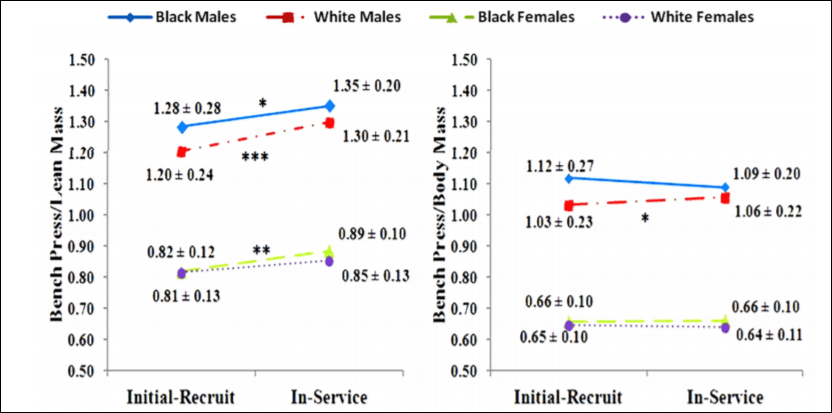
So there was no real difference between black and white female recruits/officers but there was a difference between black and white male recruits/officers. Of course, due to higher levels of testosterone and other hormones compared to women, the males had a changed much more significantly from the initial recruitment. Figures 1 and 2 from Boyce et al (2014: 146) are important too:
Since the study was done over 12.5 years and the individuals were in their mid-20s at initial recruitment, then this study is anomalous since the individuals gained strength and lean mass well into their 30s. Testosterone begins to decrease starting at age 25, though it is not a foregone conclusion that this occurs; age-related declines in testosterone are not inevitable. It just seems that this is the case since, around one’s mid-20s, life changes happen (marriage, kids) which then may cause lifestyle changes (weight gain and the onset of depression). Most of the testosterone decline can be explained by smoking, obesity, depression and other health factors (Shi et al, 2013). So if these officers had good nutrition—and I do not see why they did not—then they can, in effect, bypass most of the so-called age-related declines in testosterone (which is also related to marriage, having children and obesity; Gray, 2011; Pollet, Cobey, and van der Meij, 2013; Mazur et al, 2013).
Gains in lean mass are related to gains in strength, and so, since there was considerable body mass gain and, consequently, lean mass gain, then overall bench pressing strength should have pretty much substantially increased. The strength gains, though, were negated when they divided the weight lifted by the weight of the lifters (pound-for-pound strength, which is what matters more). Black males had the greatest body mass gain over the 12.5 year period, which subsequently corresponded to a decrease in strength on the bench press.
Over the 12.5 year period, black males gained 36 pounds whereas white males gained 25 pounds. Although black males gained more weight over the 12.5 year period—and loss on bench press/body mass—blacks were still very slightly stronger than whites (1.07 compared to 1.05) which is not significant. Black and white females, on the other hand, had no real differences in any of the scores that Boyce et al (2014) did. Furthermore, black and white women, in this study, had similar strength gains and body mass/lean mass gains. Of course, this is a self-selected sample: black women are consistently noted to carry more fat mass than white women (see Rahman et al, 2009).
Both black and white males increased in the bench press throughout the 12.5 year period compared to black and white females, which is due to them being men (higher levels of testosterone and other hormones, larger muscle cross-section area; Miller et al, 1993). The groups who were stronger when they were hired remained the strongest at the follow-up. So, Boyce et al (2014) conclude, the bench press is able to be used as an assessor of upper-body strength since blacks actually, according to their study, are stronger than whites so, therefore, “an upper body strength test such as a bench press will have little adverse impact on blacks, a racially protected group” (Boyce et al, 2014: 148). Though, for women, since they are not as physically strong as men, this will have an “adverse impact on female recruit and incumbent officers, a gender protected group, no matter if they are black or white” (Boyce et al, 2014: 148).
Now time for a few pitfalls (one of which is not the fault of the investigators): height was not assessed; skin-fold calipers were used to assess body fat; and a Smith machine bench press was used.
Height: Due to an ongoing investigation on the Charlotte Mecklenburg Police Department (for apparently discriminating against certain recruits on the basis of height), the height of the officers at recruitment and the follow-up were not noted. This is a problem. If height were known (along with a few more anthropometric variables), then we can infer who had the somatotype that is conducive to bench pressing. In lieu of no height data, we cannot infer this. It is easier for people with shorter limbs to bench press, since the bar has a shorter path to travel, compared to people with longer arms who have to move the weight a further distance. Blacks are more likely to have longer arms and, as I have argued, this would impede them in strength when bench pressing and overhead pressing but will help in the deadlift since they have longer arms and a shorter torso, it is easier for people with this soma to deadlift due to their body proportions.
Skin-fold calipers: Body fat was assessed using skin-fold calipers. Blacks have thinner skin folds than whites, and so since they have thinner skin folds than whites, and the formula for assessing body fat from skin-folds is based on whites, then, it has been argued, that black males need their own BMI scale since they have thinner skin folds and differing levels of fat-free body mass (Vickery, Cureton, and Collins, 1988; Wagner and Heyward, 2000). So since the levels of body fat were off for blacks, then Boyce et al’s (2014) bench press/lean mass is useless since body fat was not assessed correctly. (I know that using calipers is cheaper and easier than sending everyone for a DXA scan, but the difference in body composition between blacks and whites should be known so that, at least when it comes to fat comparisons between different races, bad methods don’t get used and parroted.) Since there are well-known differences in skinfolds as they relate to body fat percentage/lean mass regarding blacks and whites, it’s, again, safe to toss out that part of the study (regarding weight moved/lean mass), since there are huge flaws in regard to assessing body fat through use of conventional measures in blacks compared to whites.
Smith machine bench press: This is, perhaps, one of the most important pitfalls. I can think of a few reasons why this machine was used: (1) you don’t really need to teach someone how to get into proper position to grab the bar. (2) the bar is on a set path, and so people with different anthropometric measures may be uncomfortable while using the machine (which would then affect overall strength). (3) Saeterbakken, Tillaar, and Fimland (2011) assessed three different chest press exercises: the Smith machine bench press, the barbell bench press, and the dumbbell bench press. Those in the study had the highest 1RM on the bench press, followed by the Smith machine and finally were the weakest on dumbbell bench press. The biceps brachii is used for stabilization, and they found that EMG activity in the biceps brachii increased with stability requirements (dumbbell > barbell > Smith). This is due to the fact that, on the two exercises that are not assisted, the muscles need to stabilize the free weight. Since you’re using more muscles to stabilize the weight, then, theoretically, you can move more weight. EMG activity was the same regarding the pectoralis major and anterior deltoids but was different in the triceps and biceps brachii. The prime movers (agonists) of the bench press are the anterior deltoids, triceps, and pecs/serratus. Therefore, the antagonists are the posterior deltoids, the biceps, and the lats/rhomboids.
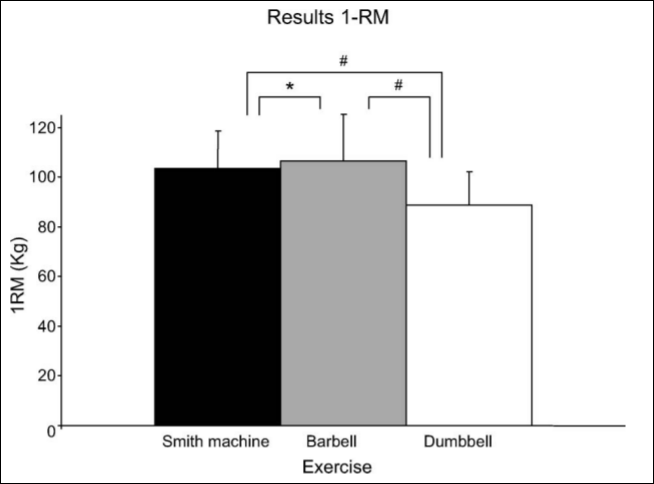
The load lifted on the bench press was three percent higher than on the Smith machine. Since stability requirements are low with the Smith, and the bar is on a set path that cannot be changed, then, theoretically, one should be able to move more weight on the Smith machine (which is my personal experience and the experience of many people I have worked with) compared to the dumbbell and regular bench press. Though, the load lifted on the bench press was about three percent higher than on the Smith machine bench press. The activity of the pectoralis and the anterior deltoid was lower on the eccentric phase (think the negative portion of the lift) when compared to dumbbell and barbell pressing, which is, again, explained by lack of stabilizing muscles used on the Smith machine bench press. So this small study (n=12) shows that there are differences in 1RM between the three lifts studied and that there are differences in the neuromuscular activity of the flexor/extensor muscles of the arm, but showing no difference in the prime movers of the lift (such as the pectoralis major). In the descending phase of the lift, there was less EMG activation, which indicates that a greater neural drive is needed for the eccentric phase of the lift.
The Smith machine used in Boyce et al (2014) was an Atlantis Angled Smith Machine E-155, which I have used personally (and have had hundreds of people use). In my personal experience, weight moved on the Smith is considerably different when compared to a regular bench press, due to the fact that one does not have to stabilize the bar with certain muscles. I will keep an eye out for more Smith machine/bench press/dumbbell press studies in the future, but, from personal experience, one is able to lift more on a Smith than a regular bench.
Conclusion
This is one of the only studies of its kind: assessing racial differences in strength on a major lift. Boyce et al (2014) found that, although blacks had a sharper decrease in pound-for-pound strength, they still kept their slight strength advantage over the 12.5 year period. Both black and white women had similar strength levels and gains in strength and lean mass over the 12.5 year period. Lean mass gain over the period was related to strength gains on the bench; but, as pointed out, they did not correctly assess lean mass for blacks, since calipers (used to test skin folds) are not useful for blacks in the case of figuring out lean mass/body fat levels (Vickery et al, 1988; Wagner and Heyward, 2000).
This study is useless to me. Blacks are not stronger than whites; anthropometric variables play a huge role in strength differences and, due to these differences, blacks are not stronger than whites on certain lifts, as I have documented.
Race, Body Fat, and Skin Folds
1250 words
Racial differences in body fat are clear to the naked eye: black women are more likely to carry more body fat than white women; Mexican American women are more likely to carry more body fat than white women, too. Different races/ethnies/genders of these races/ethnies have different formulas to assess body fat through the use of skin-folds. The sites to grasp the skin is different based on gender and race.
Body mass index (BMI) and waist circumference is overestimated in blacks, which means that they need different formulas to assess their BMI and adiposity/lean mass. Race-specific formulas/methods are needed to assess body fat and, along with it, disease risk, since blacks are more likely to be obese (black women, at least, it’s different with black American men with more African ancestry, see below). The fact of the matter is, when matched on a slew of variables, blacks had lower total and abdominal fat mass than whites.
This is even noted in Asian, black and white prepubertal children. He et al (2002) show that sex differences in body fat distribution are present in children who have yet to reach puberty and the differences in body fat in Asians is different than that from blacks and whites which also varies by sex. Asian girls had greater gynoid fat by DXA scan only, with girls having greater gynoid fat than boys. Asian girls had lower adjusted extremity fat and gynoid fat compared to white and black girls. Though, Asian boys had a lower adjusted extremity by fat as shown by DXA (a gold standard in body fat measurement) when compared to whites, but greater gynoid fat than whites and blacks.
Vickery, Cureton, and Collins, (1988), Wagner and Heyward (2000), and Robson, Bazin, and Soderstrom (1971) show that there are considerable body composition differences between blacks and whites. These differences in body composition come down to diet, of course, but there is also a genetic/physiologic component there as well. Combining the known fact that skin-fold testing is not conducive to a good estimate, black American men with more African ancestry are less likely to be obese.
Vickery, Cureton, and Collins (1988) argue that, if accurate estimates of body fat percentages are to be obtained, race-specific formulas need to be developed and used as independent variables to assess racial differences in body fat percentage. Differences in muscularity don’t seem to account for these skinfold differences, nor does greater mesomorphy. One possible explanation for differences in skinfold thickness is that blacks may store most of their body fat subcutaneously. (See Wagner and Heyward, 2000 for a review on fat patterning and body composition in blacks and whites.)
The often-used Durnin-Womersley formula which is used to predict body fat just from skin folds. However, “The 1974 DW equations did not predict %BF(DXA) uniformly in all races or ethnicities” (Davidson et al, 2011). Truesdale et al (2016) even show that numerous formulas used to estimate percent body fat are flawed, even some formulas used on different races. Most of the equations tested showed starkly different conclusions. But, this is based on NHANES data and the only data they provide regarding skin-folds is the tricep and subscapular skinfold so there may still be more problems with all of the equations used to assess body fat percentage between races. (Also see Cooper, 2010.)
Klimentidis et al (2016) show that black men—but not black women—seem to be protected against obesity and central adiposity (fat gain around the midsection) and that race negatively correlated with adiposity. The combo of male gender and West African ancestry predicted low levels of adiposity compared to black Americans with less African ancestry. Furthermore, since black men and women have—theoretically—the same SES, then cultural/social factors would not play as large a role as genetic factors in explaining the differences in adiposity between black men and black women. Black men with more African ancestry had a lower WHR and less central adiposity than black men with less African ancestry. If we assume that they had similar levels of SES and lived in similar neighborhoods, there is only one reason why this would be the case.
Klimentidis et al (2016) write:
One interpretation is that AAs are exposed to environmental and/or cultural factors that predispose them to greater obesity than EAs. Possibly, some of the genes that are inherited as part of their West-African ancestry are protective against obesity, thereby “canceling out” the obesifying effects of environment/culture, but only in men. Another interpretation is that genetic protection is afforded to all individuals of African descent, but this protection is overwhelmed by cultural and/or other factors in women.
Black men do, as is popularly believed, prefer bigger women over smaller women. For example, Freedman et al (2004) showed that black American men were more likely to prefer bigger women. Black American men “are more willing to idealize a woman
of a heavier body size, with more curves, than do their White American counterparts” (Freedman et al, 2004: 197). It is then hypothesized that black American men find these figures attractive (figures with “more curves” (Freedman et al, 2004: 197)) to protect against eating pathologies, such as anorexia and bulimia. So, it has been established that black men have thinner skin folds than whites which leads to skewed lean mass/body fat readings and black men with more African ancestry are less likely to be obese. These average differences between races, of course, contribute to differing disease acquisition.
I have covered differences in body fat in a few Asian ethnies and have come to the obvious conclusion: Asians, at the same height, weight etc as whites and blacks, will have more adipose tissue on their bodies. They, too, like blacks and whites, have different areas that need to be assessed for skin folds to estimate body fat.
Henriques (2016: 29) has a table on the equations for calculating estimated body density from skin fold measures from various populations. Of interest are the ones on blacks or ‘Hispanics‘, blacks or athletes and blacks and whites. (The table is provided from NSCA, 2008 so the references are not in the back of the text.)
For black and ‘Hispanic’ women aged 18-55 years, the sites to use for skin-folds are the chest, abdomen, triceps, subscapular, suprailiac, midaxillary, and the thigh. For blacks or athletes aged 18-61 years, the sites to use are the same as before (but a different equation is used for body fat estimation). For white women or anorexic women aged 18-55, the sites used are just triceps, suprailiac and the thigh. For black and white boys aged 6-17, only the triceps and the calf is used. It is the same for black and white girls, but, again, a different formula is used to assess body fat (Henriques, 2016: 29).
Morrison et al (2012) showed that white girls had a higher percent body fat when compared to black girls at ages 9-12 but every age after, black girls had higher percent body fat (which is related to earlier menarche in black girls since they have higher levels of body fat which means earlier puberty; Kaplowitz, 2008). Black girls, though, had higher levels of fat in their subscapular skin folds than white girls at all ages.
So, it seems, there are population-/race-specific formulas that need to be created to better assess body fat percentage in different races/ethnies and not assume that one formula/way of assessing body fat should be used for all racial/ethnic groups. According to the literature (some reviewed here and in Wagner and Heyward, 2000), these types of formulas are sorely needed to better assess health markers in certain populations. These differences in body fat percentage and distribution then have real health consequences for the races/ethnies in question.
Just-so Stories: FOXP2
1200 words
FOXP2 is a so-called “gene for” language. The gene is a transcription factor—meaning that it controls the activity of other genes. Thus, changes to FOXP2 will have changes to other genes as well. Thus, the evolution of language in humans was thought to have hinged on mutations on the FOXP2 gene. Humans that have a single-point mutation in FOXP2 “have impaired speech and grammer, but not impaired language comprehension” (Mason, et al, 2018: 403). This gene is found in numerous mammals (e.g., chimpanzees, gorillas, orangutans, rhesus macaques, and mice) but none of those mammals speak. This gene, then, is expressed in the areas of the brain that affects motor functioning, which includes the coordination needed to create words.
Mice and humans at the FOXP2 gene only differ by 3 amino acids. Only one amino acid difference exists between gorillas, chimps, mice, and macaques, who all have identical amino acid sequences on FOXP2. Furthermore, two more amino acid sequences differ between humans and the sequences which is shared by chimpanzees, gorillas, and macaques. Thus, the difference of two amino acids between humans and other primates appears to have made it possible for language to evolve. Evidence exists for strong selective pressures for the two FOXP2 mutations which allow the brain, larynx, and mouth to coordinate to produce speech. These two altered amino acids may change the ability of FOXP2 transcription factor to be phosphorylated—proteins are either activated by phosphorylation or deactivated by dephosphorylation, or the reverse.
Mason et al (2018: 403) write:
Comparative genomics efforts are now extending beyond primates. A role for FOXP2 in songbird singing and vocal learning has been proposed. Mice communicate via squeaks, with lost young mice emitting high-pitched squeaks, FOXP2 mutations leave mice squeakless. For mice and songbirds, it is a stretch to claim that FOXP2 is a language gene—but it is likely needed in the neuromuscular pathway to make sounds.
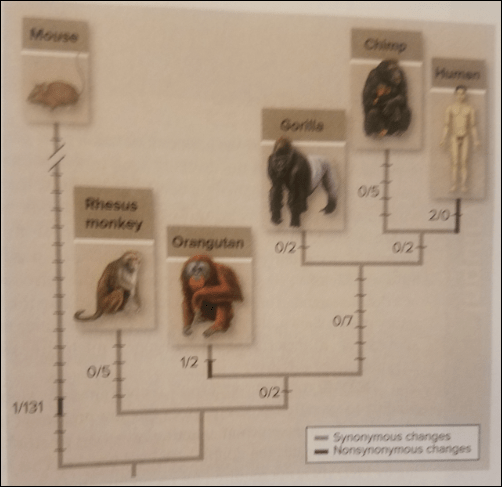
Above is Figure 18.17 from Mason et al (2018: 403). They write:
Comparisons of synonymous and nonsynonymous changes in mouse and primate FOXP2 genes indicate that changing two amino acids in the gene corresponds to the emergence of human language. Black bars represent synonymous changes; gray bars represent nonsynymous changes.
But is that the whole story? Is FOXP2 really a “gene for” language? New results call this hypothesis into question.
In their paper No Evidence for Recent Selection at FOXP2 among Diverse Human Populations, Atkinson et al (2018) did not find evidence for recent positive or balancing selection. Atksinson et al (2018) conclude that they:
do not find evidence that the FOXP2 locus or any previously implicated site within FOXP2 is associated with recent positive selection in humans. Specifically, we demonstrate that there is no evidence that the original two amino-acid substitutions were targeted by a recent sweep limited to modern humans <200 kya as suggested by Enard et al. (2002) … Any modified function of the ROI does not appear to be related to language, however, as modern southern African populations tolerate high minor allele frequencies with no apparent consequences to language faculty. We do not dispute the extensive functional evidence supporting FOXP2’s important role in the neurological processes related to language production (Lai et al., 2001, MacDermot et al., 2005, Torres-Ruiz et al., 2016). However, we show that recent natural selection in the ancestral Homo sapiens population cannot be attributed to the FOXP2 locus and thus Homo sapiens’ development of spoken language.
So the two mutations in exon 7 of FOXP2 weren’t selected and are not responsible for human language. Most likely the accelerated rate is due to loss of function (LoF) (null allele).
The gene was originally discovered in a family that had a history of speech and language disorders (Lai et al, 2001). This “speech gene” was also found in Neanderthals in 2007 (see Krasue et al, 2007). Thus, the modifications to FOXP2 occurred before humans and Neanderthals diverged.
So Atkinson et al (2018) found that the so-called sweep on FOXP2 >200KYA was a statistical artifact which was caused by lumping Africans together Caucasians and other populations. Of course, language is complicated and no one single gene will explain the emergence of human language.
This is a just-so story—that is, an ad hoc hypothesis. Humans had X, others didn’t have X or had a different form of X; therefore X explains human language faculties.
Atkinson et al’s (2018) “results represent a substantial revision to the adaptive history of FOXP2, a gene regarded as vital to human evolution.”
High evolutionary constraint among taxa but variability within Homo sapiens is compatible with a modified functional role for this locus in humans, such as a recent loss of function.
…
Therefore, this SNP must not be necessary for language function as both alleles persist at high frequency in modern human populations. Though perhaps obvious, it is important to note that there is no evidence of differences in language ability across human populations. (Atkinson et al, 2018)
This is another just-so story (Gould and Lewontin, 1976; Lloyd, 1999; Richardson, 2007; Nielsen, 2009) that seems to have bitten the dust. Of course, the functionality of FOXP2 and its role in the neurologic processes related to language; what is disputed (and refuted) is the selectionist just-so story. Selectionist explanations are necessarily ad-hoc. Thus, recent natural selection in our species cannot be attributed to FOXP2, and along with it, our language capabilities.
There is a similar objection, not for FOXP2 and selectionist hypotheses, but for the Lactase gene. Nielsen (2009) puts it succinctly:
The difference in lactose intolerance among human geographic groups, is caused by a difference in allele frequencies in and around the lactase gene (Harvey et al. 1998; Hollox et al. 2001; Enattah et al. 2002; Poulter et al. 2003). … This argument is not erected to dispute the adaptive story regarding the lactase gene, the total evidence in favor of adaptation and selection related to lactose tolerance is overwhelming in this case, but rather to argue that the combination of a functional effect and selection does not demonstrate that selection acted on the specific trait in question. … Although the presence of selection acting on genes underlying a phenotypic trait of interest does help support adaptive stories, it does not establish that selection acted directly on the specific trait of interest.
Even if there were evidence of positive selection of FOXP2 in humans, we cannot logically state that selection acted on the FOXP2 locus; functional effects and selection do not demonstrate that “selection” acted on that trait. Just-so stories (ad hoc hypotheses) “sound good”, but that’s only because they are necessarily true—one can have all the data they want, then they can think up any adaptive story to explain the data and the story will be necessarily true. Therefore, selectionist hypotheses are inherently ad hoc.
In conclusion, another selectionist hypothesis bites the dust. Nevermind the fact that, if FOXP2 were supposedly “selected-for”, there would still be the problem of free-riders (Fodor and Piattelli-Palmarini, 2010). That is, “selection” cannot “select-for” fitness-enhancing traits if/when they are coextensive with other traits—there is no way for selection to distinguish between coextensive traits and thus, it does not explain trait fixation (in this case, the fixation of FOXP2). Ad-hoc hypotheses are necessarily true—that is, they explain the data they purport to explain and only the data they purport to explain. These new results show that there is no support for positive selection at the FOXP2 locus.
Natural Selection is not an Explanatory Mechanism
2450 words
Darwin proposed, back in 1859, that species arose due to natural selection—the pruning of deleterious genetic variations in a population, which led to the thinking that the “inherent design” in nature, formerly thought to be due to a designer (“God”) was due to a force Darwin called “natural selection” (NS). The line of reasoning is thus: (1) two individuals of the same population are mostly the same genetically/phenotypically, but have small differences between them, and one of the small differences is a difference in a trait needed for survival. (2) But both traits can contribute to fitness, how does NS ‘know’ to select for either coextensive trait? Now think about two traits: trait T and trait T’. What would explain the fixation of either trait in the population we are discussing? NS is not—cannot—be the mechanism of evolution.
In 2010, philosopher Jerry Fodor and cognitive scientist Massimo Piattelli-Palmarini, wrote a book titled “What Darwin Got Wrong“, which argued that NS is not a causal mechanism in regard to the formation of new species. Their argument is (pg 114):
- Selection-for is a causal process.
- Actual causal relations aren’t sensitive to counterfactual states of affairs: if it wasn’t the case that A, then the fact that it’s being A would have caused its being B doesn’t explain its being the case that B.
- But the distinction between traits that are selected-for and their free-riders turns on the truth (or falsity) of relevant counterfactuals.
- So if T and T’ are coextensive, selection cannot distinguish the case in which T free-rides on T’ from the case that T’ free-rides on T.
- So the claim that selection is the mechanism of evolution cannot be true.
This argument is incredibly strong. If it is true, then NS cannot be the mechanism by which evolution occurs; NS is not—nor can it be—the mechanism of evolution. So, regarding the case of two traits that are coextensive with each other, it’s not possible to ascertain which trait was selected-for and which trait was the free-rider. NS cannot distinguish between two locally coextensive traits, so, therefore, it is not an explanatory mechanism and does not explain the evolution of species, contra Darwin. It cannot be the mechanism that connects phenotypic variation with fitness variation.
The general adaptationist argument is: “(1) the claim that evolution is a process in which creatures with adaptive traits are selected and (2) the claim that evolution is a process in which creatures are selected for their adaptive traits” (Fodor and Piattelli-Palmarini, 2010: 13). Darwinists are committed to inferring (2) from (1), though it is fallacious. It is known as the intensional fallacy.
“Due to the intensionality of “select-for” and “trait”, one cannot infer from ‘Xs have trait t and Xs were selected’ to ‘Xs were selected for having trait t’” (Fodor and Piattelli-Palmarini, 2010: 139). How does one distinguish from a trait that was selected-for and a free-rider that hitched a ride on the truly adaptive trait for the organism in question? The argument provided above shows that it is not possible. “Darwinists have a crux about free-riding because they haven’t noticed the intensionality of selection-for and the like; and when it is brought to their attention, they haven’t the slightest idea what to do about it” (Fodor and Piattelli-Palmarini, 2010: 16).
No observation can show whether or not trait T or T’ was selected-for in virtue of its contribution to fitness in a given population; favoring one story over another in regard to the adaptation of a trait in question, therefore, does not make any logical sense due to the problem of free-riders (and, also, favoring one story over another is due to bias for the like of the specific adaptive just-so story in question). For if two traits are coextensive—meaning that traits coincide with one another—then how can NS—which does not have a mind—‘know’ to “select-for” whichever trait contributes to fitness in the population in question? Breeders are the perfect example.
Breeders have minds and can therefore select for certain traits and against undesirable traits; however, of course, since NS does not have a mind, this is not the case when it comes to naturally selected traits (so-called), since NS does not have a mind. NS cannot explain the distribution of phenotypic traits throughout the world; there is no agent of NS nor are there ‘laws of selection’, therefore NS is not an explanatory mechanism. Explanations based on NS are based only on correlations with traits and fitness, not on causes themselves (this critique can be extended to numerous other fields, too). The problem with relying only on correlations between traits and fitness is two-fold: (1) the trait in question can be irrelevant to fitness and (2) the trait in question can be a free-rider.
Creatures have traits that increase fitness because they were selected-for, the story goes. NS explains why the creature in question has trait T, which increases fitness in environment E. One can then also make the claim that the selection of the trait in question was due to the increased fitness it gave the creature. However, if this claim is made, “then the theory of natural selection would reduce to a trait’s being a cause of reproductive success [which then] explains its being a cause of reproductive success which explains nothing (and isn’t true).”
So since genetically-linked traits are coextensive with an infinitude of different possible outcomes, then the hypothesis that trait X is an adaptation is underdetermined by all possible observations, which means that NS cannot explain how and why organisms have the traits they do, since NS cannot distinguish between two coextensive traits, since NS lacks a mind and agency.
NS can be said to be an explanation if and only if two conditions are met: (1) if NS can be understood as acting on counterfactuals and (2) if NS can be said to be acting on any physical evolutionary laws.
(1) A counterfactual is an “if-clause”, which is contrary to a fact. A counterfactual is a statement that cannot be true, for example, “I hear but I have no ears” or “I see but I have no eyes.” Thus, if it were possible for NS to be an explanation for the continuance of a specific trait that is linked to other traits (that is, they are coextensive) in a given population, it would need to—necessarily—invoke a counterfactual about NS. It would need to be the case that the trait in question would still be selected for in the absence of free-riders. As an example from Fodor and Piattelli-Palmarini (2010: 103) a heart pumps blood (what it was selected-for) and makes pumping sounds (its linked free-rider). Thus, if the pumping of blood and the sound that blood-pumping makes were not coextensive, then the pumping, not the pumping sounds, get selected for.
There is a huge problem, though. Counterfactuals are intentional statements; they refer to concepts found in our minds, not any physical things. NS does not have a mind and thus lacks the ability to “select-for” since “selecting-for” is intentional. Therefore NS does not act on counterfactuals; it is blind to the fact of counterfactuals since it does not have a mind.
(2) It does not seem likely that there are “laws of selection”. Clearly, the adaptive value of any phenotype depends on the environment that the organism is in. Fodor and Piattelli-Palmarini (2010: 149) write (emphasis theirs):
The problem is that it’s unlikely that there are laws of selection. Suppose that P1 and P2 are coextensive but that, whereas the former is a property that affects fitness, the latter is merely a correlate of a property that does. The suggestion is that all this comes out right if the relation between P1 and fitness is lawful, and the relation between P2 and fitness is not. …it’s just not plausible that there are laws that relate phenotypic traits per se to fitness. What (if any) effect a trait has on fitness depends on what kind of phenotype is embedded in, and what ecology the creature that has the trait inhabits. This is to say that, if you wish to explain the effects that a phenotypic trait has on a creature’s fitness, what you need is not its history of selection but its natural history. And natural history offers not laws of selection but narrative accounts of causal chains that lead to the fixation of phenotypic traits. Although laws support counterfactuals, natural histories do not; and, as we’ve repeatedly remarked, it’s counterfactual support on which distinguishing the arches from the spandrels depends.
There is, too, a simple example regarding coextensive traits and selection. Think of the lactase gene. It is well-known that we humans are adapted to drink milk—and the cause is gene-culture coevolution that occurred at around the time of cow domestication (Beja-Perreira et al, 2003; Gerbalt et al, 2011). No one disputes the fact that gene-culture coevolution is how and why we can drink milk. But what people do dispute is the adaptive just-so story (Gould and Lewontin, 1976; Lloyd, 1999; Richardson, 2007) that was made to explain how and why the trait went to fixation in certain human populations. Nielsen (2009) writes (emphasis mine):
The difference in lactose intolerance among human geographic groups, is caused by a difference in allele frequencies in and around the lactase gene (Harvey et al. 1998; Hollox et al. 2001; Enattah et al. 2002; Poulter et al. 2003). The cause for the difference in allele frequencies is primarily natural selection emerging about the same time as dairy farming evolved culturally (Bersaglieri et al. 2004). Together, these observations lead to a compelling adaptive story of natural selection favoring alleles causing lactose tolerance. But even in this case we have not directly shown that the cause for the selection is differential survival due to an ability/inability to digest lactose. We must acknowledge that there could have been other factors, unknown to us, causing the selection acting on the region around the Lactase gene. Even if we can argue that selection acted on a specific mutation, and functionally that this mutation has a certain effect on the ability to digest lactose, we cannot, strictly speaking, exclude the possibility that selection acted on some other pleiotropic effect of the mutation. This argument is not erected to dispute the adaptive story regarding the lactase gene, the total evidence in favor of adaptation and selection related to lactose tolerance is overwhelming in this case, but rather to argue that the combination of a functional effect and selection does not demonstrate that selection acted on the specific trait in question.
Selection could have acted on a free-rider that is coextensive with the lactase gene, and just because “the story fits the data” well (that’s a necessary truth; of course the story can fit the data because any story can be formulated for any data) does not mean that it is true, that the reason for trait T is reason R since they “fit the data so well.”
Of course, this holds for EP, evolutionary anthropology, and my favorite theory for the evolution of human skin color, the vitamin D hypothesis. I do not, of course, deny that light skin is needed in order to synthesize vitamin D in climates with low UVB; that is a truism. What is denied is the fact that selection acted on light skin (and its associated/causal genes); what is denied is the combination of functional effect and selection. Just-so stories are necessarily true; they, of course, fit any data because one can formulate any story to fit any data points they have. Thus, Darwinists are just storytellers who have a bunch of data; there is no way to distinguish between the selection of a trait because it increased fitness and the selection of a free-rider that is “just there” that does not increase fitness, but the thing that increases fitness is what the free-rider “rode in on.”
NS is not and cannot be an explanatory mechanism. Darwinism has already been falsified (Jablonka and Lamb, 2005; Noble, 2011; Noble, 2012; Noble, 2017) and so, this is yet another nail-in-the-coffin for Darwinism. The fact that traits that are coextensive means that NS would have to “know” which trait to act on; NS cannot “know” which of the coextensive traits to act on (because it has no mind) and, NS cannot be a general mechanism that connects phenotypic variation to variation in fitness. NS does not explain the evolution of species, nor can NS distinguish between two locally coextensive traits—traits T and T’—because NS has no agency and does not have a mind. Therefore NS is not an explanatory mechanism. Just invoking NS to explain the continuance of any trait fails to explain the survival of the trait because NS cannot distinguish between traits that enhance an organism’s fitness and free-riders which are irrelevant to survival but are coextensive with the selected-for trait, as long as the traits in question are coextensive.
P1) If there is selection for T but not T’, various counterfactuals must be true.
P2) If the counterfactuals are true, then NS must be an intentional-agent, or there must be laws about “selection-for”.
P3) NS is mindless.
P4) There are no laws for “selection-for”.
∴ It is false that selection for T but not T’ occurs in a population.
One then has two choices:
(1) Argue that NS has a mind and therefore that it can “select for” certain traits that are adaptable in a given population of organisms in the environment in question. “Select-for” implies intention. Intentional acts only occur in organisms with minds. Intentional states are only possible if something has a mind. Humans are the only organisms with minds. Humans are the only organisms that can act intentionally. NS does not have a mind. (Animal breeder’s are an example that can select-for desirable traits and against undesirable traits because animals breeder’s are humans and humans can act intentionally.) Therefore NS does not act intentionally since it does not have a mind. I don’t think anyone would argue that NS has a mind and acts intentionally as an agent, therefore P3 is true.
(2) Argue that there are laws for “selection-for” phenotypic traits related to fitness. But it’s not possible that there are laws that relate to the selection of a phenotype, per se, in a given population. The effect of a trait depends on the ecology of the organism in question as well as its natural history. Therefore, to understand the effects of a phenotypic trait on the fitness of an organism we must understand its natural history, not its selection history (so-called). Therefore P4 is true.
There are no laws for “selection-for”, nor does NS have a mind that can select a trait that lends to an organism’s fitness and not a trait that’s just correlated with the trait in question
