
Home » Posts tagged 'muscle fibers'
Tag Archives: muscle fibers
‘Double-Muscled’ Humans?
1800 words
I’ve been reading bodybuilding magazines for almost ten years. Good science articles on training and diet, but there was always one ad in the magazines that I always saw: the leg and calf of a neonate and then that same neonate at 7 months. The kid was brolic. Defined calves with absolutely no training. What was the cause? Well, he had a deletion on the myostatin gene— also called growth-differentiating factor 8, GDF-8. The ads in the magazines would try to get you to buy some shitty supplement that did not work, but the kid? The kid is real and he had a deletion on the gene that codes for a protein that myostatin. Myostatin restrains muscle growth, normally, which ensures that muscles don’t grow too large. Myo means muscle, while statin means heart. This can be a huge breakthrough regarding muscular dystrophy (Smith and Lin, 2013). Myostatin seems to have two roles: 1) regulating the number of muscle fibers formed in development and 2) to regulate the growth of muscle fibers postnatally.
When it is deleted, in cattle, it causes “double-muscle” cattle—cattle that have about 20 percent more muscle mass than cattle who don’t have the deletion (Grobert et al, 1997; Amthor et al, 2007). The cause is skeletal-muscle hyperplasia, which causes an increase in the number of muscle fibers, not only an increase in diameter. This is what causes these crazy-looking animals. Myostatin is coded by the MSTN gene. So they discovered that the gene caused double-muscled cattle. It should also be noted that while mice who lack myostatin are more muscular than average, they have impaired force generation (Amthor et al, 2007)
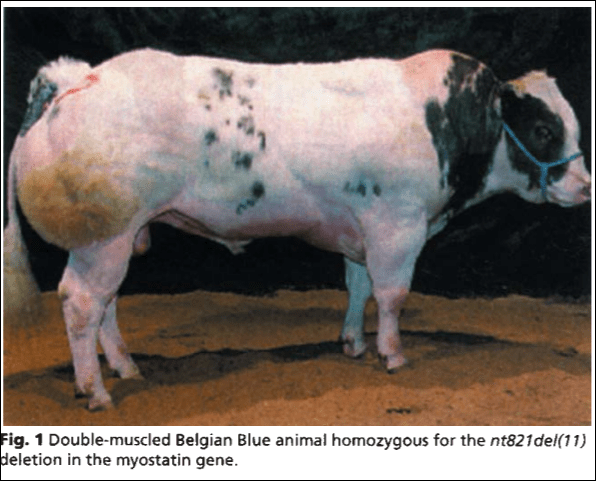
From Grobet et al, 1997; a double-muscle Belgian Blue homozygous for a deletion in the myostatin gene
The same thing is seen in mice—mice with a myostatin deletion are stronger and bigger (muscle) than mice without the myostatin deletion; myostatin, in adult mice, is expressed in all muscle tissue but more specifically in fast twitch muscle fibers (Whittemore et al, 2002). Se-Jin Lee is the one to discover the myostatin gene, and for his work he was elected the to the National Academy of Sciences in 2012 (Glass and Spiegelman, 2012). Mice that lack myostatin have, on average, double the muscle compared to mice who have myostatin. However, Lee (2007) proved that mice who lack myostatin and who overproduce follistatin (which is capable of blocking myostatin activity in muscle cells). Lee (2007) writes:
Moreover, the rank order of magnitude of these increases correlated with the rank order of expression levels of the transgene; in the highest-expressing line, Z116A [Z116a is one of Lee’s four transgenic mouse lines], muscle weights were increased by 57–81% in females and 87–116% in males compared to wild type mice. Hence, FLRG is capable of increasing muscle growth in a dose-dependent manner when expressed as a transgene in skeletal muscle.
So Lee (2007) discovered that the effect of FLRG is additive. He then attempted to determine whether or not the FLRG gene was truly causing increased muscle growth by blocking myostatin activity, so he examined the effect of combining the FLRG transgene with a knocked-out myostatin gene. He was not able to find this relationship in Z116A—i.e. being positive for the FLRG transgene and homozygous for myostatin—but he did discover that females from the Z166A strain were heterozygous for the myostatin deletion, having further increases in muscle weights combined with wild-type mice with ‘normal’ myostatin.
Most importantly, in two of the muscles that were examined (quadriceps and gastrocnemius) the observed increases were also greater than those seen in Mstn−/− mice lacking the transgene. Based on this finding, it appears that myostatin cannot be the sole target for FLRG in the transgenic mice and, therefore, that additional ligands must be capable of suppressing muscle growth in vivo.
Then Lee examined the effects of follistatin in MSTN null mice. He found that the presence of the F66 transgene in MSTN null mice, which caused another doubling in muscle. Lee had bred mice with quadruple muscle. Like FLRG, follistatin exerts its effects on other ligands, along with myostatin, so the effect of blocking still other ligands is also comparable to that loss-of-function from the myostatin.
So there are two important take-aways here with this landmark study: 1) the loss-of-function mutation on the Mstn gene exerts a maternal effect; muscle mass in the fetus is determined by the number of functional Mstn alleles (the offspring had higher muscle weights if the mother had fewer functioning Mstn alleles even if the offspring had the same genotype); and 2) Lee showed that other ligands worked with myostatin to control muscle growth. Both FLRG and follistatin can promote muscle growth when they are transgenes in skeletal muscle. So when he combined follistatin transgene and myostatin null mutation deletions, he had bred mice with qaudruple muscle.
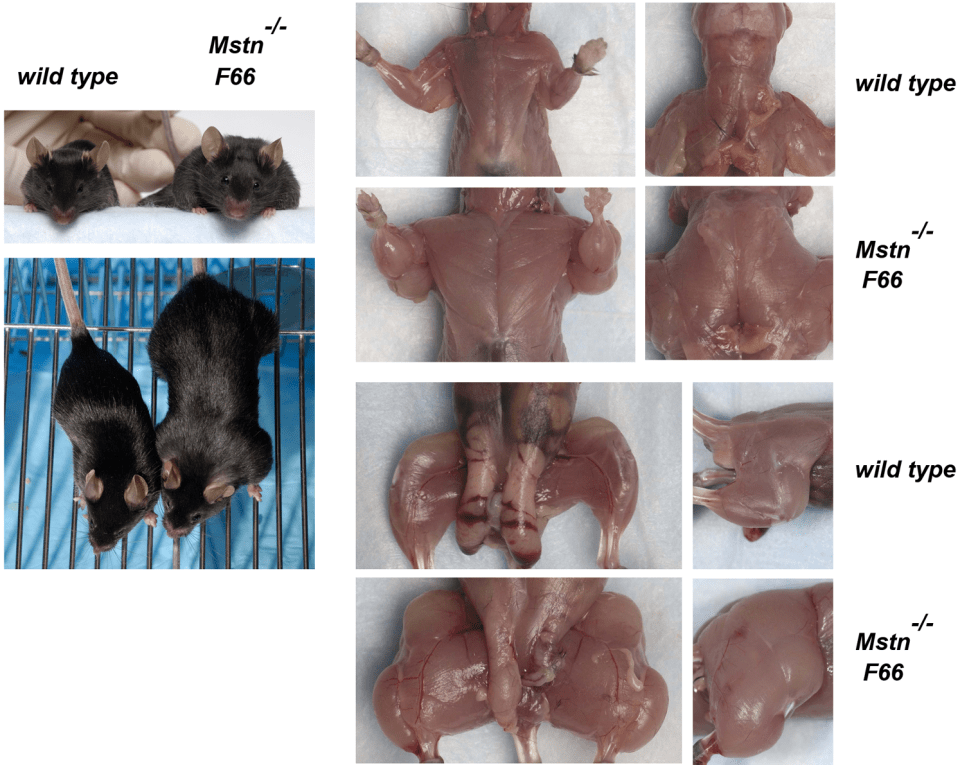
These mice are huge. And it’s only due simply to a loss-of-function mutation along with the myostatin-binding protein follistatin that causes mice with quadruple muscle. Myostatin regulates muscle growth. So if myostatin regulates muscle growth, then a deletion on the gene that codes for the protein that codes for myostatin to regulate muscle growth should causes increases in size and strength in animals with this null myostatin deletion.
In his 2014 book, David Epstein writes about how Lee attempted to find him subjects for human testing, so he put an ad in muscle magazines such as Muscle and Fitness and Muscular Development. Over 150 people answered his ad, but he had found no myostatin mutants.
This was until 2003, when he got a phone call of a babe who was born with bulging muscles, in Germany. He had mutations on both of his myostatin genes, therefore he had no myostatin in his blood. This baby’s mother (called “Superbaby”) had one normal myostatin gene and one mutant so she had more myostatin than her son but less than the general population. She is the only adult with a known myostatin deletion, and she just so happens to be a professional sprinter.
Before I discuss Superbaby, I need to discuss myostatin and its role in development. Myostatin plays the same role in birds, cattle, mice, humans, etc. Muscle is costly, energetically speaking, and if one is too muscular they may not be able to find enough food to sustain their higher-than-average muscle mass, so myostatin is kind of like the body’s ‘fail-safe’ to prevent one’s muscles from becoming too big. Of course larger muscles require more calories—and of course protein for muscle-building—and so, it wouldn’t make sense, for instance, for our ancestors to have huge bulging muscles since they ate intermittently. So myostatin helps us stay smaller than we would be than if we had the null mutation.
One of the incredible things about Superbaby is that he had no heart problems, although doctors were worried that he would (like his heart growing out of control), but him nor his mother have reported any problems. Epstein (2014: 105) writes:
But the facts that the one boy with two of the rare myostatin gene variants has exceptional strength, and that his mother has exceptional speed, are no coincidence. Superbaby and his mother fall precisely in line with whippets.
Epstein describes how two whippets, one with one copy of the myostatin gene, have four puppies and how the mutation would go to the offspring (kind of like a Punnet square):
If two sprinter whippets—dogs that each have one copy of the myostatin mutation—have four puppies, this is the likely scenario: one puppy will have zero copies of the mutation and be normal; two puppies will have one copy of the mutation, like Superbaby’s mother, and be sprinters; the fourth pippy will have two copies of the mutation, like Superbaby, which make for a double-muscled “bully” whippet.
Schuelke et al’s (2004) case report is one of the first-known cases of the myostatin mutation in humans. The pregnancy was normal, and when he was born, Superbaby had protruding calves (see Fig. 1: a below; left is as a 6-day-old neonate and the right is 7 months), along with his upper arms too. The ultrasonograms of his muscles were also different from controls as was the morphometric analysis (Fig. 1 b and c respectively). All around, Superbaby was normal; but by age 3 he still had increased muscle mass/strength and could even hold 3 kg dumbells in suspension, horizontally with his arms extended. He had some strong family members, one was a construction worker who was able to unload curbstones by hand, while the mother “appeared muscular” but not as muscular as her son (see Fig. 1 d).
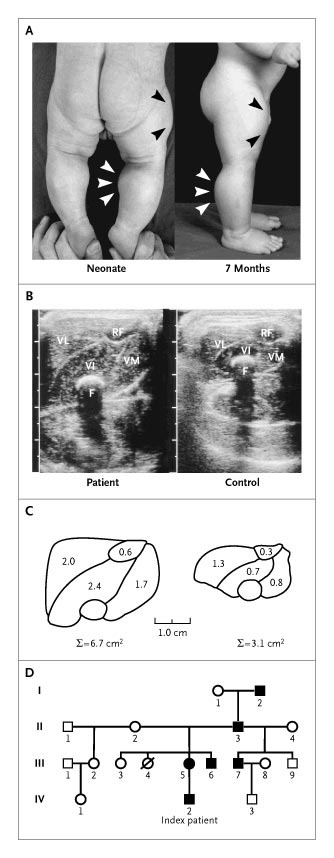
Myostatin is also expressed in the heart, and since Superbaby had a loss-of-function mutation on his myostatin gene, he was monitored for cardiomyopathy but he may have been too young to detect any defects. So Schuelke et al’s (2004) obvious conclusion was that a loss-of-function on the myostatin gene could increase muscle bulk and strength and be good therapy for people with a muscle-wasting disease.
One deletion in the MSTN gene can cause myostatin-related hypertrophy. One mutation disrupts how the gene that codes for the protein to make MSTN and therefore muscle cells. So when this occurs the cells make little to no functional myostatin. When one protein is lost, it leads to an overgrowth of muscle cells, with no other apparent medical problems (which is also seen in Superbaby and his mother).
If that were my son, I’d be a proud father. My baby coming out of the womb already jacked and strong? He’d immediately be in the gym as soon as he was able to and I would attempt to mold him into a champion bodybuilder/powerlifter; I’m not sure if the mutation that Superbaby has would truly matter at the elite level in the IFBB, but it would matter in the amateur level. Superbaby—and all of the other loss-of-function myostatin animal mutants—have paved the way for new forms of gene therapy for humans who have a muscle-wasting disease. Another American boy also had the same mutation as Superbaby. (Though the cause is different in this child, his body produces a normal level of myostatin, a defect in his myostatin receptors is thought to prevent his muscle cells from responding to myostatin, and since he’s bigger and stronger than children his age, this is a sensible hypothesis.)
With these loss-of-function mutants along with other transgenes, we can understand how and why muscles atrophy and grow, and we can help people with serious disease. Superbaby is not 14 years old, and while I am unable to find any new information on Superbaby (I will write something else on this if and when I do), it’s clear that a loss-of-function on the myostatin gene causes higher amounts of muscle mass and strength when people with the mutation are compared to people without the mutation. I’d personally line up turn off my myostatin gene, so I can get double-muscled and if there is any gene therapy for follistatin, I’d get that, too, in order to become quadruple-muscled.
Malaria, the Sickle Cell Trait, and Fast Twitch Muscle Fibers
2550 words
West Africans and their descendants have longer limbs and a shorter trunk than Europeans, on average—as I have extensively noted. Due to where they evolved, of course, they have a different morphology and physiology. Bergmann’s rule states that peoples with recent ancestry in the tropics will have slimmer pelvic bones and be narrower overall whereas Allen’s rule states that peoples with recent ancestry in the tropics will have long limbs, these traits being good for heat dissipation (Lieberman, 2015) and is one reason why West Africans and their descendants excel in these most sports in America.
The fact that a lot of African ethnic groups have different anatomic proportions and physiologic adaptations in comparison to people who have evolved in non-tropical climates is not contested. Morrison and Cooper’s (2006) hypothesis on sick cell anemia driving elite athletic performance in West Africans and their descendants is one of the most interesting explanations I’ve heard on the biochemical differences between the races. Sickle cell anemia is caused by a gene mutation. On amino acid 6, a single nucleotide substitution from A to T (As pair it Ts, Gs pair with Cs). This substitution changes a glutamic acid codon to valine codon which then causes sickling of the blood. Sickle cell anemia, of course, is not a ‘black disease’ as is popularly believed, but it, in fact, has to do with geography and the prevalence of malaria-carrying mosquitoes in that location. “This mutation“, Morrison and Cooper (2006) write “appears to have triggered a series of physiological adjustments, which have had favourable athletic consequences.”
Now, I’m aware that those who are already skeptical of this hypothesis may say ‘so does this mean that Italians, Greeks, MENA peoples etc have more type II fibers and would excel in these competitions?’, no it does not mean that because they don’t have the requisite morphology that West Africans have.
In the 1970s, a study was carried out on the physiological and anatomical proportions of Olympic athletes who competed in the 1968 Olympic games. Anatomic and physiologic measures were taken for each athlete. They used four racial classifications: Negroid, Caucasoid, Mongoloid, and mestizo (Indian/Spanish mix). The classifications were based on “were based on identification and somatotype photographs, as well as physical characteristics including skin color; general body shape; proportions of segments of the limbs; facial structure; form of eyes, lips, and nose; and colour and texture of hair” (Morrison and Cooper, 2006). This study, of course, also confirmed the anatomic differences between blacks and other races and how it leads to superior sports performance. Though, something peculiar was noted in the black athletes. Morrison and Cooper (2006) write: “Although the study failed to link athletic capability to a single gene system, the authors expressed “surprise” that “a sizeable number of Negroid Olympic athletes manifested the sickle-cell trait.””
One interesting study looked at the sickle cell trait (SCT) in French West Indian elite sprint athletes (Marlin et al, 2005). Using the French National Team for the year 2000, Marlin et al (2005) identified 3 sprinters (2 males and 1 female) who tested positive for the SCT. They also noticed a significantly higher presence of titles for people who tested positive for the SCT (38.6 percent for males and 50 percent for females. Marlin et al (2005: 624) conclude “that male SCT carriers are able to perform sprints and brief exercises at the highest levels” and “that brief and intensive exercise performance involving mainly alactic anaerobic metabolism may be enhanced by HbS in elite male sprinters.”
Blacks had narrower hips, longer arms and legs and a shorter trunk in comparison to other races. Of course, somatype is the variable that matters here but certain races are more likely to have certain anatomic characters that lead to superior spots performance on comparison to other races. The authors also attempted to link traits with single gene networks but were unsuccessful. However, they did notice that a large number of black athletes tested positive for the sickle cell trait. There is a conundrum here, however. People with the sickle cell gene might have a greater oxygen demand which causes more in vivo cell sickling. It was hypothesized that these individuals would be at a disadvantage since the 1968 Olympic games were held in Mexico city which is a high altitude area. They theorized that their blood would sickle more at the high altitude in comparison to low altitude but this was not seen.
Then another study was carried out which showed that not only do individuals with the sickle cell trait have lower hemoglobin levels, but all blacks do (Garn, Smith, and Clark, 1975). This is how and why they can perform at high altitudes despite having the sickle cell trait. Then, to test if this was mostly ‘environmental’ or ‘genetic’ they undertook a large study where they followed individuals throughout their whole lives and the difference persisted even later in life. Of course, according to other authors, some sort of compensatory mechanism should exist to counteract black’s lower hemoglobin levels, since this deficiency even exists in athletes (Morrison and Cooper, 2006).
As I’ve written about in the past, it was established that type I and type II fibers use different metabolic pathways and that type II fibers lead to improved athletic performance (along with the certain genotype for the ACTN3 gene). Morrison and Cooper (2006) also state that, of course, not all West Africans and descendants have this trait, and that these people came from a small area of West Africa.
A study looking at pulmonary differences between blacks and whites was conducted which found that blacks compensated for smaller lungs by breathing harder than whites while engaged in physical activity. In a study of 80 Asians and Europeans, Korotzer, Ong, and Hansen (2000) also showed that Asians had lower pulmonary functioning than Europeans. Even differences in chest size has been purported to explain differences in lung functioning, though this relationship did not hold (Whittaker, Sutton, and Beardsmore, 2005). Though, in his short review on race and the history of lung functioning, Braun (2015) writes that “At the very least, the idea that people labelled ‘white’ naturally have higher lung capacity than other races throughout the world should be approached with some skepticism.” because “Most commercially available spirometers internationally ‘correct’ or ‘adjust’ for race in one of two ways: by using a scaling factor for all people not considered to be ‘white’; or by applying population-specific norms. To enable the spirometer, the operator must select the race of an individual, as well as indicate their age, sex/gender and height. How race (or population) is determined varies, with most operators either asking patients to self-identify or ‘eyeballing it’. Interviews with users of the spirometer indicate that many operators are unaware that they are automatically activating race correction when they select a patient’s race (3). Because ‘correction’ is programmed into the spirometer by the manufacturer, it can be difficult to disable.”
Braun, Wolfgang, and Dickerson (2013) and Braun (2015) critiques pulmonary studies because in a large majority of cases, possible explanatory variables for lower lung functioning in black Americans could be related to SES. Harik-Khan, Muller, and Wise (2004) used participants from the Third National Health and Nutrition Examination Survey. They chose black and white children between the ages of 8 and 17 who did not smoke (n=1462, 623 whites and 839 blacks). Blacks were taller but had lower SES, had lower levels of vitamins A and C, along with lower levels of alpha carotene. They also had lower lung functioning. When they adjusted for confounds, sitting explained 42 to 53 percent of the racial difference, SES factors and antioxidant vitamin levels accounted for 7 to 10 percent of the difference. So they could only account for 50 to 63 percent of the difference. In 752 children aged 8 to 10 years of age, low birth weight accounted for 3 to 5 percent of the differences whereas maternal smoking had no effect (Harik-Khan, Muller, and Wise, 2004). So the remaining variation, obviously, will be accounted for by other SES variables, biology, or environmental factors.
Whitrow and Harding (2004) show that, at least for Caribbean blacks living in the UK, upper body differences explained most of the variation in lung functioning than did sitting height, with social correlates having a small but significant impact.
So because blacks have more type II fibers on average, they will convert glucose into energy more rapidly than whites. The energy for these muscle contractions comes from adenosine triphosphate (ATP). Blacks and whites both convert glucose into ATP for cellular functioning but in different ratios. These differences in muscular contractions driven by the metabolic pathway differences of the fibers are one large reason why blacks dominate sports.
Fibers are broken down into two types: fast and slow twitch. Slow twitch fibers use aerobic metabolism which is how they generate ATP and greater oxidative capacity due to higher levels for myoglobin. Oxygen bound to hemoglobin is carried to the red blood cells through capillaries that then influence muscular performance. Myoglobin is also essential for the transport of oxygen to the mitochondria where it is then consumed. Conversely, fast twitch fibers use anaerobic metabolism, have less oxidative capacity, less myoglobin and due to this, they are more dependent on anaerobic metabolism. Blacks also have “significantly higher levels of activity in their phosphagenic, glycolytic, and lactate dehydrogenase marbling pathways than their Caucasian counterparts” (Morrison and Cooper, 2006). This is where the production of ATP is regenerated,and so they have a huge advantage here. So higher faster production of ATP lead to more efficient ATP production, too. However when the ATP is depleted then it’s replaced by a reaction that depletes creatine phosphate. Skeletal muscle then converts “chemical energy into mechanical work” which only 30 to 50 percent is wasted as heat, so even small physiological differences can lead to large differences in performance (Morris and Cooper, 2006).
Though that’s not the only biochemical difference (faster ATP regeneration and production) between the blacks and whites that would explain sports performance. Morrison and Cooper (2006) write: “There is also considerably greater activity in the lactate dehydrogenase pathway of people of West African descent. A primary function of this pathway is to reduce muscle fatigue by converting lactic acid back to glucose and refeeding the muscles. This cyclic set of reactions, from muscles to liver and back to muscles, is known as the Cori cycle.”
Lactic acid production is that feeling in your muscles when during extended athletic activity whereas the postponement of muscle fatigue rests on the rate at which lactic acid is covered into glucose. The rate of this removal is further increased by the lactate dehydrogenase pathway describe above by Morrison and Cooper.
Clearly, the production of lactic acid causes problems during physical activity. The production of lactic acid into glucose to refers the muscles through the lactate dehydrogenase pathway is critical, for if glycogen reserves are depleted during extended physical activity then blood glucose would become the primary source of energy for the muscles, which could lead to lowered blood glucose levels and the nervous system may become compromised. During prolonged activity, however, if glucose isn’t available for energy then the body uses fat reserves which is less efficient than carbohydrates for energy and combustion.
Morrison and Cooper conclude: “Not the least of coincidence seems to be the influence of the compensatory sickle cell gene on oxygen transport and availability to the tissues. The reduced availability pulled with reduced oxygen myoglobin in the preponderant fast-twitch muscle fibres which are adapted for rapid anaerobic energy (ATP) regeneration, all give a new outcome of muscle anatomical and biochemical advantages which proffer a superior athleticism.”
Though, at the moment, as David Epstein states in his 2014 book The Sports Gene: Inside the Science of Extraordinary Athletic Performance, in a few studies done on mice genetically altered to have low hemoglobin levels, a there was a “shift of type IIa fast-twitch muscle fibers to type IIb “super fast twitch” muscle fibers in their lower legs” (Epstein, 2014: 179). This is also a developmental effect of mice in their lifetime, not a direct effect of evolution (Epstein, 2014: 179). No compensatory mechanism yet exists for humans, which I will attempt to untangle in future articles on the matter.
At the end of the chapter on this subject (Chapter 11, Malaria and Muscle Fibers, page 179), Epstein states that he asked physiologists their thoughts on the hypothesis. A few people approved of it, whereas one stated that he had evidence for physiological differences between blacks and whites that have not been studied before but he won’t release his results:
Several scientists I spoke to about the theory insisted they woud have no interest in investigating it because of the inevitably thorny issue of race involved. On of them told me that he actually has data on ethnic differences with respect to a particular physiological trait, but that he would never publish the data because of potential controversy. Another told me he would worry about following Cooper and Morrison’s line of inquiry because any suggestion of a physical advantage among a group of people could be equated to a corresponding lack of intellect, as if athleticism and intelligence were on some kind of biological teeter-totter. With that stigman in mind, perhaps the most important writing Cooper did in Black Superman [Cooper’s book] was his methodical eviseceration of any supposed inverse link between physical and mental prowess. “The concept that physical superiority could somehow be a symptomn of intellectual inferiority only developed when physical superiority became associated with African Americans,” Cooper wrote. “That association did not begin until about 1936.” The idea that athleticism was suddenly inversely proportional to intellect was never a cause of bigotry, but rather a result of it. And Cooper implied a more serious scientific inquiry into difficult issues, not less, is the appropriate path. (Epstein, 2014: 179) [Entine (2002) also spends a considerable amount of time debunking the myth of intelligence and athletic ability being negatively correlated in his 2002 book Taboo: Why Black Athletes Dominate Sports and Why We’re Afraid to Talk About It, which was kind of popularized by Rushton (1997) with his now debunked r/K selection theory.]
Things like this piss me off. These differences are actually measurable and lead to trait differences between the races, and know the mechanisms, pathways and whatnot and people are still. Scared to share their findings. One day, I hope, science will find a way to disregard people’s feelings in regard to people’s feelings on notable, testable and replicable differences between the races, most importantly between blacks and whites. I’ve noted how type II fibers lead to metabolic changes and small tears which then cause big problems. This is due to how fast the type II fibers fire in comparison to the slow twitch fibers.
This hypothesis is extremely interesting and now that I’ve laid out Morrison and Cooper’s (2006) hypothesis, I’m going to take a deep dive into this literature to see what I can prove about this hypothesis. Of course, the somatype along with the fiber distribution matters, as does having the XX genotype and not RR, which lends to superior athletic performance when coupled with type II muscle fibers (Broos et al, 2016). The pieces of this puzzle are, in my opinion, slowly being put together for someone to come along and integrate them into a coherent theory for the sickle cell trait and superior athletic performance through type II muscle fibers. It’s very interesting to note that elite sprinters were more likely to carry the SCT and that champion sprinters were more likely to have it too.
Why Do Jamaicans, Kenyans, and Ethiopians Dominate Running Competitions?
2050 words
Much has been written about the genotypic and phenotypic differences in Jamaicans, Kenyans, and Ethiopians. Why do they dominate these competitions? Is it cultural? Genetic? Does training matter more? Grit? Expertise? There are multiple reasons that they have such an advantage, the most important one being their morphology/somatype. Of course other physiologic and morphologic factors come into play for these three populations, but the greatest physical advantage they have is their somatype which lends itself to running—whether short, medium or long distance.
Back in July, I argued that the wide-hipped Neanderthals were stronger than the recently migrated Homo sapiens, due mostly to pelvic anatomy (along with Neanderthal protein intake). That’s one of the keys to explaining African dominance in running: their long slender bodies with high limb ratios.
Kenyans and Ethiopians
Kenyan distance running is driven by an ethny named the Kalenjin, particularly of the Nandi tribe. Much research has been undertaken on the physiology and morphology of certain subpopulations of Kenyans, with a complex genotype, phenotype, and even SES interaction driving the dominance of this subpopulation (Tucker, Onywera, and Santos-Concejero, 2015). Another important factor is their low BMI. Kenyans have the lowest BMIs in the world at 21.5, which considerably helps in regards to distance running (Radovanovic et al, 2014; Shete, Bute, and Deshmukh, 2014; Sedeaud et al, 2015).
Kenyans—like Jamaicans and Ethiopians—dominate these competitions due to a complex interaction between genes, environment and SES (Tucker, Onywera, and Santos-Concejero, 2015). Though, of course, a lot of what makes certain Kenyan populations dominate is trainable in other populations. Caucasians can have similar trainability in regards to Vo2 max, oxidative enzymes, and running economy. However, Kenyans are more likely to be slender with longer limbs which is a huge advantage in these competitions. So having a good running economy and a high Vo2 max may be the primary causal factors that cause them to be so good at distance running, with, as I’ve noted in the past, a higher genetic ceiling for high Vo2 max, along with high-altitude training (Larsen, 2003). Though Saltin et al (1995) conclude that physical activity during childhood combined with intense training as a teenager explains the higher Vo2 max in Kenyan boys. Other factors such as low blood lactate and ammonia accumulation are also important.
Genetics, though, is the most likely explanation for African distance-running dominance (Vancini et al, 2014; see Scott and Pitsiladis, 2007 for alternative view that as of yet there are no genetic evidence for African running superiority).
Not all studies show that Kenyans have more slow-twitch (type I) fibers than Caucasians, though the oxygen cost of running at a given velocity was found to be lower in elite Kenyan runners compared to non-Kenyans, which may be due to body dimensions. Apparently, there is no indication that Kenyans possess a pulmonary system that confers a physiologic advantage over non-Kenyans (Larsen and Sheel, 2015). Ethiopian diets, however, met the most recommendations for macronutrients, but fluids were lacking (Beis et al, 2011), similar to what is found on similar studies in Kenyans (Onywera et al, 2003).
It is important to note that not all of the literature out there says that there are mainly physiologic/genetic reasons for their success in distance running; other factors that may be at play are somatype which leads to exceptional biomechanical and metabolic efficiency, high-altitude training, and the want to succeed for economic and social advancement (Wilbur and Pitsiladis, 2012). Oxygen transport of the blood doesn’t explain Kenyan dominance either, they have similar oxygen transport as elite German runners (Prommer et al, 2010). Though, women and men from Ethiopia and Kenya, although they only account for <0.1% of the marathons and half-marathons, achieved the fastest times and were the youngest in the half-marathons and full-marathons (Knechtle et al, 2016). Similar results were seen in Switzerland, with male Africans being faster and younger than non-Africans (Aschmann et al, 2013).
From the years 2000-2014, Knechtle et al (2017) analyzed the Boston, Berlin, New York, and Chicago marathon along with the Stockholm marathon. Over this time period, Ethiopian men improved their times, but Ethiopian women didn’t. Age increased in Ethiopian men, but not women. Female and male marathon runners from Ethiopia were the fastest (Knechtle et al 2017). More studies, though, are needed to unravel the complex relationship between environmental and genetic factors that cause East Africans to dominate distance running (Onywera, 2009). However, elite endurance athletes consistently test higher than non-elite athletes on running economy, Vo2 max, and anaerobic threshold (Lorenz et al, 2013), and mechanical work may be able to predict recreational long distance performance (Tartaruga et al, 2013).
Jamaicans
Jamaican sprinting dominance has been chalked up to numerous factors, most recently, symmetry of the knees and ankles (Trivers, Palestis, and Manning, 2013; Trivers et al, 2014). Trivers et al (2014) write in the Discussion:
Jamaicans are the elite sprinters of the world. Why? If symmetry of knees and ankles is a factor, why should Jamaicans be especially symmetrical (there is no knowledge of whether they actually are)? One possibility is heterozygosity for genes important to sprinting. The slave trade greatly increased heterozygosity on the West African side by mixing genes up and down the West coast of Africa from Senegal to Nigeria [15], [16]. Recently a mtDNA haplotype has been isolated that correlates with success in African American–but not Jamaican–sprinters [17]. Since there is a general (if often weak) positive relationship between heterozygosity and body symmetry [18] we are eager to do targeted studies of genomics on areas associated with sprinting, including energy substrate utilization, muscle fibre-type distribution and body composition analyses (with specific reference to the shape and size of the glutei maximi). Fast twitch (anaerobic) muscle fibres are characterized by specific adaptations which benefit the performances of explosive high-intensity actions such as those involved in sprinting. Notably, West Africans appear to have a higher fast twitch muscle fibre content than do comparable Europeans (67.5% vs 59% in one sample [19], as cited in [20]).
It’s interesting to note that the mtDNA haplotype predicts success in African American sprinters, but not Jamaicans. In regards to mtDNA haplotypes, Jamaican sprinters had statistically similar mtDNA haplotypes, which suggests that the elite sprinters arose from the same source population which indicates that there is no population stratification or isolation on sprint performance. African American sprinters and non-sprinters, on the other hand, had statistically significant differences in mtDNA, which implies that maternal ancestry plays a part in sprinting performance (Deason et al, 2011). Studying both maternal and paternal haplotypes to see where source populations originate is important in these fields, since if we know where their population came from, then we can better understand the hows and whys of elite running performance—especially between race. Though demographic studies on Jamaicans show that elite sprinters come from the same demographic population, so genetics cannot possibly account for Jamaican sprinting success, so their sprinting success may be related to environmental and social factors (Irving et al, 2013). We know little about the genomics of elite sporting performance (Pitsiladis et al, 2013), so the physical correlates (somatype) and physiologic correlates will do for now.
Usain Bolt is the current fastest man in the world, due in part to his anthropometric advantage (Krzystof and Mero, 2013). As everyone knows, you cannot teach speed (Lombardo and Deaner, 2014). Bolt himself has a large advantage, in part, to his power development and biomechanical efficiency compared to the people he competes with (Beneke and Taylor, 2010). Though one study has noted that a human may be able to run faster quadrupedally than bipedally–stating that at the 2048 Olympic Games, that the fastest human on the planet may well be a quadrupedal runner (Kinugasa and Usami, 2016). One of the most important factors of acceleration in the 100m sprint is stride frequency (Mackala, Fostiak, and Kowalski, 2015).
In Afro-Caribbean adolescents, body height and stride number to body height ratio were the main determinants of sprint performance (Copaver, Hertogh, and Hue, 2012). Body height being a predictor of sprint performance is nothing new; taller people have longer limbs; longer limbs cover more distance per step. Indeed, sprinters are taller than the American population, there is more variability in men than in women, sprinters have lower body mass and the height range excludes people who are really tall or really short (Uth, 2005).
Fiber typing
I will touch on fiber typing again since I’ve come across new information on it.
East Asians are less likely to have the RR allele of the ‘sprint gene’ (MacArthur and North, 2004) (ACTN3) while Bantus are more likely to have it. Alpha-actinen-3 is a skeletal muscle isoform which is encoded by the ACTN3 gene. Alpha-actinen-3 deficiency is common in the general population (North, 2008; Berman and North, 2010), which means that most people in the general population are XX. Eighteen percent of the population on earth is homozygous for this mutation (Ivarsson and Westerblad, 2015). This allele is the 577X allele, and Bantus are less likely to have it while Eurasians are more likely to have it. The frequency of the RR genotype is also highest in Bantus than in Asians (Mills et al, 2001). This is one very important reason why Eurasians are not faster than Africans (somatype matters too, of course).
Elite sprinters are more likely to be RR and less likely to be XX. Why does this matter? It matters because the RR genotype with the right morphology, fiber type (fast twitch) and contractile properties of the individual fast twitch fibers contribute to heightened performance with an RR genotype (Broos et al, 2016). Jamaicans are also less likely to have the XX genotype (~2 percent) along with Kenyans (Scott et al, 2010). So this shows that since Jamaicans are less likely to be XX, they’re more likely to be RR. So since XX i negatively associated with sprint status, then populations that have a lower frequency will be more likely to have more sprinters, whereas a population that has the genotype will have fewer sprinters.
This is one of many genetic factors that account for elite sprinting performance between populations. So, clearly, the right muscle fiber type combined with the right genotype from the ACTN3 gene infers an advantage, contrary to Daniel MacArthur’s claims that it does not (one of the authors of numerous studies on the ACTN3 gene).
Conclusion
The genetics of sprinting/distance running is currently poorly understood. Though we have a few candidates (and they’re really good, showing variation where they should) like the RR ACTN3 genotype combined with fast twitch fibers. This is very important to note. If you’re missing this, and you’re short with a low Vo2 max and low limb length, there’s an extremely high chance you will not be an elite sprinter/distance runner. I cannot emphasize enough how much the physical factors mean when it comes to this.
It is possible that SES variables combined with other psycho-social factors could explain why these three populations excel so well in these sports. Though, on the other hand, you cannot discount that the individual has to have the right somatype and physical capabilities first. Contrary to popular belief, fiber typing DOES give an advantage, especially if combined with other variables. Low BMI is very important, as are long limbs and a taller than average height.
When it comes to Jamaicans, symmetry of the knees and ankles help considerably, along with a low body mass and taller body. SES factors could be driving the will to compete in these three populations, however, the physical ability needs to be there first, then it needs to be nurtured. Over the next 5 to 10 years, we will have a better understanding of why some populations excel over others and that will largely be due to somatype, physiology, and genetic factors, with SES and other psycho-social factors driving the want to excel in the sport.
The physical differences that underlie the success of these three populations needs more study. Elite athletes of Jamaican, Kenyan, and Ethiopian descent need to be studied more to untangle the physiologic, psychological, physical and social factors that have them excel so well. We know that certain combinations of traits infer a great advantage in certain populations, we now just need enough elite athletes of these populations to study to see how and why they excel so much. The current body of research reviewed here is a good start, though it does leave some questions unanswered.
Black-White Differences in Muscle Fiber and Its Role In Disease and Obesity
1700 words
How do whites and blacks differ by muscle fiber and what does it mean for certain health outcomes? This is something I’ve touched on in the past, albeit briefly, and decided to go in depth on it today. The characteristics of skeletal muscle fibers dictate whether one has a higher or lower chance of being affected by cardiometabolic disease/cancer. Those with more type I fibers have less of a chance of acquiring diabetes while those with type II fibers have a higher chance of acquiring debilitating diseases. This has direct implications for health disparities between the two races.
Muscle fiber typing by race
Racial differences in muscle fiber typing explain differences in strength and mortality. I have, without a shadow of a doubt, proven this. So since blacks have higher rates of type II fibers while whites have higher rates of type I fibers (41 percent type I for white Americans, 33 percent type I for black Americans, Ama et al, 1985) while West Africans have 75 percent fast twitch and East Africans have 25 percent fast twitch (Hobchachka, 1988). Further, East and West Africans differ in typing composition, 75 percent fast for WAs and 25 percent fast for EAs, which has to do with what type of environment they evolved in (Hochhachka, 1998). What Hochhachka (1998) also shows is that high latitude populations (Quechua, Aymara, Sherpa, Tibetan and Kenyan) “show numerous similarities in physiological hypoxia defence mechanisms.” Clearly, slow-twitch fibers co-evolved here.
Clearly, slow-twitch fibers co-evolved with hypoxia. Since hypoxia is the deficiency in the amount of oxygen that reaches the tissues, populations in higher elevations will evolve hypoxia defense mechanisms, and with it, the ability to use the oxygen they do get more efficiently. This plays a critical role in the fiber typing of these populations. Since they can use oxygen more efficiently, they then can become more efficient runners. Of course, these populations have evolved to be great distance runners and their morphology followed suit.
Caesar and Henry (2015) also show that whites have more type I fibers than blacks who have more type II fibers. When coupled with physical inactivity, this causes higher rates of cancer and cardiometabolic disease. Indeed, blacks have higher rates of cancer and mortality than whites (American Cancer Society, 2016), both of which are due, in part, to muscle fiber typing. This could explain a lot of the variation in disease acquisition in America between blacks and whites. Physiologic differences between the races clearly need to be better studied. But we first must acknowledge physical differences between the races.
Disease and muscle fiber typing
Now that we know the distribution of fiber types by race, we need to see what type of evidence there is that differing muscle fiber typing causes differences in disease acquisition.
Those with fast twitch fibers are more likely to acquire type II diabetes and COPD (Hagiwara, 2013); cardiometabolic disease and cancer (Caesar and Henry, 2015); a higher risk of cardiovascular events (Andersen et al, 2015, Hernelahti et al, 2006); high blood pressure, high heart rate, and unfavorable left ventricle geometry leading to higher heart disease rates and obesity (Karjalainen et al, 2006) etc. Knowing what we know about muscle fiber typing and its role in disease, it makes sense that we should take this knowledge and acknowledge physical racial differences. However, once that is done then we would need to acknowledge more uncomfortable truths, such as the black-white IQ gap.
One hypothesis for why fast twitch fibers are correlated with higher disease acquisition is as follows: fast twitch fibers fire faster, so due to mechanical stress from rapid and forceful contraction, this leads the fibers to be more susceptible to damage and thus the individual will have higher rates of disease. Once this simple physiologic fact is acknowledged by the general public, better measures can be taken for disease prevention.
Due to differences in fiber typing, both whites and blacks must do differing types of cardio to stay healthy. Due to whites’ abundance of slow twitch fibers, aerobic training is best (not too intense). However, on the other hand, due to blacks’ abundance of fast twitch fibers, they should do more anaerobic type exercises to attempt to mitigate the diseases that they are more susceptible due to their fiber typing.
Black men with more type II fibers and less type I fibers are more likely to be obese than ‘Caucasian‘ men are to be obese (Tanner et al, 2001). More amazingly, Tanner et al showed that there was a positive correlation (.72) between weight loss and percentage of type I fibers in obese patients. This has important implications for African-American obesity rates, as they are the most obese ethny in America (Ogden et al, 2016) and have higher rates of metabolic syndrome (a lot of the variation in obesity does come down food insecurity, however). Leaner subjects had higher proportions of type I fibers compared to type II. Blacks have a lower amount of type I fibers compared to whites without adiposity even being taken into account. Not surprisingly, when the amount of type I fibers was compared by ethnicity, there was a “significant interaction” with ethnicity and obesity status when type I fibers were compared (Tanner et al, 2001). Since we know that blacks have a lower amount of type I fibers, they are more likely to be obese.
In Tanner et al’s sample, both lean blacks and whites had a similar amount of type I fibers, whereas the lean blacks possessed more type I fibers than the obese black sample. Just like there was a “significant interaction” between ethnicity, obesity, and type I fibers, the same was found for type IIb fibers (which, as I’ve covered, black Americans have more of these fibers). There was, again, no difference between lean black and whites in terms of type I fibers. However, there was a difference in type IIb fibers when obese blacks and lean blacks were compared, with obese blacks having more IIb fibers. Obese whites also had more type IIb fibers than lean whites. Put simply (and I know people here don’t want to hear this), it is easier for people with type I fibers to lose weight than those with type II fibers. This data is some of the best out there showing the relationship between muscle fiber typing and obesity—and it also has great explanatory power for black American obesity rates.
Conclusion
Muscle fiber differences between blacks and whites explain disease acquisition rates, mortality rates (Araujo et al, 2010), and differences in elite sporting competition between the races. I’ve proven that whites are stronger than blacks based on the available scientific data/strength competitions (click here for an in-depth discussion). One of the most surprising things that muscle fibers dictate is weight loss/obesity acquisition. Clearly, we need to acknowledge these differences and have differing physical activity protocols for each racial group based on their muscle fiber typing. However, I can’t help but think about the correlation between strength and mortality now. This obesity/fiber type study puts it into a whole new perspective. Those with type I fibers are more likely to be physically stronger, which is a cardioprotectant, which then protects against all-cause mortality in men (Ruiz et al, 2008; Volaklis, Halle, and Meisenger, 2015). So the fact that black Americans have a lower life expectancy as well as lower physical strength and more tpe II fibers than type I fibers shows why blacks are more obese, why blacks are not represented in strength competitions, and why blacks have higher rates of disease than other populations.The study by Tanner et al (2001) shows that there obese people are more likely to have type II fibers, no matter the race. Since we know that blacks have more type II fibers on average, this explains a part of the variance in the black American obesity rates and further disease acquisition/mortality.
The study by Tanner et al (2001) shows that there obese people are more likely to have type II fibers, no matter the race. Since we know that blacks have more type II fibers on average, this explains a part of the variance in the black American obesity rates and further disease acquisition/mortality.
Differences in muscle fiber typing do not explain all of the variance in disease acquisition/strength differences, however, understanding what the differing fiber typings do, metabolically speaking, along with how they affect disease acquisition will only lead to higher qualities of life for everyone involved.
References
Araujo, A. B., Chiu, G. R., Kupelian, V., Hall, S. A., Williams, R. E., Clark, R. V., & Mckinlay, J. B. (2010). Lean mass, muscle strength, and physical function in a diverse population of men: a population-based cross-sectional study. BMC Public Health,10(1). doi:10.1186/1471-2458-10-508
Andersen K, Lind L, Ingelsson E, Amlov J, Byberg L, Miachelsson K, Sundstrom J. Skeletal muscle morphology and risk of cardiovascular disease in elderly men. Eur J Prev Cardiol 2013.
Ama PFM, Simoneau JA, Boulay MR, Serresse Q Thériault G, Bouchard C. Skeletal muscle characteristics in sedentary Black and Caucasian males. J Appl Physiol 1986: 6l:1758-1761.
American Cancer Society. Cancer Facts & Figures for African Americans 2016-2018. Atlanta: American Cancer Society, 2016.
Ceaser, T., & Hunter, G. (2015). Black and White Race Differences in Aerobic Capacity, Muscle Fiber Type, and Their Influence on Metabolic Processes. Sports Medicine,45(5), 615-623. doi:10.1007/s40279-015-0318-7
Hagiwara N. Muscle fibre types: their role in health, disease and as therapeutic targets. OA Biology 2013 Nov 01;1(1):2.
Hernelahti, M., Tikkanen, H. O., Karjalainen, J., & Kujala, U. M. (2005). Muscle Fiber-Type Distribution as a Predictor of Blood Pressure: A 19-Year Follow-Up Study. Hypertension,45(5), 1019-1023. doi:10.1161/01.hyp.0000165023.09921.34
Hochachka, P.W. (1998) Mechanism and evolution of hypoxia-tolerance in humans. J. Exp. Biol. 201, 1243–1254
Karjalainen, J., Tikkanen, H., Hernelahti, M., & Kujala, U. M. (2006). Muscle fiber-type distribution predicts weight gain and unfavorable left ventricular geometry: a 19 year follow-up study. BMC Cardiovascular Disorders,6(1). doi:10.1186/1471-2261-6-2
Ogden C. L., Carroll, M. D., Lawman, H. G., Fryar, C. D., Kruszon-Moran, D., Kit, B.K., & Flegal K. M. (2016). Trends in obesity prevalence among children and adolescents in the United States, 1988-1994 through 2013-2014. JAMA, 315(21), 2292-2299.
Ruiz, J. R., Sui, X., Lobelo, F., Morrow, J. R., Jackson, A. W., Sjostrom, M., & Blair, S. N. (2008). Association between muscular strength and mortality in men: prospective cohort study. Bmj,337(Jul01 2). doi:10.1136/bmj.a439
Tanner, C. J., Barakat, H. A., Dohm, G. L., Pories, W. J., Macdonald, K. G., Cunningham, P. R., . . . Houmard, J. A. (2001). Muscle fiber type is associated with obesity and weight loss. American Journal of Physiology – Endocrinology And Metabolism,282(6). doi:10.1152/ajpendo.00416.2001
Volaklis, K. A., Halle, M., & Meisinger, C. (2015). Muscular strength as a strong predictor of mortality: A narrative review. European Journal of Internal Medicine,26(5), 303-310. doi:10.1016/j.ejim.2015.04.013
Racial Differences in Grip Strength
1700 words
Strength differences between the races are of big interest to me. Not only due to the evolutionary perspective, but also due to how it relates to health and disease. Hand grip strength (HGS) in men is a good predictor of: Parkinson’s disease (Roberts et al, 2015); lower cardiovascular health profile (Lawman et al, 2016); Alzheimer’s disease (Buchman et al, 2007) and other chronic diseases in men, not in women (Cheung et al, 2013). HGS also predicts diabetes and hypertension (Mainous 3rd et al, 2015), as well as death from all causes, cardiovascular disease (CVD) and cancer in men (Gale et al, 2006). Due to these associations, the study of HGS in men is well warranted. However, here too, we find racial differences and they just so happen to follow trends and corroborate with other data on the mortality of men with lower grip strength.
Araujo et al (2010) obtained data from the Boston Community Health/Bone (BACH/Bone) Survey which included 1,219 randomly selected black, white and ‘Hispanic’ men to assess lean mass, muscle strength, and physical function. Though out of this sample, 10 men didn’t have a DXA performed and 49 men missing data on lean mass, fat mass and Physical Activity for the Elderly (PASE), which left 1,157 men to be analyzed. These studies, however, leave a lot to be desired in how they measure strength (for the purposes that I’m interested in) but they will have to do, for now. Unlike the bench pressing study I wrote about yesterday in which calipers were used to assess body fat, in this study they measured body fat with the DXA scan to assess lean mass. That way, there won’t be any potential confounds, possibly skewing lean mass/fat comparisons. The age of the cohort ranged from 30 to 79 with a mean age of 48.
Table 1 shows the results of the DXA scan, anthropometric data and lean and fat mass. Blacks’ mean lean mass of 124 pounds (mean weight 193 pounds), ‘Hispanics” lean mass was 114 pounds (mean weight 179 pounds) and whites had a mean lean mass of 122 pounds (mean weight 196 pounds). Blacks had a mean grip strength of 89.826 pounds while ‘Hispanics’ had a mean grip strength of 82.698 pounds and whites had a mean grip strength of 88.528 pounds. Blacks had a higher lean mass index than whites by 5 percent, but had a composite physical function score 20 percent lower than whites.
White men had a 25 percent higher average composite physical functioning score, which, when indexed by lean mass and grip, white men had grips 10 percent stronger. White men also scored higher on physical function and lean mass. White men had lower levels of lean muscle mass than blacks and ‘Hispanics’ after controlling for confounding factors, yet whites were still stronger. Since lean mass is related to strength, blacks and ‘Hispanics’ should have had a stronger grip, yet they didn’t. Why?
The authors stated that the reason was unknown since they didn’t test for muscle quality or strength exerted for each unit of muscle. I have proven that whites, on average, are stronger than blacks. If the it were true that blacks were stronger, which is what you see upon first glance viewing table 1 of Araujo et al (2010), then the black population would have lower rates of morbidity and mortality due to higher levels of strength. The black population doesn’t have lower levels of morbidity or mortality. Therefore blacks are not stronger than whites.
Muscular strength is associated with mortality in men (Ruiz et al, 2008; Volaklis, Halle, and Meisenger, 2015), so if the strongest race of men has lower incidences of the above diseases mentioned above along with a higher life expectancy, then there is a good chance that muscular strength is a good predictor of disease within and between race and ethnicity as well. Muscular strength is inversely associated with death from all causes and cancer in men even after adjusting for cardiorespiratory factors. The findings from Ruiz et al (2008) are valid for young and old men (aged 20-82), as well as normal and overweight men.
There are clear associations between muscular strength/hand grip strength and mortality. These differences in mortality are also seen in the United States between race. In 2012, the death rate for all cancer combined was 24 percent higher in black men than in white men. Life expectancy is lower for blacks at 72.3 years compared to 76.7 years for white men (American Cancer Society, 2016). As shown above, men with lower levels of muscular strength have a higher risk of mortality.
As I have asserted in the past, blacks have differing muscle fiber typing (type II) on average when compared to whites (who have type I fibers). Type II muscle fibers are associated with a reduced Vo2 max, which has implications for the health of black Americans. Blacks have lower aerobic capacity along with a greater percentage of type II skeletal muscle fiber (Caesar and Hunter, 2015).
Slow twitch fibers fire through aerobic pathways. Fast twitch (Type II) fibers fire through anaerobic pathways and tire quicker than slow twitch. Each fiber fires off through different pathways, whether they be anaerobic or aerobic. The body uses two types of energy systems, aerobic or anaerobic, which then generate Adenosine Triphosphate, better known as ATP, which causes the muscles to contract or relax. Depending on the type of fibers an individual has dictates which pathway muscles use to contract which then, ultimately, dictate if there is high muscular endurance or if the fibers will fire off faster for more speed.
Differences in muscle fiber typing explain why whites had a stronger grip than non-whites in the BACH/Bone survey. Testing the fiber typings of the three ethnies would have found a higher percentage of type II fibers in blacks, which would account for the lower grip strength despite having higher levels of lean mass when compared to whites.
The apparent ‘paradox’ seen in Araujo et al (2010) is explained by basic physiology. However, in our politically correct society, such differences may be suppressed and thusly people won’t be able to receive the help they need. Race is an extremely useful marker in regards to medicine. By denying average racial differences in numerous anatomical/metabolic/physiologic traits, we deny people the right help they need. Common sense dictates that if such relationships are found, then further research must occur in order to find the cause and a possible solution to the problem.
This study by Araujo et al shows that we need to pay more attention to race when it comes to disease. By denying racial differences we are dooming people to a lower quality of life due to the implicit assumption that we are all the same on the inside (farrrrr from the truth). These average differences in metabolism, anatomy, and physiology do account for some of the variation in disease between race and ethnicity, so this warrants further research. If only we, as a country, can acknowledge racial differences and get people the correct help. Maybe one day we can stop assuming that all races are equal on the inside and when you notice a trend within a particular racial group you find out the cause and whether or not there is any way to ameliorate it.
Muscular strength adds to the protective effect of cardiorespiratory fitness and risk of death in men. That blacks have lower levels of strength than whites, have different muscle fiber typing than whites on average, a lower life expectancy than whites, and higher rates of cancer show that they do not have the physical strength that whites do. What really seals the deal is the fact that blacks have more type II muscle fibers (Caesar and Hunter, 2015). Muscular strength/grip strength is a great predictor of disease in men. Since blacks have lower grip strength yet higher levels of lean mass compared to whites, this show that the difference is due to muscle fiber typing, which, as I have covered in the past, are also associated with cardiometabolic disease and obesity.
Blacks have the highest rate of obesity in America. Looking at obesity rates in America, we see that 69 percent of black men are overweight or obese (remember that black Americans with more African ancestry are less likely to be obese), 71.4 percent of white men are overweight or obese, and 78.6 percent of ‘Hispanic’ men are overweight or obese (Ogden et al, 2016).
Blacks are not stronger than whites. I have compiled enough data to prove that fact. This adds further support for my contention.
References
American Cancer Society. Cancer Facts & Figures for African Americans 2016-2018. Atlanta: American Cancer Society, 2016.
Araujo, A. B., Chiu, G. R., Kupelian, V., Hall, S. A., Williams, R. E., Clark, R. V., & Mckinlay, J. B. (2010). Lean mass, muscle strength, and physical function in a diverse population of men: a population-based cross-sectional study. BMC Public Health,10(1). doi:10.1186/1471-2458-10-508
Buchman, A. S., Wilson, R. S., Boyle, P. A., Bienias, J. L., & Bennett, D. A. (2007). Grip Strength and the Risk of Incident Alzheimer’s Disease. Neuroepidemiology,29(1-2), 66-73. doi:10.1159/000109498
Ceaser, T., & Hunter, G. (2015). Black and White Race Differences in Aerobic Capacity, Muscle Fiber Type, and Their Influence on Metabolic Processes. Sports Medicine,45(5), 615-623. doi:10.1007/s40279-015-0318-7
Cheung, C., Nguyen, U. D., Au, E., Tan, K. C., & Kung, A. W. (2013). Association of handgrip strength with chronic diseases and multimorbidity. Age,35(3), 929-941. doi:10.1007/s11357-012-9385-y
Gale, C. R., Martyn, C. N., Cooper, C., & Sayer, A. A. (2006). Grip strength, body composition, and mortality. International Journal of Epidemiology,36(1), 228-235. doi:10.1093/ije/dyl224
Lawman, H. G., Troiano, R. P., Perna, F. M., Wang, C., Fryar, C. D., & Ogden, C. L. (2016). Associations of Relative Handgrip Strength and Cardiovascular Disease Biomarkers in U.S. Adults, 2011–2012. American Journal of Preventive Medicine,50(6), 677-683. doi:10.1016/j.amepre.2015.10.022
Mainous, A. G., Tanner, R. J., Anton, S. D., & Jo, A. (2015). Grip Strength as a Marker of Hypertension and Diabetes in Healthy Weight Adults. American Journal of Preventive Medicine,49(6), 850-858. doi:10.1016/j.amepre.2015.05.025
Ogden C. L., Carroll, M. D., Lawman, H. G., Fryar, C. D., Kruszon-Moran, D., Kit, B.K., & Flegal K. M. (2016). Trends in obesity prevalence among children and adolescents in the United States, 1988-1994 through 2013-2014. JAMA, 315(21), 2292-2299.
Roberts, H. C., Syddall, H. E., Butchart, J. W., Stack, E. L., Cooper, C., & Sayer, A. A. (2015). The Association of Grip Strength With Severity and Duration of Parkinson’s. Neurorehabilitation and Neural Repair,29(9), 889-896. doi:10.1177/1545968315570324
Ruiz, J. R., Sui, X., Lobelo, F., Morrow, J. R., Jackson, A. W., Sjostrom, M., & Blair, S. N. (2008). Association between muscular strength and mortality in men: prospective cohort study. Bmj,337(Jul01 2). doi:10.1136/bmj.a439
Volaklis, K. A., Halle, M., & Meisinger, C. (2015). Muscular strength as a strong predictor of mortality: A narrative review. European Journal of Internal Medicine,26(5), 303-310. doi:10.1016/j.ejim.2015.04.013
Expounding On My Theory for Racial Differences In Sports
2300 words
In the past, I’ve talked about why the races differ—at the extremes—(and the general population, but the extremes put the picture into focus) in terms of what sports they compete and do best in. These differences come down to morphology somatype, physiology. People readily admit racial differences in sports and—rightly say—that these differences are largely genetic in nature. Why is it easier for people to accept racial differences in sports and not accept other truisms, like racial IQ differences?
I’ve muscle fiber typing and how the variances in fiber typing dictate which race/ethny performs best at which sport. I’ve also further evidence that blacks have type II fibers (responsible for explosive power), which leads to a reduced Vo2 max. This lends yet more credence to my theory of racial differences in sports—black Americans (West African descendants) have the fiber typing that is associated with explosive power, less so with endurance activities. Since I’ve documented evidence on the differences in sports such as baseball, football, swimming and jumping, bodybuilding, and finally strength sports, tonight I will talk about the evolutionary reasons for muscle fiber and somatype differences that will have us better understand the evolutionary conditions in which these traits evolved and why they got selected for.
Most WSM winners are from Nordic countries or have Nordic ancestry. There’s a higher amount of slow twitch fibers in Nordics and East Asians (and Kenyans) which is more conducive to strength and less conducive to ‘explosive’ sports. West Africans and their descendants dominate in sprinting competitions. Yea yea yea white guy won in 1960. So they will be less likely to be in strength comps and more likely to win BBing and physique comps. This is what we see.
Only three African countries have placed in the top ten in the WSM (Kenya, Namibia, and Nigeria, however, one competitor from Namibia I was able to find has European ancestry). Here is a video of a Nigerian Strongest Man competition (notice how his chest isn’t up and his hips rise before the bar reaches his knees, horrible form). Fadesere Oluwatofunmi is Nigeria’s Strongest Man, competing in the prestigious Arnold Classic, representing Nigeria. However, men such as Fadesere Olutaofunmi are outliers.
Now for a brief primer on muscle fibers and which pathways they fire through. Understanding this aspect of the human body is paramount to understanding how and why the races differ in elite competition.
Life history and muscle fiber typing
Slow twitch fibers fire through aerobic pathways. Breaking down fats and proteins takes longer through aerobic respiration. Moreover, in cold temperatures, the body switches from burning fat to burning carbohydrates for energy, which will be broken down slower due to the aerobic perspiration. Slow twitch (Type I) fibers fire through aerobic pathways and don’t tire nearly as quickly as type II fibers. Also, CHO reserves will be used more in cold weather. The body’s ability to use oxygen decreases in cold weather as well, so having slow twitch fibers is ideal (think about evolution thousands of years ago). Type I fibers fire off slower so they’ll be able to be more active for a longer period of time (studies have shown that Africans with Type II fibers hit a ‘wall’ after 40 seconds of explosive activity, which is why there are so few West-African descended marathon runners, powerlifters, Strongmen, etc). Those who possess these traits will have a higher chance to survive in these environments. Those with slow twitch fibers also have to use more oxygen. They have larger blood vessels, more mitochondria and higher concentrations of myoglobin which gives the muscles its reddish color.
Each fiber fires off through different pathways, whether they be anaerobic or aerobic. The body uses two types of energy systems, aerobic or anaerobic, which then generate Adenosine Triphosphate, better known as ATP, which causes the muscles to contract or relax. Depending on the type of fibers an individual has dictates which pathway muscles use to contract which then, ultimately, dictate if there is high muscular endurance or if the fibers will fire off faster for more speed.
Type I fibers lead to more strength and muscular endurance as they are slow to fire off, while Type II fibers fire quicker and tire faster. Slow twitch fibers use oxygen more efficiently, while fast twitch fibers do not burn oxygen to create energy. Slow twitch muscles delay firing which is why the endurance is so high in individuals with these fibers whereas for those with fast twitch fibers have their muscles fire more explosively. Slow twitch fibers don’t tire as easily while fast twitch fibers tire quickly. This is why West Africans and their descendants dominate in sprinting and other competitions where fast twitch muscle fibers dominate in comparison to slow twitch.
Paleolithic Europeans who had more stamina spread more of their genes to the next generation as their genotype was conducive to reproductive success in Ice Age Europe. Conversely in Africa, those who could get away from predators and could hunt prey more efficiently survived. Over time, frequencies of genes related to what needed to be done to survive in those environments increased, along with the frequencies of muscle fibers in the races.
Racial differences in anatomy and physiology
Along with muscle fiber differences, blacks and whites also have differences in fat-free body mass, bone density, distribution of subcutaneous fat, length of limbs relative to the trunk, and body protein contents (Wagner and Heyward, 2000). These differences are noticed and talked about in the scientific literature, even in University biology and anatomy textbooks. However, in terms of University textbooks, authors who recognize the concept of race do so in spite of what other authors write (Hallinan, 1994). Furthermore, Strkalj and Solyali (2010) analyzed 18 English textbooks on anatomy and concluded that discussion of race was ‘superficial’ and the content ‘outdated’, i.e., using the ‘Mongoloid, Caucasoid, Negroid terminology (I still do out of habit). They conclude that most mentions of race are either not mentioned in anatomy textbooks or are only ‘superficially accounted for in textbooks’. Clearly, though they are outdated, some textbooks do talk about human biological diversity, though the information needs to be updated (especially now). The center of mass in blacks is 3 percent higher than in whites, meaning whites have a 1.5 percent speed advantage in swimming while blacks have a 1.5 percent speed difference in sprinting. East Asians that are the same height as whites are even more favored in swimming, however, they are shorter on average so that’s why they do not set world records (Bejan, Jones, and Charles, 2010).
For another hand grip strength (HGP) test, see Leong et al (2016). Most studies on HGS are done on Caucasian populations with little data for non-Caucasoid populations. They found that HGS values were higher for North America and Europe, intermediate in China, South America and the Middle East, and the lowest in South Asia, Southeast Asia, and Africa. These are, most likely, average Joes and not elite BBers or strength trainers. This is one of the best papers I’ve come across on this matter (though I would kill to have a nice study done on the three classical races and their performance on the Big 3 lifts: squat, bench press and deadlift; I’m positive it would be Asian/white and blacks as the tail end).
Among other physical differences is brain size and hip width. Blacks have narrower hips than whites who have narrower hips than Asians (Rushton, 1997: 163). Bigger-brained babes are more than likely born to women who have wider hips. If you think about athletic competition, one with wide hips will get decimated by one with narrower hips as he will be better able to move. People with big crania, in turn, have the hip structure to birth big brains. This causes further division between racial groupings in sports competition.
Some people may dispute a genetic causation and attribute the success of, say, Kenyan marathoners (the Kalenjin people) and attribute the effects to the immediate environment (not ancestral), training and willpower (see here for discussion). This Kenyan subpopulation also has the morphology conducive to success in marathons (tall and lengthy), as well as type II muscle fibers (which is why Kenya placed in the WSM).
I would also like to see a study of men in their prime (age 21 to 24) from European, Africans, and East Asian backgrounds with a high n (for a study like this it’d be 20 to 30 participants for each race), with good controls. You’d see, in my opinion, East Asians slightly nudge out whites who destroy blacks. The opposite would occur in sports that use type II fibers. West Africans also have the gene variant ACTN3 which is associated with explosive sports.
For a better (less ethical study) we can use a thought experiment.
We take two babes fresh out of the womb (one European, the other West African) and keep them locked in a metabolic chamber for their whole entire lives. We keep them in the chamber until they die and monitor them, feeding them the same exact diet and giving them the same amount of attention. They start training at age 15. Who will be stronger in their prime (the European man)? Who will have more explosive power (the West African man)? A simple thought experiment can have one thinking about intrinsic racial differences in things the average American watches in their everyday lives. The subject of racial differences in sports is a non-taboo subject, however, the subject of racial differences in intelligence is a big no-no.
Think about that for a second. People obviously accept racial differences in sports, yet they have some kind of emotional attachment to the blank slate narrative. We don’t hear that you can nurture athletic success. We do, however, hear that ‘we can succeed at anything we put out minds to’. That’s not in dispute; that’s a fact. But it’s twisted in a way that genetics and ancestry has no bearing on it, when it explains a lot of the variance. People accept racial differences when they’re cheering on their favorite football team or basketball team. For instance, NFL announcer Gus Johnson said during a broadcast of a Titans and Jaguars game “He’s [Chris Johnson] got gettin’ away from the cops speed!”
Pro-sports announcers, as well as college recruiters, know what the average person doesn’t who is not exposed to these differences daily for decades on end. People in these types of professions, especially collegiate sports recruiters, must get the low-down on average racial differences and then use what they know to make their choices on who to draft for their team.
For more (anecdotal) evidence, you can look up the race/ethnicity of the winners in competitions where peoples from all over the world compete in. More West African descendants place higher in physique, BBing comps, etc; more Caucasians and East Asians (and Kenyans) place higher in strength comps. A white man has won the WSM every year since its inception. West African descended blacks dominate BBing and physique comps. Eurasians (and Kenyans) dominate in marathon running.
All of this talk of racial differences in sports (which largely has to do with whites vs. blacks, though Asians are included in my overall analysis), I’ve hardly cited anything on East Asians directly. In regards to sports that take extreme dexterity or flexibility (and high reaction), East Asians shine. They shine in diving, ping-pong, skating and gymnastics events. They usually have long torsos and small limbs. I theorize that this was an evolutionary adaptation for the East Asians, as shorter people have less surface area to keep warm. Taller people would have died out quicker than one who’s smaller and can cover up and get warmer faster. They also have quicker reaction times (Rushton and Jensen, 2005) and it has been hypothesized that this is why they dominate in ping pong.
Conclusion
We don’t need any tests to show that there are racial differences in sports; the test is the competition itself. On average, A white will be stronger than an Asian who will be stronger than a black. Conversely, a Kenyan will be a better marathoner than a West African, European or Asian. West Africans will be more likely to beat all three groups in a sprint. These differences come down to morphology, but they start inside the muscles with the muscle fibers. Some anatomy textbooks acknowledge the existence of race, however, they have old and outdated information. It’s a good thing that anatomy textbooks talk about racial differences in physiology and anatomy, now we need to start doing heavy research into racial differences in the brain. The races evolved their fiber typing depending on what they had to do to survive along with their immediate environment, i.e., high elevation like the Kalenjin people.
The evolution of differing muscle fiber types in different races is easily explainable: Europeans have slow twitch fibers. In cold temperatures, the body switches from burning fat to burning carbs for energy. Furthermore, the average person would need to have a higher lung capacity and not tire out during long hunts on megafauna. Over time, selection occurred on the individuals with more type I fibers. Conversely, West Africans and their descendants have the ACTN3 gene, which is associated with elite human athletic performance (Yang et al, 2003). Africans who could get away from predators survived and passed on the genes and fiber typing for elite athletic performance.
In sum, the races differ in terms of entrants to elite athletic competition. These differences are largely genetic in nature. Evolutionary processes explain racial differences in sports. These same selection processes that explain racial differences in elite sports competitions also explain racial differences in intelligence. I await the day that we can freely speak about racial differences in intelligence just like we speak about racial differences in sports. Denying human variation makes no sense, especially in today’s world where we have state of the art testing.
