
Home » Posts tagged 'Racial Differences'
Tag Archives: Racial Differences
Racial Differences in Amputation
1850 words
Overview
An amputation is a preventative measure. It is done for a few reasons: To stop the spread of a gangrenous infection and to save more of a limb after there is no blood flow to the limb after a period of time. Other reasons are due to trauma and diabetes. Trauma, infection, and diabetes are leading causes of amputation in developing countries whereas in developed countries it is peripheral vascular disease (Sarvestani and Azam, 2013). Poor circulation to an affected limb leads to tissue death—when the tissue begins turning black, it means that there is no or low blood flow to the tissue, and to save more of the limb, the limb is amputated just above where the infection is. About 1.8 million Americans are living as amputees. After amputation, there is a phenomenon called “phantom limb” where amputees can “feel” their limb they previously had, and even feel pain to it, and it is very common in amputees; about 60-80 percent of amputees report “feeling” a phantom limb (see Collins et al, 2018; Kaur and Guan, 2018). The sensation can occur either immediately after amputation or years after. Phantom limb pain is neuropathic pain—a pain that is caused by damage to the somatosensory system (Subedi and Grossberg, 2011). Amputees even have shorter lifespans. When foot-amputation is performed due to uncontrolled diabetes, mortality ranges between 13-40 percent for year one, 35-65 percent for year 3, and 39-85 percent in year 5 (Beyaz, Guller, and Bagir, 2017).
Race and amputation
Amputation of the lower extremities are the most common amputations (Molina and Faulk, 2020). Minority populations are less likely to receive preventative care, such as preventative vascular screenings and care, which leads to them being more likely to undergo amputations. Such populations are more likely to suffer from disease of the lower extremities, and it is due to this that minorities undergo amputations more often than whites in America. Minorities in America—i.e., blacks and “Hispanics”—are about twice as likely as whites to undergo lower-extremity amputation (Rucker-Whitaker, Feinglass, and Pearce, 2003; Lowe and Tariman, 2008; Lefebvre and Lavery, 2011; Mustapha et al, 2017; Arya et al, 2018)—so it is an epidemic for black America. Blacks are even more likely to undergo repeat amputation (Rucker-Whitaker, Feinglass, and Pearce, 2003). In fact, here is a great essay chronicling the stories of some double-amputee black patients.
Why do blacks undergo amputations more often than whites? One answer is, of course: Physician bias. For example, after controlling for demographic, clinical, and chronic disease status, blacks were 1.7 times more likely than whites to undergo lower-leg amputations (Feinglass et al, 2005; Regenbogen et al, 2007; Lefebvre and Lavery, 2011). What is a cause of this is inequity in healthcare—note that “inequity” here means differences in care that are avoidable and unjust (Sudana and Blas, 2013).
Another reason is due to complications from diabetes. Blacks have higher rates of diabetes than whites (Rodriguez and Campbell, 2007) but see Signorello et al (2007). Muscle fiber differences between races (see also here). Differences in hours-slept between blacks and whites, too, could also explain the severity of the disease. But what could also be driving differences in diabetes between races is the fact that blacks are more likely than whites to live in “food swamps.” Food swamps are where it is hard to find nutritionally-dense food, whereas food deserts are areas where there is little access to healthy, nutritious food. In fact, a neighborhood being a food swamp is more predictive of obesity status of the population in the area than is its being a food desert (Cooksey-Stowers, Schwartz, and Brownell, 2017). Along with the slew of advertisements in that are directed to low-income neighborhoods (see Cassady, Liaw, and Miller, 2015), we can now see how such things like food swamps contribute to high hospitalization rates in low-income neighborhoods (Phillips and Rogriguez, 2019). These amputations are preventable—and so, we can say that there is a lack of equity in healthcare between races which leads to these different rates in amputation—before even thinking about physician bias. Amputation rates for blacks in the southeast can be almost seven times higher than other regions (Goodney et al, 2014).
Stapleton et al (2018: 644) conclude in their study on physician bias and amputation:
Our study demonstrates that such justifications may be unevenly applied across race, suggesting an underlying bias. This may reflect a form of racial paternalism, the general societal perception that minorities are less capable of “taking care of themselves,” even including issues related to health and disease management.23 Underlying bias may prompt more providers to consider amputation for minority patients. Furthermore, unlike in transplant surgery, there is currently no formal process for assessing patient compliance with treatment protocols or self-care in vascular surgery.24 Asking providers to make snap judgments about patient compliance, without a protocol for objective assessment, allows subconscious bias to influence patient care.
Physician bias is pervasive (Hoberman, 2012)—whether it is conscious or unconscious racial bias. Such biases can and do lead to outcomes that should not occur. By attempting to reduce disparities in healthcare that then lead to negative outcomes, we can then attempt to improve the quality of healthcare given to lower-income groups, like blacks. Such biases lead to negative health outcomes for blacks (such as the claim that blacks feel less pain than whites), and if they were addressed and conquered, then we could increase equity between groups until access to healthcare is equal—and physician bias is an impediment to access to equal healthcare due to the a priori biases that physicians may hold about certain racial/ethnic groups. Medical racism, therefore, drives a lot of the amputation differences between blacks and whites. Hospitals that are better equipped to offer revascularization services (attempting to save the limb by increasing blood flow to the affected limb) even had a higher rate of amputations in blacks when compared to whites (Durazzo, Frencher, and Gusberg, 2013).
For example. Mustapha et al (2017) write:
Compared to Caucasian patients, several studies have found that African-Americans with PAD are more likely to be amputated and less likely to have their lower limb revascularized either surgically or via an endovascular approach [3–9]. In an early analysis of data from acute-care hospitals in Florida, Huber et al. reported that the incidence of amputation (5.0 vs. 2.5 per 10,000) was higher and revascularization lower (4.0 vs. 7.1 per 10,000) among African-Americans compared to Caucasians, even though the incidence of any procedure for PAD was comparable (9.0 vs. 9.6 per 10,000) [4]. Other studies have reported that the probability of undergoing a revascularization or angioplasty was reduced by 28–49 % among African-Americans relative to Caucasians [3 6]
Pro-white unconscious biases were also found among physicians, as Kandi and Tan (2020) note:
There is evidence of both healthcare provider racism and unconscious racial biases. Green et al. found significant pro-White bias among internal medicine and emergency medicine residents, while James SA supported this finding, indicating a “pro-white” unconscious bias in physician’s attitudes towards, and interactions with, patients [43,44]. In a survey assessing implicit and explicit racial bias by Emergency Department (ED) providers in care of NA children, it was discovered that many ED providers had an implicit preference for white children compared to those who identified as NA [45]. Indeed, racism and stigmatization are identified as being many American Indians’ experiences in healthcare.
One major cause of the disparity is that blacks are not offered revascularization services at the same rate as whites. Holman et al (2011: 425) write:
Finally, given that patients’ decisions are necessarily confined to the options offered by their physicians, racial differences in limb salvage care might be attributable to differences in physician decision making. There are some data to suggest lower vein graft patency rates in black patients compared to whites.18,19 A patient’s race, therefore, may influence a vascular surgeon’s judgment about the efficacy of revascularization in preventing or delaying amputation. Similarly, a higher proportion of black patients in our sample were of low SES, which correlates with tobacco use,20-22 and we know that continued tobacco use increases the risk of lower extremity graft failure approximately three-fold.23 It is possible that a higher proportion of black patients in our sample were smokers who refused to quit, in which case vascular surgeons would be much less likely to offer them the option of revascularization. While Medicare data include an ICD-9 diagnosis code for tobacco use, the prevalence in our study sample was approximately 2%, suggesting that this code was grossly unreliable as a means of directly measuring and adjusting for tobacco use.
Smoking, of course, could be a reason why revascularization would not be offered to black patients. Though, as I have noted, smoking ads are more likely to be found in lower-income neighborhoods which increases the prevalence of smokers in the community.
With this, I am reminded of two stories I have seen on television programs (I watch Discovery Health a lot—so much so that I have seen most of the programs they show).
In Untold Stories of the ER, a man came in with his hand cut off. He refused medical care. He would not let the doctors attempt to sew his hand back on. Upon the police entering his home to check for evidence (where his hand was found), they searched his computer. It seems that he had a paraphilia called “acrotomophilia” which is where one is sexually attracted to people with amputations. Although he wanted it to be done to himself—he had inflicted the wound on himself. After the doctor tried to reason with the man to have his hand sewed back on, the man would not let up. He did not want his hand sewed back on. I wonder if, years down the line, the man regretted his decision.
In another program (Mystery Diagnosis), a man had said that as a young boy, he had seen a single-legged war veteran amputee. He said that ever since then, he would do nothing but think about becoming an amputee. He lived his whole life thinking about it without doing anything about it. He then went to a psychiatrist and spoke of his desire to become an amputee. After some time, he eventually flew to Taiwan and got the surgery done. He, eventually, found happiness since he had done what he always wanted to.
While these stories are interesting they speak to something deep in the minds of the individuals who mutilate themselves or get surgery to otherwise healthy limbs.
Conclusion
Blacks are more likely than whites to receive amputations in affected limbs than whites and are less likely to receive treatments that may be able to save the affected limb (Holman et al, 2011; Hughes et al, 2013; Minc et al, 2017; Massada et al, 2018). Physician bias is a large driver of this. So, to better public health, we then must attempt to mitigate these biases that physicians have that lead to these kinds of disparities in healthcare. Medical and other kinds of racism have led to this disparity in amputations between blacks and whites. Thus, to attempt to mitigate this disparity, blacks must get the preventative care needed in order to save the affected limb and not immediately go for amputation. Thankfully, such disparities have been noticed and work is being done to decrease said disparities.
So race is a factor in the decision on whether or not to amputate a limb, and blacks are less likely to receive revascularization services.
“Mongoloid Idiots”: Asians and Down Syndrome
1700 words
Look at a person with Down Syndrome (DS) and then look at an Asian. Do you see any similarities? Others, throughout the course of the 20th century have. DS is a disorder arising from chromosomal defects which causes mental and physical abnormalities, short stature, broad facial profile, and slanted eyes. Most likely, one suffering from DS has an extra copy of chromosome 21—which is why the disorder is called “trisomy 21” in the scientific literature.
I am not aware if most “HBDers” know this, but Asians in America were treated similarly to blacks in the mid-20th century (with similar claims made about genital and brain size). Whites used to be said to have the biggest brains out of all of the races but this changed sometime in the 20th century. Lieberman (2001: 72) writes that:
The shrinking of “Caucasoid” brains and cranial size and the rise of “Mongoloids” in the papers of J. Philippe Rushton began in the 1980s. Genes do not change as fast as the stock market, but the idea of “Caucasian” superiority seemed contradicted by emerging industrialization and capital growth in Japan, Taiwan, Hong Kong, Singapore, and Korea (Sautman 1995). Reversing the order of the first two races was not a strategic loss to raciocranial hereditarianism, since the major function of racial hierarchies is justifying the misery and lesser rights and opportunities of those at the bottom.
So Caucasian skulls began to shrink just as—coincidentally, I’m sure—Japan began to get out of its rut it got into after WWII. Morton noted that Caucasians had the biggest brains with Mongoloids in the middle and Africans with the smallest—then came Rushton to state that, in fact, it was East Asians who had the bigger brains. Hilliard (2012: 90-91) writes:
In the nineteenth century, Chinese, Japanese, and other Asian males were often portrayed in the popular press as a sexual danger to white females. Not surprising, as Lieberman pointed out, during this era, American race scientists concluded that Asians had smaller brains than whites did. At the same time, and most revealing, American children born with certain symptoms of mental retardation during this period were labeled “mongoloid idiots.” Because the symptoms of this condition, which we now call Down Syndrome, includes “slanting” eyes, the old label reinforced prejudices against Asians and assumptions that mental retardation was a peculiarly “mongoloid” racial characteristic.
[Hilliard also notes that “Scholars identified Asians as being less cognitively evolved and having smaller brains and larger penises than whites.” (pg 91)]
So, views on Asians were different back in the 19th and 20th centuries—it even being said that Asians had smaller brains and bigger penises than whites (weird…).
Mafrica and Fodale (2007) note that the history of the term “mongolism” began in 1866, with the author distinguishing between “idiotis”: the Ethiopian, the Caucasian, and the Mongoloid. What led Langdon (the author of the 1866 paper) to make this comparison was the almond-shaped eyes that DS people have as well. Though Mafrica and Fodale (2007: 439) note that it is possible that other traits could have forced him to make the comparison, “such as fine and straight hair, the distribution of apparatus piliferous, which appears to be sparse.” Mafrica and Fodale (2007: 439) also note more similarities between people with DS and Asians:
Down persons during waiting periods, when they get tired of standing up straight, crouch, squatting down, reminding us of the ‘‘squatting’’ position described by medical semeiotic which helps the venous return. They remain in this position for several minutes and only to rest themselves this position is the same taken by the Vietnamese, the Thai, the Cambodian, the Chinese, while they are waiting at a the bus stop, for instance, or while they are chatting.
There is another pose taken by Down subjects while they are sitting on a chair: they sit with their legs crossed while they are eating, writing, watching TV, as the Oriental peoples do.
Another, funnier, thing noted by Mafrica and Fodale (2007) is that people with DS may like to have a few plates across the table, while preferring foodstuffs that is high in MSG—monosodium glutamate. They also note that people with DS are more likely to have thyroid disorders—like hypothyroidism. There is an increased risk for congenital hypothyroidism in Asian families, too (Rosenthal, Addison, and Price, 1988). They also note that people with DS are likely “to carry out recreative–reabilitative activities, such as embroidery, wicker-working ceramics, book-binding, etc., that is renowned, remind the Chinese hand-crafts, which need a notable ability, such as Chinese vases or the use of chop-sticks employed for eating by Asiatic populations” (pg 439). They then state that “it may be interesting to know the gravity with which the Downs syndrome occurs in Asiatic population, especially in Chinese population.” How common is it and do they look any different from other races’ DS babies?
See, e.g., Table 2 from Emanuel et al (1968):

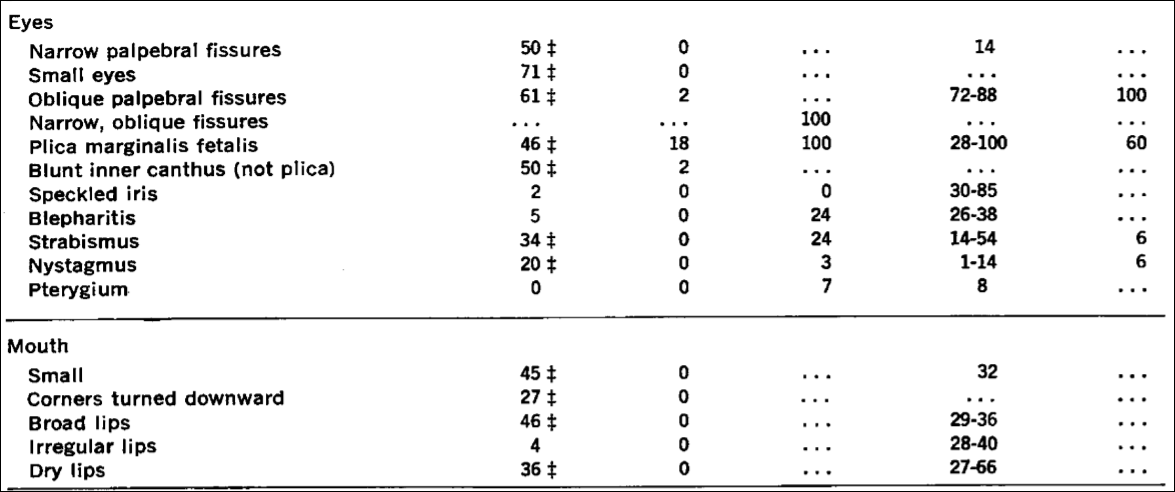


Emanuel et al (1968: 465) write that “Almost all of the stigmata of Down’s syndrome presented in Table 2 appear also to be of significance in this group of Chinese patients. The exceptions have been reported repeatedly, and they all probably occur in excess in Down’s syndrome.”
Examples such as this are great to show the contingencies of certain observations—like with racial differences in “intelligence.” Asians, today, are revered for “hard work”, being “very intelligent” and having “low crime rates.” But, even as recently as the mid 20th century—going back to the mid 18th century—Asians (or Mongoloids, as Rushton calls them) were said to have smaller brains and larger penises. Anti-miscegenation laws held for Asians, too of course, and so interracial marriage was forbidden with Asians and whites which was “to preserve the ‘racial integrity’ of whites” (Hilliard, 2012: 91).
Hilliard (2012) states that the effeminate, small-penis Asian man. Hilliard (2012: 86) writes:
However, it is also possible that establishing the racial supremacy of whites was not what drove this research on racial hierarchies. If so, the IQ researchers were probably justified in protesting their innocence, at least in regard to the charge of being racial supremacists, for in truth, the Asians’ top ranking might have unintentionally underscored that true sexual preoccupations underlying this research in the first place. It not seems that the real driving force behind such work was not racial bigotry so much as it was the masculine insecurities emanating from the unexamined sexual stereotypes still present within American popular culture. Scholars such as Rushton, Jensen, and Herrnstein provided a scientific vocabulary and mathematically dense charts and graphs to give intellectual polish to the preoccupations. Thus, it became useful to tout the Asians’ cognitive superiority but only so long as whites remained above blacks in the cognitive hierarchy.
Of course, by switching the racial hierarchy—but keeping the bottom the same—IQ researchers can say “We’re not racists! If we were, why would we state that Asians were better on trait T than we were!”, as has been noted by John Relethford (2001: 84) who writes that European-descended researchers “can now deflect charges of racism or ethnocentrism by pointing out that they no longer place themselves at the top. Lieberman aptly notes that this shift does not affect the major focus of many ideas regarding racial superiority that continue to place people of recent African descent at the bottom.” While biological anthropologist Fatima Jackson (2001: 83) states that “It is deemed acceptable for “Mongoloids” to have larger brains and better performance on intelligence tests than “Caucasoids,” since they are (presumably) sexually and reproductively compromised with small genitalia, low fertility, and delayed maturity.”
The main thesis of Straightening the Bell Curve is that preoccupations with brain and genital size is a driving part of these psychologists who study racial differences. Stating that Asians had smaller penises but larger heads though they were less likely to like sex while blacks had larger penises, smaller heads and were more likely to like sex while whites were, like Goldilocks, juuuuuust right—a penis size in-between Asians and blacks and a brain neither too big or too small. So, stating that X race had smaller brains and bigger penises seems, as Hilliard argues, to be a coping mechanism for certain researchers and to drive women away from that racial group.
In any case, how weird it is for Asians (“Mongoloids”) to be ridiculed as having small brains and large penises (a hilarious reversal of Rushton’s r/K bullshit) and then—all of a sudden—for them to come out on top over whites while whites are still over blacks in this racial hierarchy. How weird is it for the placements to change with certain economic events in a country’s history. Though, as many authors have noted, for instance Chua (1999), Asian men have faced emasculinazation and femininzation in American society. So, since they were seen to be “undersexed, they were thus perceived as minimal rivals to white men in the sexual competition for women” (Hilliard, 2012: 87).
So, just like the observation of racial/country IQ are contingent on the time and the place of the observation, so too is the observation of racial differences in certain traits and how they can be used for a political agenda. As Constance Hilliard (2012: 85) writes, referring to Professor Michael Billig’s article A dead idea that will not lie down (in reference to race science), “… scientific ideas did not develop in a vacuum but rather reflected underlying political and economic trends.“ And so, this is why “mongoloid idiots” and undersexed Asians appeared in American thought in the mid-20th century. So these ideas noted here—mongloidism, undersexed Asians, small penis, large penis, small brain, large brained Asians (based on the time and the place of the observation) show, again, the contingency of these racial hierarchies—which, of course, still stay with blacks on the bottom and whites above them. Is it not strange that whites moved a rung down on this hierarchy as soon as Rushton appeared in the picture? (Since, Morton noted that they had smaller heads than Caucasians, Lieberman, 2001.)
The origins of the term “mongloidism” are interesting—especially with how they tie into the origins of the term Down Syndrome and how they related to the “Asian look” along with all of the peculiarities of people with DS and (to Westerners), the peculiarities of Asian living. This is, of course, why one’s political motives, while not fully telling of their objectives and motivations, may—in a way—point one in the right direction as to why they are formulating such hypotheses and theories.
Race/Ethnic Differences in Dentition
1300 words
Different groups of people eat different things. Different groups of people also differ genetically. What one eats is part of their environment. So, there is a G and E (genes and environment) interaction between races/ethnies in regard to the shape of their teeth. Yes, one can have a different shape to their teeth, on average, compared to their co-ethnics if they eat different things from them as that is one thing that shapes the development of teeth.
It is very difficult to ascertain the race of an individual through their dentition, but there are certain dental characters which can lead to the identification of race. Rawlani et al (2017) show that there are differences in the dentition of Caucasians, Negroids, Mongoloids and Australoids.
One distinct difference that Monogloid teeth have is having a “shovel” or “scoop” appearance. They also have larger incisors than Caucasoids, while having shorter anatomic roots with better-developed trunks. Caucasoids had a “v” shape to their teeth, while their anterior teeth were “chisel shaped”; 37 percent of Caucasoids had a cusp on the carabelli cusp. Rawlani et al (2017) also note that one study found that 94 percent of Anglo-Saxons had four cusps compared to five for other races. Australoids had a larger arch size (but relatively smaller anterior teeth), which accommodates larger teeth. They have the biggest molars of any race; the mesiodistal diameter of the first molar is 10 percent larger than white Americans and Norweigian Lapps. Negroids had smaller teeth with more spacing, they are also less likely to have the Carabelli cusp and shovel incisors. They are more likely to have class III malocclusion (imperfect positioning of the teeth when the jaw is closed) and open bite. Blacks are more likely to have bimaxillary protrusion, though Asians do get orthodontic surgery for it (Yong-Ming et al, 2009).
Rawlani et al’s (2017) review show that there are morphologic differences in teeth between racial groups that can be used for identification.
When it comes to the emergence of teeth, American Indians (specifically Northern Plains Indians) had an earlier emergence of teeth compared to whites and blacks. American Indian children had a higher rate of dental caries, and so, since their teeth appear at an earlier age compared to whites and blacks, they had more of a chance for their teeth to be exposed to diets high in sugar and processed foods along with lack of oral hygiene (Warren et al, 2016).
Older blacks had more decayed teeth than whites in one study (Hybels et al, 2016). Furthermore, older blacks were more likely than older whites to self-report worse oral hygeine; blacks had a lower number of teeth than whites in this study—which was replicated in other studies—though differences in number of teeth may come down to differences in access to dental care along with dental visits (Huang and Park, 2016). One study even showed that there was unconscious racial bias in regard to root canal treatments: whites were more likely to get root canals (i.e., they showed a bias in decision-making favoring whites), whereas blacks were more likely to get the tooth pulled (Patel et al, 2018).
Kressin et al (2003) also show that blacks are less likely to receive root canals than whites, while Asians were more likely, which lends further credence to the claim of unconscious racial bias. So just like unconscious bias affects patients in regard to other kinds of medical treatment, the same is true for other doctors such as dentists: they have a racial bias which then affects the care they give their patients. Gilbert, Shewchuk, and Litaker (2006) also show that blacks are more likely to have tooth extractions when compared to other races, but people who went to a practice that had a higher percentage of black Americans were more likely to have a tooth extraction, regardless of the individual’s race. This says to me that, since there is unconscious bias in tooth extraction (root canals), that the more black patients a dentist sees the more it is likely that they would extract the tooth of the patient (regardless of race), since they would do that more often than not due to the number of patients they see that are black Americans.
Otuyemi and Noar (1996) showed that Nigerian children had larger mesio-distal crown diameters compared to Briton children. American blacks are more likely to have hyperdontia (extra teeth in the mouth) compared to whites, and are also more likely to have fourth molars and extra premolars (Harris and Clark, 2008). Blacks have slightly larger teeth than whites (Parciak, 2015).
Dung et al (2019) also note ethnic differences in teeth looking at four ethnic groups in Vietnam:
Our study of 4565 Vietnamese children of four ethnic groups (Kinh, Tay, Thai and Muong) showed that most dental arch indicators in males were statistically significantly higher than those in females.
[…]
In comparison to other ethnic groups, 12-year-old Vietnamese children had similar dimensions of the upper and lower intercanine and intermolar width to children in the same age group in South China. However, the average upper posterior length 1 and lower posterior length 1 were shorter than those in Africans (Kenyan) and Caucasian (American blacks aged 12). The 12-year-old Vietnamese have a narrower and shorter dental arch than Caucasian children, especially the maxillary, and they need earlier orthodontic intervention.
The size of the mandible reflects the type of energy ingested: decreases “in masticatory stress among agriculturalists causes the mandible to grow and develop differently” (Cramon-Taubadel, 2011). This effect would not only be seen in an evolutionary context. Cramon-Taubadel (2011) writes:
The results demonstrate that global patterns of human mandibular shape reflect differences in subsistence economy rather than neutral population history. This suggests that as human populations transitioned from a hunter-gatherer lifestyle to an agricultural one, mandibular shape changed accordingly, effectively erasing the signal of genetic relationships among populations.
So it seems like the change from a hunter-gatherer lifestyle to one based on plant/animal domestication had a significant effect on the mandible—and therefore teeth—of a population.
So teeth are a bone, and bones adapt. When an individual is young, the way their teeth, and subsequently jaw, are can be altered by diet. Eating hard or soft foods during adolescence can radically change the shape of the teeth (Liebermann, 2013). The harder the stuff one has to chew on will alter their facial morphology (i.e., their jaw and cheekbones) and, in turn, their teeth. This is because the teeth are bones and any stress put on them will change them. This, of course, speaks to the interaction of G and E (genes and environment). There are genes that contribute to differences in dental morphology between populations, and they impact the difference between ethnic/racial groups.
Further making the differences between these groups is what they choose to eat: the hardness or softness of the food they eat in adolescence and childhood can and will dictate the strength of one’s jaw and shape and strength of their teeth in adulthood, though racial/ethnic identification would still be possible.
Racial differences in dentition come down to evolution (development) and what and how much of the population in question eats. The differences in dentition between these populations are, in a way, dictated by what they eat in the beginning years of life. This critical period may dictate whether or not one has a strong or weak jaw. These differences come down to, like everything else, an interaction between G and E (genes and environment), such as the food one eats as an adolescent/baby which would then affect the formation of teeth in that individual. Of course, in countries that have a super-majority of one ethnic group over another, we can see what diet does to an individual in an ethnic group’s teeth.
There are quite striking differences in dentition between races/ethnic groups, and this can and will (along with other variables) lead to correctly identifying the race of an individual in question.
Race, Medicine, and Epigenetics: How the Social Becomes Biological
2050 words
Race and medicine is a tendentious topic. On one hand, you have people like sociologist Dorothy Roberts (2012) who argues against the use of race in a medical context, whereas philosopher of race Michael Hardimon thinks that we should not be exclusionists about race when it comes to medicine. If there are biological races, and there are salient genetic differences between them, then why should we disregard this when it comes to a medically relevant context? Surely Roberts would agree that we use her socio-political concept of race when it comes to medicine, but not treat them like biological races. Roberts is an anti-realist about biological races, whereas Hardimon is not—he recognizes that there is a minimalist and social aspect to race which are separate concepts.
In his book Rethinking Race: The Case for Deflationary Realism, Hardimon (2017, Chapter 8) discusses race and medicine after discussing and defending his different race concepts. If race is real—whether socially, biologically, or both—then why should we ignore it when it comes to medical contexts? It seems to me that many people would be hurt by such a denial of reality, and that’s what most people want to prevent, and which is the main reason why they deny that races exist, so it seems counterintuitive to me.
Hardimon (2017: 161-162; emphasis his) writes:
If, as seems to be the case, the study of medically relevant genetic variants among races is a legitamate project, then exclusionism about biological race in medical research—the view that there is no place for a biological concept of race in medical research—is false. There is a place for a biological concept of race in the study of medically relevant genetic variants among races. Inclusionism about biological race in medical research is true.
So, we should not be exclusionists (like Roberts), we should be inclusionists (like Hardimon). Sure, some critics would argue that we should be looking at the individual and not their racial or ethnic group. But consider this: Imagine that an individual has something wrong and standard tests do not find out what it is. The doctor then decides that the patient has X disease. They then treat X disease, and then find out that they have Y disease that a certain ethnic group is more likely to have. In this case, accepting the reality of biological races and its usefulness in medical research would have caught this disease earlier and the patient would have gotten the help they needed much, much sooner.
Black women are more likely to die from breast cancer, for example, and racism seems like it can explain a lot of it. They have less access to screening, treatment, care, they receive delays in diagnoses, along with lower-quality treatment than white women. But “implicit racial bias and institutional racism probably play an important role in the explanation of this difficult treatment” (Hardimon, 2017: 166). Furthermore, black women are more than twice as likely to acquire a type of breast cancer called “triple negative” breast cancer (Stark et al, 2010; Howlader et al, 2014; Kohler et al, 2015; DeSantis et al, 2019). Of course, this could be a relevant race-related genetic difference in disease.
We should, of course, use the concepts of socialrace when discussing the medical effects of racism (i.e., psychosocial stress) and the minimalist/populationist race concepts when discussing the medically relevant race-related genetic diseases. Being eliminativist about race doesn’t make sense—since if we deny that race exists at all and do not use the term at all anymore, there would be higher mortality for these “populations.” Thus, we should use both of Hardimon’s terms in regard to medicine and racial differences in health outcomes as both concepts can and will show us how and why diseases are more likely to appear in certain racial groups; we should not be eliminativists/exclusionists about race, we should be inclusionists.
Hardimon discusses how racism can manifest itself as health differences, and how this can have epigenetic effects. He writes (pg 155-156):
As philosopher Shannon Sullivan explains, another way in which racism may be shown to influence health is by causing epigenetic changes in the genotype. It is known that changes in gene expression can have durable and even transgenerational effects on health, passing from parents to their children and their children’s children. This suggests that the biological dimensions of racism can replicate themselves across more than one generation through epigenetic mechanisms. Epigenetics, the scientific study of such changes, explains how the process of transgenerational biological replication of ill health can occur without changes in the underlying DNA sequence.
If such changes to the DNA sequences can be transmitted to the next generation in the developmental system, then that means that the social can—and does—has an effect on our biology and that it can be passed down through subsequent generations. It is simple to explain why this makes sense: for if the developing organism was not plastic, and genes could not change based on what occurs in the environment for the fetus or the organism itself, then how could organisms survive when the environment changes if the “genetic code” of the genome were fixed and not malleable? For example, Jasienska (2009) argues that:
… the low birth weight of contemporary African Americans not only results from the difference in present exposure to lifestyle factors known to affect fetal development but also from conditions experienced during the period of slavery. Slaves had poor nutritional status during all stages of life because of the inadequate dietary intake accompanied by high energetic costs of physical work and infectious diseases. The concept of ‘‘fetal programming’’ suggests that physiology and metabolism including growth and fat accumulation of the developing fetus, and, thus its birth weight, depend on intergenerational signal of environmental quality passed through generations of matrilinear ancestors.
If the environmental quality—i.e., current environmental quality—is “known” by the developing fetus through cues from the mother’s nutrition, stress etc, then a smaller body size may be adaptive in that certain environment and the organism may survive with fewer resources due to smaller body size. In any case, I will discuss this in the future but it was just an example of a possible epigenetic modification on current slaves. I, personally, have noticed that a lot of blacks are really skinny and have really low body fat—who knows, maybe this could be part of the reason why?
This is something that sociologist Maurizio Meloni (2018) calls “the postgenomic body”—the fact that biology is malleable through what occurs in our social lives. So not only is the human brain plastic, but so is the epigenome and microbiome, which is affected by diet and lifestyle—along with what we do and what occurs to us in our social lives. So our social lives, in effect, can become embodied in our epigenome and passed down to subsequent generations. Similar points are also argued by Ulijaszek, Mann, and Elton (2012). (Also see my article Nutrition, Development, Epigenetics, and Physical Plasticity.)So in effect, environments are inherited too, and so, therefore, the environments that we find ourselves in are, in effect, passed down through the generations. Meloni (2018) writes:
On the other hand, by re-embedding the individual within a wider lineage of ancestral experiences and reconfiguring it as a holobiontic assemblage, it may literally dissolve the subject of emancipation. Moreover, the power of biological heredity may be so expanded (as it includes potentially any single ancestral experience) to become stronger than in any previous genetic view. Finally, the several iterations of plasticity that emerge from this genealogy appear so deeply racialized and gendered that it is difficult to quickly turn them into an inherently emancipatory concept. Even as a concept, plasticity has an inertial weight and viscosity that is the task of the genealogist to excavate and bring into view.
Thus, current biological states can be “tagged” and therefore be epigenetically transmitted to future generations. Think about it in this way: if epigenetic tags can be transmitted to the next generation then it would be presumed that that environment—or a similar one—would be what newer generations would be born in. Thus, the plasticity of the organism would help it in life, especially the immediate plasticity of the organism in the womb. Likewise, Kuzawa and Sweet (2008) argue:
that environmentally responsive phenotypic plasticity, in combination with the better-studied acute and chronic effects of social-environmental exposures, provides a more parsimonious explanation than genetics for the persistence of CVD disparities between members of socially imposed racial categories.
Of course, if we look at race as both a biological and social category (i.e., Spencer, 2014), then this is not surprising that differences in disease acquisition can persist “between members of socially imposed racial categories.” Phenotypic plasticity is the big thing here, as noted by many authors who write about epigenetics. If the organism is plastic (if it can be malleable and change depending on external environmental cues), then disease states can—theoretically—be epigenetically passed to future generations. This is just like Jasienska’s (2009, 2013, Chapter 5) argument that the organism—in this case, the fetus—can respond to the environmental quality that it is developing in and, therefore, differences in anatomy and physiology can and do occur based on the plasticity of the organism.
Lastly, Jan Badke, author of Above the Gene, Beyond Biology: Toward a Philosophy of Epigenetics (Baedke, 2018), argues that, since the gene-centered view of biology has been upended (i.e., Jablonka and Lamb, 2005; Noble, 2006, 2011, 2012, 2017) for a postgenomic view (Richardson and Stevens, 2015). Genes are not closed off from the environment; all organisms, including humans, are open systems and so, there are relationships between the environment, developmental system, and the genome which affect the developing organism. Baedke and Delgado (2019) argue that the “colonial shadow … biologicizes as well as racializes social-cultural differences among human groups.” Since every race faces specific life challenges in its environment, therefore, each race shows a “unique social status that is closely linked to its biological status.” Thus, differing environments, such as access to different foods (i.e., the effects of obesifying foods) and discrimination can and are passed down epigenetically. Baedke and Delgado (2019: 9) argue that:
… both racial frameworks nutrition plays a crucial role. It is a key pathway over which sociocultural and environmental difference are embodied as racial difference. Thus, belonging to a particular race means having a particular biosocial status, since races include two poles – a social status (e.g., class, socio-economic status) and a biological status (disease susceptibility) – which are closely interlinked. Against this background, human populations in Mexico become an exemplar of types of bodies that are not only relocated to a destabilizing modernized world in which they suffer from socio-economic deprivation. What is more, they become paradigmatic primitive bodies that are unbalanced, biologically deprived, and sick. In short, in these recent epigenetic studies poor places and lifestyles determine poor bodies, and vice versa.
In sum, accepting the reality of race—both in a minimalist/populationist biological manner and social manner—can and will help us better understand disease acquisition and differing levels of certain diseases between races. Recognizing the minimalist/populationist concepts of race will allow us to discover genetic differences between races that contribute to variation in different diseases—since genes do not alone outright cause diseases (Kampourakis, 2017: 19). Being eliminativist/exclusionist about race does not make sense, and it would cause much more harm than good when it comes to racial disease acquisition and mortality rates.
Furthermore, acknowledging the fact that the social dimensions of race can help us understand how racism manifests itself in biology (for a good intro to this see Sullivan’s (2015) book The Physiology of Racist and Sexist Oppression, for even if the “oppression” is imagined, it can still have very real biological effects that could be passed onto the next generation—and it could particularly affect a developing fetus, too). It seems that there is a good argument that the effects of slavery could have been passed down through the generations manifesting itself in smaller bodies; these effects also could have possibly manifested itself in regard to obesity in Latin America post-colonialism. Gravlee (2009) and Kaplan (2010) also argue that the social, too, manifests itself in biology.
(For further information on how the social can and does become biological see Meloni’s (2019) book Impressionable Biologies: From the Archaeology of Plasticity to the Sociology of Epigenetics, along with Meloni (2014)‘s paper How biology became social, and what it means for social theory. Reading Baedke’s and Meloni’s arguments on plasticity and epigenetics should be required before discussing these concepts.)
Race and Menarche
1100 words
Back in 2016 I wrote about racial differences in menarche and how there is good evidence that leptin is a strong candidate for the cause in my article Leptin and its Role in the Sexual Maturity of Black Girls (disregard the just-so stories). Black girls are more likely to hit puberty at a younger age than white girls. Why? One reason may be that leptin may play a role in the accelerated growth and maturation of black girls, since there was a positive relationship between leptin concentration and obesity in black girls (Wagner and Heyward, 2000). When girls start to develop at younger and younger ages, a phrase you hear often is “It’s the chemicals in the food” in regard to, for example, early breast development on a young, pre-teen girl.
Black girls are more likely to be obese than white girls (Freedman et al, 2000) and it is thought that body fat permits the effects of earlier menarche due to leptin being released from the adipocyte (fat cell) (Salsberry, Reagen, and Pajer, 2010). Freedman et al (2000) showed that black girls experienced menarche 3 months earlier than white girls on average, while over a 20 year period the median age decreased by 9.5 months. There is also evidence of earlier thelarche (breast development) in black girls, which was mediated by gonadotropin (Cabrera et al, 2014). Wong et al (1998) found that circulating serum leptin levels were correlated with earlier menarche in black girls which was related to body fatness and age but lessened after fat mass, maturation and physical fitness. There is a ton of evidence that exists that body fatness is related to obesity and, as I said above, the mechanism is probably fat cells releasing leptin, permitting earlier menarche (see Kaplowitz, 2008). Higher levels of body fat cause earlier menarche; earlier menarche does not cause higher levels of body fat. The evidence is there that leptin indeed plays the permissive role to allow a girl to enter into puberty earlier, and that this is how and why black girls enter menarche earlier than white girls.
So when fat mass increases, so does leptin; when leptin increases, girls have puberty at an earlier age (Apter, 2009). Black girls have higher levels of circulating leptin than white girls (Ambrosious et al, 1998). So knowing the relationship between leptin and obesity and how fat cells release leptin into the body permissing earlier puberty, we can confidently say that leptin is a major cause of earlier pubertal development in black girls. Total body fat correlates with fasted leptin (Ebenibo et al, 2018).
Siervogel et al (2003) write:
A negative relationship between age at menarche, BMI and body fatness in girls has been shown [63, 64, 65]. It is still unclear, however, whether increased early childhood adiposity induces an earlier onset of puberty, if rapid maturation and early puberty induce an increase in body fat later in life, or whether both of these phenomena occur.
The average age of menarche in black girls was 12 years of age whereas for white girls it was 12.5 (Regan et al, 2013). Since we now know the causes of earlier menarche, we can talk about ultimate causation.
Since menarche is correlated with obesity and circulating leptin levels, then food quality would be an easy culprit to look at.
Deardorff et al (2014) write:
Three sets of findings stood out. One, grandmother’s lower education was related to later menarche for Black girls. Two, mother’s unmarried status (at birth and age 7) was associated with earlier menarche for Hispanics and Whites, but not for Blacks. Three, family income at child’s birth was related to earlier menarche for Blacks and Hispanics, but not Whites.
Lower family income at birth was associated with earlier menarche for Blacks (and to some extent for Hispanics), but not for white girls.
Deardorff et al’s (2014) study suggests that social determinants of health can be intervened upon and differences in pubertal timing can be ameliorated since they are driven by social factors.
Black children have higher levels of insulino-glucose ratios than white children, even after adjusting for confounds (Wong et al, 1999). There were similar findings when comparing normal-weight black and white girls matched for age, bone age, weight, and BMI. Black girls also had higher levels of insulin than white girls. Black girls grow faster than white girls beginning at 2 years of age, with the cause hypothesized to be “higher serum insulin concentrations in healthy African American girls suppress the hepatic production of IGFBP-1, which results in higher circulating concentrations of free IGF-I, contributing to the accelerated growth observed in African American girls compared with their white counterparts” (Wong et al, 1999: 297).
Wong et al (1999) found that black girls were older and more sexually mature than white girls according to the Tanner stages of development (using pubic hair as a measure). Even after adjusting for age, black girls were still more sexually mature, heavier, and had higher levels of fat-free mass. Both serum insulin levels and serum concentrations of IGF-1 were significantly higher in black girls compared to white girls. Even after they controlled for differences in pubic hair development and fat mass, the differences in IGF-1 and IGFBP-1 remained significant. So black girls in this study had higher levels of IGF-1 and insulin than white girls.
This is significant because higher levels of IGF-1 at age 8 are associated with earlier menarche in girls (Thankamoney et al, 2012). Earlier menarche is related to higher levels of adiposity, as noted above, and the mechanism for earlier menarche is fat cells releasing insulin which has a permissive effect on menarche. Further, there is evidence that lower levels of circulating growth hormones are related to delayed menarche (Circo, 2014).
IGF-1 is a protein “coded for” by the IGF-1 gene (Hoppener et al, 1985). IGF-1 is molecularly similar to insulin (Laron, 2001). This makes sense. Body fat cannot be stored unless insulin is high; since they are molecularly similar, they both cause growth, albeit in different ways.
In conclusion, there is strong evidence that body fatness is related to earlier menarche, with the mechanism being fat cells releasing leptin which has a permissive effect on pubertal development. Further evidence indicates that circulating hormones like insulin and IGF-1 also have permissive effects on pubertal development. Black girls are more likely to be obese than white girls. Black girls are more likely to have higher levels of circulating hormones like IGF-1 and insulin than white girls. Thus, a cause—a major cause in my opinion—for earlier menarche in black girls compared to white girls is higher levels of body fat and higher levels of circulating hormones like IGF-1 and insulin which have a permissive effect on menarche.
Racial Differences in the Palmaris Longus
1050 words
There are many physical differences between racial/ethnic groups. Some of these differences are obvious to the naked eye, others much less so. One racial difference that exists is variation in having a tendon called the palmaris longus (PL). This muscle rests between the flexor carpi radialis and the flexor carpi urinalis. The radius and ulna are bones in the forearm. The radius supports the lateral (thumb) side of the hand whereas the ulna supports the medial (pinky) side; they enable wrist rotation. To see if you have the tendon, take your pinky and touch it to your thumb. If you have the tendon you should see it poking out of your wrist. Fourteen percent of the population lacks the PL, but there is considerable variation by race. These differences, of course, have should be taken into account when doing a tendon graph operation.
The action that the PL performs is flexing the wrist; the origin is the medial epicondyle of the humerus; it inserts in the palmar aponeurosis and flexor rentinaculum of the hand. The antagonist muscles are extensor carpi radialis brevis, extensor carpi radialis longus, and extensor carpi urinalis.
There are unilateral (affecting one side of the body) differences in the variation of this tendon along with bilateral (affecting both sides of the body) differences. There is differential absence of the tendon depending on which hand is dominant (Eric et al, 2011). The tendon also has been found to contribute to the strength of thumb abuction (Gangata, Ndou, and Louw, 2013). However, it has been shown that whether or not one has the PL or not does not contribute to grip/pinch strength (Sebastin et al, 2005).
Soltani et al (2012) followed patients at hand surgery clinics LA county +University of Southern California Medical Center and Keck Medical Center of the University of Southern California. Their objective was to observe the variation in the PL in regard to race, sex and ethnicity (indeed, they placed people into races based on the US Census designations; see Spencer, 2014, they excluded mixed-race people from the ethnicity part of the analysis). They wanted to see the extent that the PL was missing and whether or not it was bilateral or unilateral. They evaluated a group of 516 multi-ethnic individuals while age, race, ethnicity and sex was accounted for. They then administered the Schaeffer test:
![]()
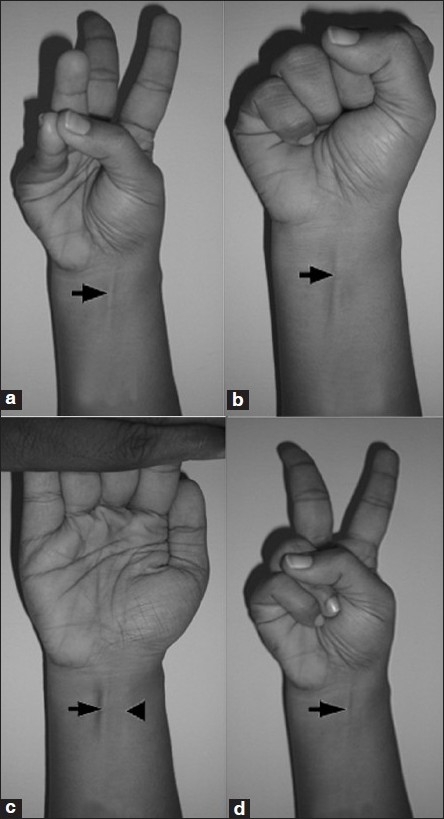
Obviously, this only works with lean individuals. So obese patients needed to get an ultrasound to ascertain whether or not they had the tendon.
In their sample of 516, 415 were Caucasian, 55 were African American, 35 were Asian and 11 were mixed race. The age range was 12-94, while an even number of men and women were tested (288, 288). Soltani et al (2012) write:
There were no differences in the absence of the PL based on laterality. The right side was absent in 11.8% and left 12.0% of the time (see Table 1). Further, there were no differences in the absence of the PL based on gender, value 0.369 (see Table 2). Ethnically, there was no difference in the absence of the PL between White (non-Hispanic) and White (Hispanic) patients, with prevalence of 14.9% and 13.1%, respectively. However, African American (4.5%) and Asian (2.9%) patients had significantly fewer absences of the PL than the Hispanic reference group.
They then write in the discussion that this has implications for plastic surgery—this anatomic variation between the races has implications for surgery:
This is information that should be taken into account preoperatively when planning surgical algorithms in treating tendon injuries or palsy. The PL is one such option as a tendon transfer for opponensplasty in restoring intrinsic function in cases of recurrent median nerve injury. If the PL is absent on the affected side, it is important to know preoperatively to plan using another donor muscle such as the extensor indicis proprius. In our study, the African American population had a statistically significantly lower rate of absent PL (4.5%), which is radically different than previously published reports from Nigeria, where the absence rates were much higher (31%). This could be due to the ethnic heterogeneity of the African American population of the United States compared to the Nigerian population. Nevertheless, the PL is present in high likelihood in this particular ethnic group which bodes well for using the PL in a surgical scenario. The PL is used quite frequently in cases of secondary tendon reconstruction, and it is useful for the surgeon to be aware of that issue preoperatively for surgical safety and efficiency in harvesting the tendon graft. The patient needs to be aware of the location of possible surgical incisions for tendon harvesting. Further, the surgeon should examine all possible tendon donors preoperatively, and one’s suspicion might be heightened by knowing the patient’s ethnicity. This is particularly important for the White population which in our study had the highest rates of absence, in both the Hispanic and non-Hispanic subsets. The surgeon must be aware in these patients that it is more likely that the PL might be absent. Thus, in Caucasian patients, it is particularly important to have a thorough examination of possible tendon donor sites.
Touching on the point of there being no difference between having or not having a PL and grip/pinch strength: we should not expect that, since whites dominate strength competitions (and the Chinese powerlifters are no slouches either, look at some videos of them). So, just because whites have a higher prevalence of not having the tendon does not mean that they do not have a strong hand grip. Indeed, senior blacks did have a stronger hand grip than whites (Araujo et al, 2010), but the PL is not the cause of the slightly higher hand grip strength (this was seen in a Turkish study; Setin et al, 2013). However, tennis players need a strong grip and the PL is more likely to be found in elite tennis players over the recreational athletes (Vercruyssen, Scafoglieri, and Cattrysse, 2016). But Nekkanti et al (2018) conclude that “There was no statistically significant correlation between agenesis of PL and the mean hand grip. Right-handed dominant individuals had a higher incidence of PL.”
In sum, this is tendon varies by race/ethnicity/sex/handedness like many other traits. understanding these differences will lead to a better understanding of plastic surgery in regard to the tendon. There is a racial difference, but it is of no functional relevance in regard to hand grip/power/strength sports.
Muscle Fibers, Obesity, Cardiometabolic Disorders, and Race
2650 words
The association between muscle fiber typing obesity and race is striking. It is well-established that blacks have a higher proportion of type II skeletal muscle fibers than whites and these higher proportions of these specific types of muscle fibers lead to physiological differences between the two races which then lead to differing health outcomes between them—along with differences in athletic competition. Racial differences in health are no doubt complex, but there are certain differences between the races that we can look at and say that there is a relationship here that warrants further scrutiny.
Why is there an association between negative health outcomes and muscle phsyiology? The answer is very simple if one knows the basics of muscle physiology and how and why muscles contract (it is worth noting that out of a slew of anatomic and phsyiologic factors, movement is the only thing we can consciously control, compare to menstration and other similar physiologic processes which are beyond our control). In this article, I will describe what muscles do, how they are controlled, muscle physiology, the differences in fiber typing between the races and what it means for health outcomes between them.
Muscle anatomy and physiology
Muscle fiber number is determined by the second trimester. Bell (1980) noted that skeletal muscle fiber in 6 year olds is not different from normal adult tissue, and so, we can say that between the time in the womb and age 6, muscle fiber type is set and cannot be changed (though training can change how certain fibers respond, see below).
Muscle anatomy and physiology is interesting because it shows us how and why we move the way we do. Tendons attach muscle to bone. Attached to the tendon is the muscle belly. The muscle belly is made up of facsicles and the fascicles are made up of muscle fibers. Muscle fibers are made up of myofibrils and myofibrils are made up of myofilaments. Finally, myofilaments are made up of proteins—specifically actin and myosin, this is what makes up our muscles.

(Image from here.)
Muscle fibers are encased by sarcolemma which contains cell components such as sarcoplasm, nuclei, and mitochondria. They also have other cells called myofibrils which contain myofilaments which are then made up of actin (thin filaments) and mysoin (thick filaments). These two types of filaments form numerous repeating sections within a myofibril and each repeating section is known as a sarcomere. Sarcomeres are the “functional” unit of the muscle, like the neuron is for the nervous system. Each ‘z-line’ denotes another sarcomere across a myofibril (Franzini-Armstrong, 1973; Luther, 2009).
Other than actin and myosin, there are two more proteins important for muscle contraction: tropomyosin and troponin. Tropomyosin is found on the actin filament and it blocks myosin binding sites which are located on the actin filament, and so it keeps myosin from attaching to muscle while it is in a relaxed state. On the other hand, troponin is also located on the actin filament but troponin’s job is to provide binding sites for calcium and tropomyosin when a muscle needs to contract.
So the structure of skeletal muscle can be broken down like so: epymyseum > muscle belly > perimyseum > fascicle > endomyseum > muscle fibers > myofibrils > myofilaments > myosin and actin. Note diagram (C) from above; the sarcomere is the smallest contractile unit in the myofibril. According to sliding filament theory (see Cook, 2004 for a review), a sarcomere shortens as a result of the ‘z-lines’ moving closer together. The reason these ‘z-lines’ converge is because myosin heads attach to the actin filament which asynchronistically pulls the actin filament across the myosin, which then results in the shortening of the muscle fiber. Sarcomeres are the basic unit controlling changes in muscle length, so the faster or slower they fire depends on the majority type of fiber in that specific area.
But the skeletal muscle will not contract unless the skeletal muscles are stimulated. The nervous system and the muscular system communicate, which is called neural activiation—defined as the contraction of muscle generated by neural stimulation. We have what are called “motor neurons”—neurons located in the CNS (central nervous system) which can send impulses to muscles to move them. This is done through a special synapse called the neuromuscular junction. A motor neuron that connects with muscle fibers is called a motor unit and the point where the muscle fiber and motor unit meet is callled the neuromuscular junction. It is a small gap between the nerve and muscle fiber called a synapse. Action potentials (electrical impulses) are sent down the axon of the motor neuron from the CNS and when the action potential reaches the end of the axon, hormones called neurotransmitters are then released. Neurotransmitters transport the electrical signal from the nerve to the muscle.
Muscle fiber types
The two main categories of muscle fiber are type I and type II—‘slow’ and ‘fast’ twitch, respectively. Type I fibers contain more blood cappilaries, higher levels of mitochondria (which transforms food into ATP) and myoglobin which allows for an improved delivery of oxygen. Since myoglobin is similar to hemoglobin (the red pigment which is found in red blood cells), type I fibers are also known as ‘red fibers.’ Type I fibers are also smaller in diameter and slower to produce maximal tension, but are also the most fatigue-resistant type of fiber.
Type II fibers have two subdivisions—IIa and IIx—based on their mechanical and chemical properties. Type II fibers are in many ways the opposite of type I fibers—they contain far fewer blood cappilaries, mitochondria and myoglobin. Since they have less myoglobin, they are not red, but white, which is why they are known as ‘white fibers.’ IIx fibers have a lower oxidative capacity and thusly tire out quicker. IIa, on the other hand, have a higher oxidative capacity and fatigue slower than IIx fibers (Herbison, Jaweed, and Ditunno, 1982; Tellis et al, 2012). IIa fibers are also known as intermediate fast twitch fibers since they can use both anarobic and aerobic metabolism equally to produce energy. So IIx fibers are a combo of I and II fibers. Type II fibers are bigger, quicker to produce maximal tension, and tire out quicker.
Now, when it comes to fiber typing between the races, blacks have a higher proportion of type II fibers compared to whites who have a higher proportion of type I fibers (Ama et al, 1986; Ceaser and Hunter, 2015; see Entine, 2000 and Epstein, 2014 for reviews). Higher proportions of type I fibers are associated with lower chance of cardiovascular events, whereas type II fibers are associated with a higher risk. Thus, “Skeletal muscle fibre composition may be a mediator of the protective effects of exercise against cardiovascular disease” (Andersen et al, 2015).
Now that the basics of muscle anatomy and physiology are apparent, hopefully the hows and whys of muscle contraction and what different muscle fibers do are becoming clear, because these different fibers are distributed between the races in uneven frequencies, which then leads to differences in sporting performance but also differents in health outcomes.
Muscle fibers and health outcomes
We now know the physiology and anatomy of muscle and muscle fiber typing. We also know the differences between each type of skeletal muscle fiber. Since the two races do indeed differ in the percentage of skeletal muscle fiber possessed on average, we then should find stark differences in health outcomes, part of the reason being these differences in muscle fiber typing.
While blacks on average have a higher proportion of type II muscle fibers, whites have a higher proportion of type I muscle fibers. Noting what I wrote above about the differences between the fiber types, and knowing what we know about racial differences in disease outcomes, we can draw some inferences on how differences in muscle fiber typing between races/individuals can then affect disease seriousness/acquisition.
In their review of black-white differences in muscle fiber typing, Ceaser and Hunter (2015) write that “The longitudinal data regarding the rise in obesity indicates obesity rates have been highest among non-Hispanic Black women and Hispanic women.” And so, knowing what we know about fiber type differences between races and how these fibers act when they fire, we can see how muscle fiber typing would contribute to differences in disease acquisition between groups.
Tanner et al (2001) studied 53 women (n=28, lean women; and n=25, obese women) who were undergoing an elective abdominal surgery (either a hysterectomy or gastric bypass). Their physiologic/anatomic measures were taken and they were divided into races: blacks and whites, along with their obesity status. Tanner et al found that the lean subjects had a higher proportion of type I fibers and a lower proportion of type IIx fibers whereas those who were obese were more likely to have a higher proportion of type IIb muscle fibers.
Like other analyses on this matter, Tanner et al (2001) showed that the black subjects had a higher proportion of type II fibers in comparison to whites who had a higher proportion of type I fibers (adiposity was not taken into account). Fifty-one percent of the fiber typing from whites was type I whereas for blacks it was 43.7 pervent. Blacks had a higher proportion of type IIx fibers than whites (16.3 percent for whites and 23.4 for blacks). Lean blacks and lean whites, though, had a similar percentage of type IIx fibers (13.8 percent for whites and 15 percent for blacks). It is interesting to note that there was no difference in type I fibers between lean whites and blacks (55.1 percent for whites and 54.1 percent for blacks), though muscle fibers from obese blacks contained far fewer type I fibers compared to their white counterparts (48.6 percent for whites and 34.5 for blacks). Obese blacks’ muscle fiber had a higher proportion of type IIx fibers than obese whites’ fiber typing (19.2 percent for whites and 31 percent for blacks). Lean blacks and lean whites had a higher proportion of type I fibers than obese blacks and obese whites. Obese whites and obese blacks had more type IIx fibers than lean whites and lean blacks.
So, since type II fibers are insulin resistant (Jensen et al, 2007), then they should be related to glucose intloerance—type II diabetes—and blacks with ancestry from West Africa should be most affected. Fung (2016, 2018) shows that obesity is a disease of insulin resistance, and so, we can bring that same rationale to racial differences in obesity. Indeed, Nielsen and Christensen (2011) hypothesize that the higher prevalence of glucose intolerance in blacks is related to their lower percentage of type I fibers and their higher percentage of type II fibers.
Nielsen and Christensen (2011) hypothesize that since blacks have a lower percentage of type I fibers (the oxidative type), this explains the lower fat oxidation along with lower resting metabolic rate, sleeping metabolic rate, resting energy expenditure and Vo2 max in comparison to whites. Since type I fibers are more oxidative over the glycolitic type II fibers, the lower oxidative capacity in these fibers “may cause a higher fat storage at lower levels of energy intake than in individuals with a higher oxidative capacity” (Nielsen and Christensen, 2011: 611). Though the ratio of IIx and IIa fibers are extremely plastic and affected by lifestyle, Nielsen and Christensen do note that individuals with different fiber typings had similar oxidative capacity if they engaged in physical activity. Recall back to Caesar and Hunter (2015) who note that blacks have a lower maximal aerobic capacity and higher proportion of type II fibers. They note that lack of physical activity exacerbates the negative effects that a majority type II fibers has over majority type I. And so, some of these differences can be ameliorated between these two racial groups.
The point is, individuals/groups with a higher percentage of type II fibers who do not engage in physical activity have an even higher risk of lower oxidative capacity. Furthermore, a higher proportion of type II fibers implies a higher percentage of IIx fibers, “which are the least oxidative fibres and are positively associated with T2D and obesity” (Nielsen and Christensen, 2011: 612). They also note that this may explain the rural-urban difference in diabetes prevalance, with urban populations having a higher proportion of type II diabetics. They also note that this may explain the difference in type II diabetes in US blacks and West African natives—but the reverse is true for West Africans in the US. There is a higher rate of modernization and, with that, a higher chance to be less physically active and if the individual in question is less physically active and has a higher proportion of type II fibers then they will have a higher chance of acquiring metabolic diseases (obesity is also a metabolic disease). Since whites have a higher proportion of type I fibers, they can increase their fat intake—and with it, their fat oxidation—but this does not hold for blacks who “may not adjust well to changes in fat intake” (Nielsen and Christensen, 2011: 612).
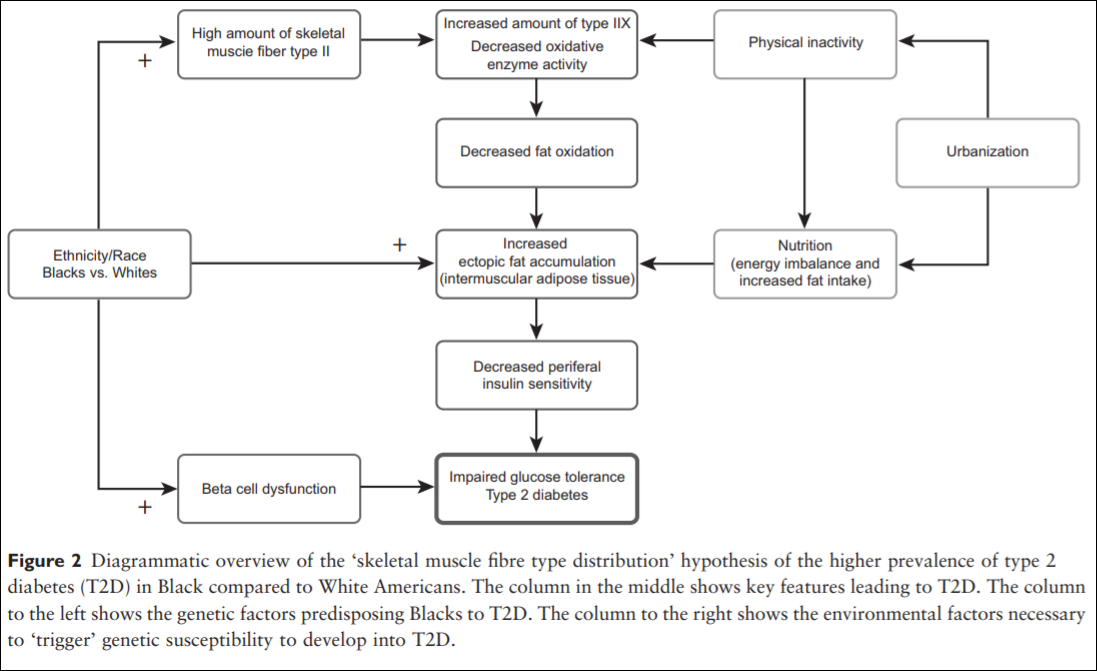
Nielsen and Christensen end their paper writing:
Thus, Blacks of West African ancestry might be genetically predisposed to T2D because of an inherited lower amount of skeletal muscle fibre type I, whereby the oxidative capacity and fat oxidation is reduced, causing increased muscular tissue fat accumulation. This might induce skeletal muscle insulin resistance followed by an induced stress on the insulin-producing beta cells. Together with higher beta-cell dysfunction in the West African Diaspora compared to Whites, this will eventually lead to T2D (an overview of the ‘skeletal muscle distribution hypothesis’ can be seen in Figure 2).
Lambernd et al (2012) show that muscle contractions eliminated insuin resistance by blocking pro-inflammatory signalling pathways: this is the mechanism by which physical activity decreases glucose intolerance and thusly improves health outcomes—especially for those with a higher proportion of type II fibers. Thus, it is important for individuals with type II fibers to exercise, since sedentariness is associated with an age-related insulin resistance due to impaired GLUT4 utilization (Bunprajun et al, 2013).
(Also see Morrison and Cooper’s (2006) hypothesis that “reduced oxygen-carrying capacity induced a shift to more explosive muscle properties” (Epstein, 2014: 179). Epstein notes that the only science there is on this hypothesis is one mouse and rat study showing that low hemoglobin can “induce a switch to more explosive muscle fibers” (Epstein, 2014: 178), but this has not been tested on humans to see if it would hold. If this is tested on humans and if it does hold, then that would lend credence to Morrison’s and Cooper’s (2006) hypothesis.)
Conclusion
Knowing what we know about muscle anatomy and physiology and how muscles act we can understand the influence the different muscle types have on disease and how they contribute to disease variation between race, sex and the individual level. Especially knowing how type II fibers act when the individual in question is insulin resistant is extremely important—though it has been noted that individuals who participate in aerobic exercise decrease their risk for cardiometabolic diseases and can change the fiber distribution difference between IIx and IIa fibers, lowering their risk for acquiring cardiometabolic diseases (Ceaser and Hunter, 2015).
Thinking back to sarcomeres (the smallest contractile unit in the muscle) and how they would act in type II fibers: they would obviously contract much faster in type II muscles over type I muscles; they would then obviously tear faster than type I muscles; since type II muscles are more likely to be insulin resistant, then those with a higher proportion of type II fibers need to focus more on aerobic activity to “balance out” type IIx and IIa fibers and decrease the risk of cardiometabolic disease due to more muscle contractions (Lambernd et al, 2012). Since blacks have a higher proportion of type II fibers and are more likely to be sedentary than whites, and since those who have a higher proportion of type II fibers are more likely to be obese, then it is clear that exercise can and will ameliorate some of the disparity in cardiometabolic diseases between blacks and whites.
Differences in Body Composition Between Asians and Whites
1700 words
Black-white differences get talked about more than Asian-white differences. (For the purposes of this article, “Asian” refers to Koreans, Chinese, Japanese and Filipinos whereas “white” refers to those of European descent.) One interesting racial difference is that of body fatness between ethnies/races. Blacks have thinner skin folds and lower percent body fat than whites at the same height/BMI, and Asians have higher body fat and larger skinfolds than do whites. The interesting thing about this Asian-white difference is the fact that, at the same BMI, Asians have more upper body fat (trunk) than whites. The interesting thing is that there are two good studies, looking at these types of differences between Asians and whites (one study looking at the aforementioned “Asians” I previously identified and whites in the NYC area and another comparing whites and Chinese living in China.)
Wang et al (1994) studied 687 healthy volunteers (445 whites and 242 Asians, ranging from 18-94 years of age with BMIs in the range of 15-38). They defined ethnicity as the birthplace of one’s grandparents. The “Asian” category included 225 Chinese, 9 Japanese, 6 Koreans and 2 Filipinos; 97 percent of this sample was born in Asia. Then, after an overnight fast to better assess body fat differences and skinfold measures, they were weighed and measured, with their back, butt and feet firmly against the wall.
They measured skinfold thickness at the midarm for the average of the triceps and biceps, trunk thickness was the average circumference of the chest, subscapular, umbilicus, abdomen, and suprailiac. The circumference of the arm was measured at the midarm, while the circumference of the trunk was the average circumference of the upper chest, waist, iliac crest, and chest.
Wang et al (1994) found that whites were significantly taller, heavier and had higher BMIs than Asians. Wang et al (1994: 25) write:
For lean and normal BMIs, Asians were fatter than whites in both sexes, but the differences in estimated fat% between whites and Asians varied by BMI in different directions for males and females: fat% increased with BMI for males but decreased with BMI for females.
Whites were had significantly larger circumference in the measured appendages compared to Asians, while in Asian and white females, the circumference of the arms and waist were not different but other circumferences showed a greater difference, favoring whites. Asians had significantly higher levels of subcutaneous trunk fat (upper body fat) than whites, while white females had more lower (thigh) body fat than Asians. In both sexes, Asians had thicker bicep, subscapular, abdomen, and suprailiac skinfolds than whites, in both sexes. White women had higher levels of subcutaneous fat in their thighs. The only difference between white and Asian males in regard to skinfold area was the thigh, with whites having larger thighs, but were similar at the midarm and trunk. Asian men had a larger trunk skinfold area whereas whites had a larger thigh skinfold area while arm fatness did not differ between the races. Women in both races had larger skinfold areas except in the trunk; for whites, there were no differences between the sexes. In both sexes, Asians had higher values in subcutaneous fat (at the midarm, trunk, and midthigh), but white women had a higher value in the thigh than Asian women.
Wang et al (1994) show that there are significant differences in body fatness at different sites of the body, and so, since most (if not all) BMI equations are based on white populations, then, these equations will not work for Asians and will result in substantial error.
Wang et al (2011) studied differences in body composition between Chinese and white males living in the Shenzhen, Guangdong Province, China. They studied 115 Chinese and 114 white males. In this sample, Chinese males were younger, shorter, had a lower body weight and lower BMI than the white sample. Whites had higher fat mass, fat-free mass and bioelectrical impedance (which assess body composition, which measures lean mas in relation to fat mass; but these can be skewed by how much water one has or has not drunk, and so the DXA scan and hydrostatic weighing are, in my opinion, superior assessors). After adjustment for age and BMI, the percentage of fat mass in the trunk and arm was higher in Chinese than white males. Further, Chinese men had higher diastolic blood pressure (DBP), fasting glucose (FG) and triglycerides (TG), while whites had higher fasting total plasma cholesterol (TC) and high-density lipoprotein (HDL). The only statistically significant differences were between FG and HDL. Even after adjustment, Chinese men had 3.0 mmHg higher DBP than whites.
Chinese men had higher percent body fat than whites and more fat stored around their trunks than whites at the same BMI. Chinese men had higher fasting glucose levels (a risk-factor for obesity) but lower HDL levels at the same BMI as whites. Wang et al (2011) write:
In addition, comparing the two nationally representative studies, NHANES III [32] and China National Nutrition and Health Survey 2002 (CNNHS 2002) [33], Chinese men held a relatively 15.0% lower mean value of BMI than that for American white men. While comparison results from two large-scale epidemiological studies, the Shanghai Diabetes Studies (SHDS) [34] and the NHANES III [35], show that the mean value of PBF for American men is relatively 7.4% higher than that for Chinese men. The relative difference of PBF between American and Chinese males is much less than the difference of BMI, implying that the PBF among American men should be lower than that of Chinese men with the same BMI level.
What this implies is that the proportion of overweight/obese Chinese men are severely underestimated since, as noted earlier, most—if not all—BMI equations are created using strictly white populations. This study also provides more evidence that Chinese men had more central (trunk) adiposity than whites (Britons, in this study; Eston, Evans, and Fu, 1994). Central adiposity and risk for type II diabetes and cardiovascular disease is heightened in those of Chinese descent (Weng et al, 2006). It should also be noted that, in a sample of 129 Pacific Islanders, 120 Asians, 91 Maoris, and 91 Europeans aged 12-91, the relationship between bioelectrical impedance analysis (BIA) is ethnicity-dependent, due to the fact the equations developed for fatness estimation using BIA were more accurate than what was recommended by the manufacturer (Sluyter et al, 2010). Cheng (2011) showed that central adiposity was more predictive of cardiovascular diseases in the Chinese population than was BMI, while Hu et al (2007) showed that central obesity was more related to diabetes mellitus and impaired fasting glucose than to overall obesity in the Chinese population.
So, clearly, obesity-related factors appear at lower BMIs for Asians than Europeans (e.g., Huxley et al, 2008). Pan et al (2004) showed that for most BMI values, incidences of hypertension, diabetes, and hyperuricemia were higher in the Taiwanese sample than in the white and black samples. As BMI got higher, the risk for hypertriglyceridemia and hypertension increased. They showed that BMIs of 22.6, 26, and 27.5 were the cutoffs for the best predictabilty in regard to negative and positive variables for Taiwanese, white and black men, respectively. Pan et al (2004: 31) write:
For BMIs 27, 85% of Taiwanese, 66% of whites, and 55% of blacks had at least one of the studied comorbidities. However, a cutoff close to the median of the studied population was often found by maximizing sensitivity and specificity. Reducing BMI from 25 to 25 in persons in the United States could eliminate 13% of the obesity comorbidity studied. The corresponding cutoff in Taiwan is slightly 24.
Pan et al (2004) conclude that, for Taiwanese (Asians) in their study, they should have a lower BMI cutoff than whites and blacks, though it is tough to ascertain where that cutoff would be.
Bell, Adair, and Popkin (2002) show that “at BMI levels less than 25, prevalence difference figures suggested a stronger association between BMI and hypertension in Chinese men and women but not in Filipino women, compared with non-Hispanic Whites” while “[n]on-Hispanic Blacks and Filipino women had a higher prevalence of hypertension at every level of BMI compared with non-Hispanic Whites and Mexican Americans.”
Since Asians have a higher risk of hypertension than whites after controlling for BMI, this indicates that the effects of obesity are not as important as other factors, be they genetic or environmental (or both, which it obviously is). The higher incidence of obesity-related risk-factors in Asian populations with lower BMIs has been attributed to GxE interactions, which, of course, have been intensified with the introduction of the Western Diet (AKA the SAD [Standard American Diet] diet). This can be most notably seen with the explosion of childhood obesity in China, with the number of obese people in China surpassing the US recently, while China is on its way to have the most obese children in the world. The surging obesity epidemic in China is due to increasingly similar lifestyles to what we have (sedentary populations; highly processed, high fat, high carbohydrate foodstuff).
So since the findings in the reviewed studies suggest that, at a lower BMI, Asians are more susceptible to obesity-related risk-factors, and so, BMI standards must be lowered for Asian populations, which would be BMI 24 for overweight and BMI 27 for obese, which was recommended by the Chinese Ministry of Health (Wang et al, 2010). Cheung et al (2018) show that diet quality is inversely associated with obesity in Chinese adults who have type II diabetes.
In conclusion, Asians at the same BMI have higher body fat percentage than whites, and they also have more obesity-related risk-factors than whites at a lower BMI (Pan et al, 2004; WHO expert consultation, 2004; Wang et al, 2010; Hsu et al, 2015), which implies that they need differing BMI scales, just as blacks need different scales in comparison with whites. Here is a good example of two people with the same BMI (22.3) but different DXA results:
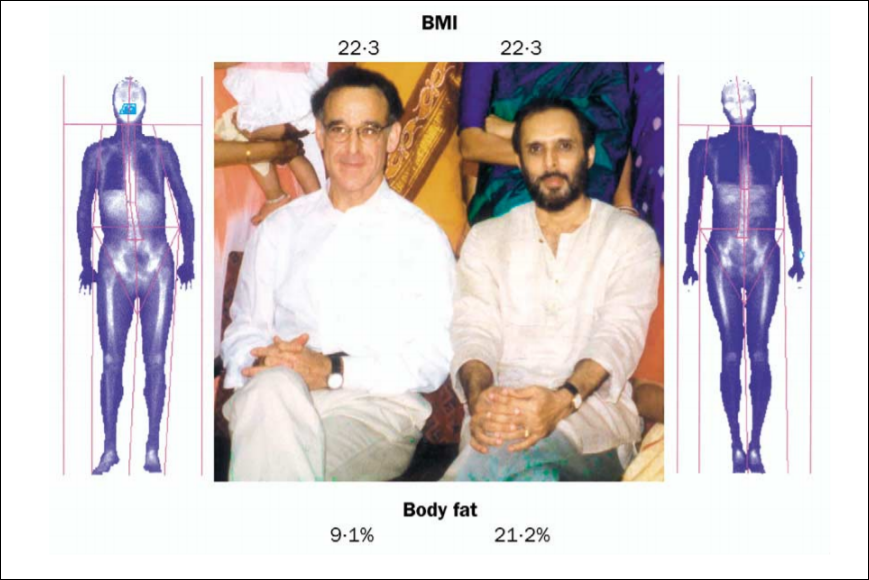
This, of course, shows the strong limitations of the use of the same BMI standards calculated in one ethny and used for another. So, just like at the same BMI blacks have lower body fat and thinner skinfolds than whites (Vickery, Cureton, and Collins, 1988; Wagner and Heyward, 2000; Flegal et al, 2010), at the same BMI as whites, Asians have higher body fat and thicker skinfolds (Wang et al, 1994; WHO expert consultation, 2004; Wang et al, 2011).
Race, Body Fat, and Skin Folds
1250 words
Racial differences in body fat are clear to the naked eye: black women are more likely to carry more body fat than white women; Mexican American women are more likely to carry more body fat than white women, too. Different races/ethnies/genders of these races/ethnies have different formulas to assess body fat through the use of skin-folds. The sites to grasp the skin is different based on gender and race.
Body mass index (BMI) and waist circumference is overestimated in blacks, which means that they need different formulas to assess their BMI and adiposity/lean mass. Race-specific formulas/methods are needed to assess body fat and, along with it, disease risk, since blacks are more likely to be obese (black women, at least, it’s different with black American men with more African ancestry, see below). The fact of the matter is, when matched on a slew of variables, blacks had lower total and abdominal fat mass than whites.
This is even noted in Asian, black and white prepubertal children. He et al (2002) show that sex differences in body fat distribution are present in children who have yet to reach puberty and the differences in body fat in Asians is different than that from blacks and whites which also varies by sex. Asian girls had greater gynoid fat by DXA scan only, with girls having greater gynoid fat than boys. Asian girls had lower adjusted extremity fat and gynoid fat compared to white and black girls. Though, Asian boys had a lower adjusted extremity by fat as shown by DXA (a gold standard in body fat measurement) when compared to whites, but greater gynoid fat than whites and blacks.
Vickery, Cureton, and Collins, (1988), Wagner and Heyward (2000), and Robson, Bazin, and Soderstrom (1971) show that there are considerable body composition differences between blacks and whites. These differences in body composition come down to diet, of course, but there is also a genetic/physiologic component there as well. Combining the known fact that skin-fold testing is not conducive to a good estimate, black American men with more African ancestry are less likely to be obese.
Vickery, Cureton, and Collins (1988) argue that, if accurate estimates of body fat percentages are to be obtained, race-specific formulas need to be developed and used as independent variables to assess racial differences in body fat percentage. Differences in muscularity don’t seem to account for these skinfold differences, nor does greater mesomorphy. One possible explanation for differences in skinfold thickness is that blacks may store most of their body fat subcutaneously. (See Wagner and Heyward, 2000 for a review on fat patterning and body composition in blacks and whites.)
The often-used Durnin-Womersley formula which is used to predict body fat just from skin folds. However, “The 1974 DW equations did not predict %BF(DXA) uniformly in all races or ethnicities” (Davidson et al, 2011). Truesdale et al (2016) even show that numerous formulas used to estimate percent body fat are flawed, even some formulas used on different races. Most of the equations tested showed starkly different conclusions. But, this is based on NHANES data and the only data they provide regarding skin-folds is the tricep and subscapular skinfold so there may still be more problems with all of the equations used to assess body fat percentage between races. (Also see Cooper, 2010.)
Klimentidis et al (2016) show that black men—but not black women—seem to be protected against obesity and central adiposity (fat gain around the midsection) and that race negatively correlated with adiposity. The combo of male gender and West African ancestry predicted low levels of adiposity compared to black Americans with less African ancestry. Furthermore, since black men and women have—theoretically—the same SES, then cultural/social factors would not play as large a role as genetic factors in explaining the differences in adiposity between black men and black women. Black men with more African ancestry had a lower WHR and less central adiposity than black men with less African ancestry. If we assume that they had similar levels of SES and lived in similar neighborhoods, there is only one reason why this would be the case.
Klimentidis et al (2016) write:
One interpretation is that AAs are exposed to environmental and/or cultural factors that predispose them to greater obesity than EAs. Possibly, some of the genes that are inherited as part of their West-African ancestry are protective against obesity, thereby “canceling out” the obesifying effects of environment/culture, but only in men. Another interpretation is that genetic protection is afforded to all individuals of African descent, but this protection is overwhelmed by cultural and/or other factors in women.
Black men do, as is popularly believed, prefer bigger women over smaller women. For example, Freedman et al (2004) showed that black American men were more likely to prefer bigger women. Black American men “are more willing to idealize a woman
of a heavier body size, with more curves, than do their White American counterparts” (Freedman et al, 2004: 197). It is then hypothesized that black American men find these figures attractive (figures with “more curves” (Freedman et al, 2004: 197)) to protect against eating pathologies, such as anorexia and bulimia. So, it has been established that black men have thinner skin folds than whites which leads to skewed lean mass/body fat readings and black men with more African ancestry are less likely to be obese. These average differences between races, of course, contribute to differing disease acquisition.
I have covered differences in body fat in a few Asian ethnies and have come to the obvious conclusion: Asians, at the same height, weight etc as whites and blacks, will have more adipose tissue on their bodies. They, too, like blacks and whites, have different areas that need to be assessed for skin folds to estimate body fat.
Henriques (2016: 29) has a table on the equations for calculating estimated body density from skin fold measures from various populations. Of interest are the ones on blacks or ‘Hispanics‘, blacks or athletes and blacks and whites. (The table is provided from NSCA, 2008 so the references are not in the back of the text.)
For black and ‘Hispanic’ women aged 18-55 years, the sites to use for skin-folds are the chest, abdomen, triceps, subscapular, suprailiac, midaxillary, and the thigh. For blacks or athletes aged 18-61 years, the sites to use are the same as before (but a different equation is used for body fat estimation). For white women or anorexic women aged 18-55, the sites used are just triceps, suprailiac and the thigh. For black and white boys aged 6-17, only the triceps and the calf is used. It is the same for black and white girls, but, again, a different formula is used to assess body fat (Henriques, 2016: 29).
Morrison et al (2012) showed that white girls had a higher percent body fat when compared to black girls at ages 9-12 but every age after, black girls had higher percent body fat (which is related to earlier menarche in black girls since they have higher levels of body fat which means earlier puberty; Kaplowitz, 2008). Black girls, though, had higher levels of fat in their subscapular skin folds than white girls at all ages.
So, it seems, there are population-/race-specific formulas that need to be created to better assess body fat percentage in different races/ethnies and not assume that one formula/way of assessing body fat should be used for all racial/ethnic groups. According to the literature (some reviewed here and in Wagner and Heyward, 2000), these types of formulas are sorely needed to better assess health markers in certain populations. These differences in body fat percentage and distribution then have real health consequences for the races/ethnies in question.
Genotypes, Athletic Performance, and Race
2050 words
Everyone wants to know the keys to athletic success, however, as I have argued in the past, to understand elite athletic performance, we must understand how the system works in concert with everything—especially in the environments the biological system finds itself in. To reduce factors down to genes, or training, or X or Y does not make sense; to look at what makes an elite athlete, the method of reductionism, while it does allow us to identify certain differences between athletes, it does not allow us to appreciate the full-range of how and why elite athletes differ in their sport of choice. One large meta-analysis has been done on the effects of a few genotypes on elite athletic performance, and it shows us what we already know (blacks are more likely to have the genotype associated with power performance—so why are there no black Strongmen or any competitors in the World’s Strongest Man?). A few studies and one meta-analysis exist, attempting to get to the bottom of the genetics of elite athletic performance and, while it of course plays a factor, as I have argued in the past, we must take a systems view of the matter.
One 2013 study found that a functional polymorphism in the angiotensinogen (ATG) region was 2 to 3 times more common in elite power athletes than in (non-athlete) controls and elite endurance athletes (Zarebska et al, 2013). This sample tested was Polish, n = 223, 156 males, 67 females, and then they further broke down their athletic sample into tiers. They tested 100 power athletes (29 100-400 m runners; 22 powerlifters; 20 weightlifters; 14 throwers and 15 jumpers) and 123 endurance athletes (4 tri-athletes; 6 race walkers; 14 road cyclists; 6 15 to 50 m cross-country skiers; 12 marathon runners; 53 rowers; 17 3 to 10 km runners; and 11 800 to 1500 m swimmers).
Zarebska et al (2013) attempted to replicate previous associations found in other studies (Buxens et al, 2009) most notably the association with the M235T polymorphism in the AGT (angiotensinogen) gene. Zarebska et al’s (2013) main finding was that there was a higher representation of elite power athletes with the CC and C alleles of the M235T polymorphism compared with endurance athletes and controls, which suggests that the C allele of the M235T gene “may be associated with a predisposition to power-oriented
events” (Zarebska et al, 2013: 2901).
Elite power athletes were more likely to possess the CC genotype; 40 percent of power athletes had the genotype whereas 13 percent of endurance had it and 18 percent of non-athletes had it. So power athletes were more than three times as likely to have the CC genotype, compared to endurance athletes and twice as likely to have it compared to non-athletes. On the other hand, one copy of the C allele was found in 55 percent of the power athletes whereas, for the endurance athletes and non-athletes, the C allele was found in about 40 percent of individuals. (Further, in the elite anaerobic athlete, explosive power was consistently found to be a difference maker in predicting elite sporting performance; Lorenz et al, 2013.)
Now we come to the more interesting parts: ethnic differences in the M235T polymorphism. Zarebska et al (2013: 2901-2902) write:
The M235T allele distribution varies widely according to the subject’s ethnic origin: the T235 allele is by far the most frequent in Africans (;0.90) and in African-Americans (;0.80). It is also high in the Japanese population (0.65–0.75). The T235 (C4027) allele distribution of the control participants in our study was lower (0.40) but was similar to that reported among Spanish Caucasians (0.41), as were the sports specialties of both the power athletes (throwers, sprinters, and jumpers) and endurance athletes (marathon runners, 3- to 10-km runners, and road cyclists), thus mirroring the aforementioned studies.
Zarebska et al (2013: 2902) conclude that their study—along with the study they replicated—supports the hypothesis that the C allele of the M235T polymorphism in the AGT gene may confer a competitive advantage in power-oriented sports, which is partly mediated through ANGII production in the skeletal muscles. Mechanisms can explain the mediation of ANGII production in skeletal muscles, such as a direct skeletal muscle hypertrophic effect, along with the redistribution of between muscle blood flow between type I (slow twitch) and II fibers (fast twitch), which would then augment power and speed. However, it is interesting to note that Zarebska et al (2013) did not find any differences between “top-elite” level athletes who had won medals in international competitions compared to elite-level athletes who were not medalists.
The big deal about this gene is that the AGT gene is part of the renin-angiotensin system which is partly responsible for blood pressure and body salt regulation (Hall, 1991; Schweda, 2014). There seems to be an ethnic difference in this polymorphism, and, according to Zarebska et al (2013), African Americans and Africans are more likely to have the polymorphisms that are associated with elite power performance.
There is also a meta-analysis on genotyping and elite power athlete performance (Weyerstrab et al, 2017). Weyerstrab et al (2017) meta-analyzed 36 studies which attempted to find associations between genotype and athletic ability. One of the polymorphisms studied was the famous ACTN3. It has been noted that, when conditions are right (i.e., the right morphology), the combined effects of morphology along with the contractile properties of the individual muscle fibers contribute to the enhanced performance of those with the RR ACTN3 genotype (Broos et al, 2016), while Ma et al (2013) also lend credence to the idea that genetics influences sporting performance. This is, in fact, the most-replicated association in regard to elite sporting performance: we know the mechanism behind how muscle fibers contract; we know how the fibers contract and the morphology needed to maximize the effectiveness of said fast twitch fibers (type II fibers). (Blacks have a higher proportion of type II fibers [see Caeser and Henry, 2015 for a review].)
Weyerstrab et al (2017) meta-analyzed 35 articles, finding significant associations with genotype and elite power performance. They found that ten polymorphisms were significantly associated with power athlete states. Their most interesting findings, though, were on race. Weyerstrab et al (2017: 6) write:
Results of this meta-analysis show that US African American carriers of the ACE AG genotype (rs4363) were more than two times more likely to become a power athlete compared to carriers of the ACE preferential genotype for power athlete status (AA) in this population.
“Power athlete” does not necessarily have to mean “strength athlete” as in powerlifters or weightlifters (more on weightlifters below).
Lastly, the AGT M235T polymorphism, while associated with other power movements, was not associated with elite weightlifting performance (Ben-Zaken et al, 2018). As noted above, this polymorphism was observed in other power athletes, and since these movements are largely similar (short, explosive movements), one would rightly reason that this association should hold for weightlifters, too. However, this is not what we find.
Weightlifting, compared to other explosive, power sports, is different. The beginning of the lifts take explosive power, but during the ascent of the lift, the lifter moves the weight slower, which is due to biomechanics and a heavy load. Ben-Zaken et al (2018) studied 47 weightlifters (38 male, 9 female) and 86 controls. Every athlete that was studied competed in national and international meets on a regular basis. Thirty of the weightlifters were also classified as “elite”, which entails participating in and winning national and international competitions such as the Olympics and the European and World Championships).
Ben-Zaken et al (2018) did find that weightlifters had a higher prevalence of the AGT 235T polymorphism when compared to controls, though there was no difference in the prevalence of this polymorphism when elite and national-level competitors were compared, which “[suggests] that this polymorphism cannot determine or predict elite competitive weightlifting performance” (Ben-Zaken et al, 2018: 38). Of course, a favorable genetic profile is important for sporting success, though, despite the higher prevalence of AGT in weightlifters compared to controls, this could not explain the difference between national and elite-level competitors. Other polymorphisms could, of course, contribute to weightlifting success, variables “such as training experience, superior equipment and facilities, adequate nutrition, greater familial support, and motivational factors, are crucial for top-level sports development as well” (Ben-Zaken et al, 2018: 39).
I should also comment on Anatoly Karlin’s new article The (Physical) Strength of Nations. I don’t disagree with his main overall point; I only disagree that grip strength is a good measure of overall strength—even though it does follow the expected patterns. Racial differences in grip strength exist, as I have covered in the past. Furthermore, there are associations between muscle strength and longevity, with stronger men being more likely to live longer, fuller lives (Ruiz et al, 2008; Volkalis, Haille, and Meisinger, 2015; Garcia-Hermosa, et al, 2018) so, of course, strength training can only be seen as a net positive, especially in regard to living a longer and fuller life. Hand grip strength does have a high correlation with overall strength (Wind et al, 2010; Trosclair et al, 2011). While handgrip strength can tell you a whole lot about your overall health (Lee et al, 2016), of course, there is no better proxy than actually doing the lifts/exercises to ascertain one’s level of strength.
There are replicated genetic associations between explosive, powerful athletic performance, along with even the understanding of the causal mechanisms behind the polymorphisms and their carry-over to power sports. We know that if morphology is right and the individual has the RR ACTN3 genotype, that they will exceed in explosive sports. We know the causal pathways of ACTN3 and how it leads to differences in sprinting competitions. It should be worth noting that, while we do know a lot more about the genomics of sports than we did 20, even 10 years ago, current genetic testing has zero predictive power in regard to talent identification (Pitsladis et al, 2013).
So, of course, for parents and coaches who wonder about the athletic potential of their children and students, the best way to gauge whether or not they will excel in athletics is…to have them compete and compare them to other kids. Even if the genetics aspect of elite power performance is fully unlocked one day (which I doubt it will be), the best way to ascertain whether or not one will excel in a sport is to put them to the test and see what happens. We are in our infancy in understanding the genomics of sporting performance, but when we do understand which genotypes are more prevalent in regard to certain sports (and of course the interactions of the genotype with the environment and genes), then we can better understand how and why others are better in certain sports.
The genomics of elite sporting performance is very interesting; however, the answer that reductionists want to see will not appear: genes are difference makers (Sterelny and Griffith, 1999), not causes, and along with a whole slew of other environmental and mental factors (Lippi, Favaloro, and Guidi 2008), along with a favorable genetic profile with sufficient training (and everything else that comes along with it) are needed for the athlete to reach their maximum athletic potential (see Guth and Roth, 2013). Genetic and environmental differences between individuals and groups most definitely explain differences in elite sporting performance, though elucidating what causes what and the mechanisms that cause the studied trait in question will be tough.
Just because group A has gene or gene networks G and they compete in competition C does not mean that gene or gene networks G contribute in full—or in part—to sporting success. The correlations could be coincidental and non-functional in regard to the sport in question. Athletes should be studied in isolation, meaning just studying a specific athlete in a specific discipline to ascertain how, what, and why works for the specific athlete along with taking anthropomorphic measures, seeing how bad they want “it”, and other environmental factors such as nutrition and training. Looking at the body as a system will take us away from privileging one part over another—while we also do understand that they do play a role but not the role that reductionists believe.
These studies, while they attempt to show us how genetic factors cause differences at the elite level in power sports, they will not tell the whole story, because we must look at the whole system, not reduce it down to the sum of its parts (Shenk, 2011: chapter 5). While blacks are more likely to have these polymorphisms that are associated with elite power athlete performance, this does not obviously carry over to strongman and powerlifting competition.
