
Home » 2019 (Page 4)
Yearly Archives: 2019
Five Years Away Is Always Five Years Away
1300 words
Five years away is always five years away. When one makes such a claim, they can always fall back on the “just wait five more years!” canard. Charles Murray is one who makes such claims. In an interview with the editor of Skeptic Magazine, Murray stated to Frank Miele:
I have confidence that in five years from now, and thereafter, this book will be seen as a major accomplishment.
This interview was in 1996 (after the release of the soft cover edition of The Bell Curve), and so “five years” would be 2001. But “predictions” such as this from HBDers (that the next big thing for their ideology, for example) is only X years away happens a lot. I’ve seen many HBDers make claims that only in 5 to 10 years the evidence for their position will come out. Such claims seem strangely religious to me. There is a reason for that. (See Conley and Domingue, 2016 for a molecular genetic refutation of The Bell Curve. While Murray’s prediction failed, 22 years after The Bell Curve’s publication, the claims of Murray and Herrnstein were refuted.)
Numerous people throughout history have made predictions regarding the date of Christ’s return. Some have used calculations to ascertain the date of Christ’s return, from the Bible. We can just take a look at the Wikipedia page for predictions and claims for the second coming of Christ where there are many (obviously failed) predictions of His return.
Take John Wesley’s claim that Revelations 12:14 referred to the day that Christ should come. Or one of Charles Taze Russell’s (the first president of the Watch Tower Society of Jehova’s Witnesses) claim that Jesus would return in 1874 and be ruling invisibly from heaven.
Russell’s beliefs began with Adventist teachings. While Russell, at first, did not take to the claim that Christ’s return could be predicted, that changed when he met Adventist author Nelson Barbour. The Adventists taught that the End Times began in 1799, Christ returned invisibly in 1874 with a physical return in 1878. (When this did not come to pass, many followers left Barbour and Russell states that Barbour did not get the event wrong, he just got the fate wrong.) So all Christians that died before 1874 would be resurrected, and Armageddon would begin in 1914. Since WWI began in 1914, Russell took that as evidence that his prediction was coming to pass. So Russell sold his clothing stores, worth millions of dollars today, and began writing and preaching about Christ’s imminent refuted. This doesn’t need to be said, but the predictions obviously failed.
So the date of 1914 for Armageddon (when Christ is supposed to return), was come to by Russell from studying the Bible and the great pyramids:
A key component to the calculation was derived from the book of Daniel, Chapter 4. The book refers to “seven times“. He interpreted each “time” as equal to 360 days, giving a total of 2,520 days. He further interpreted this as representing exactly 2,520 years, measured from the starting date of 607 BCE. This resulted in the year 1914-OCT being the target date for the Millennium.
Here is the prediction in Russell’s words “…we consider it an established truth that the final end of the kingdoms of this world, and the full establishment of the Kingdom of God, will be accomplished by the end of A.D. 1914” (1889). When 1914 came and went (sans the beginning of WWI which he took to be a sign of the, End Times), Russell changed his view.
Now, we can liken the Russell situation to Murray. Murray claimed that in 5 years after his book’s publication, that the “book would be seen as a major accomplishment.” Murray also made a similar claim back in 2016. Someone wrote to evolutionary biologist Joseph Graves about a talk Murray gave; he was offered an opportunity to debate Graves about his claims. Graves stated (my emphasis):
After his talk I offered him an opportunity to debate me on his claims at/in any venue of his choosing. He refused again, stating he would agree after another five years. The five years are in the hope of the appearance of better genomic studies to buttress his claims. In my talk I pointed out the utter weakness of the current genomic studies of intelligence and any attempt to associate racial differences in measured intelligence to genomic variants.
(Do note that this was back in April of 2016, about one year before I changed my hereditarian views to that of DST. I emailed Murray about this, he responded to me, and gave me permission to post his reply which you can read at the above link.)
Emil Kirkegaard stated on Twitter:
Do you wanna bet that future genomics studies will vindicate us? Ashkenazim intelligence is higher for mostly genetic reasons. Probably someone will publish mixed-ethnic GWAS for EA/IQ within a few years
Notice, though “within a few years” is vague; though I would take that to be, as Kirkegaard states next, three years. Kirkegaard was much more specific for PGS (polygenic scores) and Ashkenazi Jews, stating that “causal variant polygenic scores will show alignment with phenotypic gaps for IQ eg in 3 years time.” I’ll remember this; January 6th, 2022. (Though it was just an “example given”, this is a good example of a prediction from an HBDer.) Nevermind the problems with PGS/GWA studies (Richardson, 2017; Janssens and Joyner, 2019; Richardson and Jones, 2019).
I can see a prediction being made, it not coming to pass, and, just like Russel, one stating “No!! X, Y, and Z happened so that invalidated the prediction! The new one is X time away!” Being vague about timetables about as-of-yet-to-occur events it dishonest; stick to the claim, and if it does not occur….stop holding the view, just as Russel did. However, people like Murray won’t change their views; they’re too entrenched in this. Most may know that I over two years ago I changed my views on hereditarianism (which “is the doctrine or school of thought that heredity plays a significant role in determining human nature and character traits, such as intelligence and personality“) due to two books: DNA Is Not Destiny: The Remarkable, Completely Misunderstood Relationship between You and Your Genes and Genes, Brains, and Human Potential: The Science and Ideology of Intelligence. But I may just be a special case here.
Genes, Brains, and Human Potential then led me to the work of Jablonka and Lamb, Denis Noble, David Moore, Robert Lickliter, and others—the developmental systems theorists. DST is completely at-ends with the main “field” of “HBD”: behavioral genetics. See Griffiths and Tabery (2013) for why teasing apart genes and environment—nature and nurture—is problematic.
In any case, five years away is always five years away, especially with HBDers. That magic evidence is always “right around the corner”, despite the fact that none ever comes. I know that some HBDers will probably clamor that I’m wrong and that Murray or another “HBDer” has made a successful prediction and not immediately change the date of said prediction. But, just like Charles Taze Russell, when the prediction does not come to pass, just make something up about how and why the prediction didn’t come to pass and everything should be fine.
I think Charles Murray should change his name to Charles Taze Russel, since he pushed back the date of the prediction so many times. Though, to Russel’s credit, he did eventually recant on his views. I would find it hard to believe that Murray would; he’s too deep in this game and his career writing books and being an AEI pundit is on the line.
So I strongly doubt that Murray would ever come outright and say “I was wrong.” Too much money is on the line for him. (Note that Murray has a new book releasing in January titled Human Diversity: Gender, Race, Class, and Genes and you know that I will give a scathing review of it, since I already know Murray’s MO.) It’s ironic to me: Most HBDers are pretty religious in their convictions and can and will explain away data that doesn’t line up with their beliefs, just like a theist.
Men Are Stronger Than Women
1200 words
The claim that “Men are stronger than women” does not need to be said—it is obvious through observation that men are stronger than women. To my (non-)surprise, I saw someone on Twitter state:
“I keep hearing that the sex basis of patriarchy is inevitable because men are (on average) stronger. Notwithstanding that part of this literally results from women in all stages of life being denied access to and discourage from physical activity, there’s other stuff to note.”
To which I replied:
“I don’t follow – are you claiming that if women were encouraged to be physically active that women (the population) can be anywhere *near* men’s (the population) strength level?”
I then got told to “Fuck off,” because I’m a “racist” (due to the handle I use and my views on the reality of race). In any case, while it is true that part of this difference does, in part, stem from cultural differences (think of women wanting the “toned” look and not wanting to get “big and bulky”—as if it happens overnight) and not wanting to lift heavy weights because they think they will become cartoonish.
Here’s the thing though: Men have about 61 percent more muscle mass than women (which is attributed to higher levels of testosterone); most of the muscle mass difference is allocated to the upper body—men have about 75 percent more arm muscle mass than women which accounts for 90 percent greater upper body strength in men. Men also have about 50 percent more muscle mass than women, while this higher percentage of muscle mass is then related to men’s 65 percent greater lower body strength (see references in Lassek and Gaulin, 2009: 322).
Men have around 24 pounds of skeletal muscle mass compared to women, though in this study, women were about 40 percent weaker in the upper body and 33 percent weaker in the lower body (Janssen et al, 2000). Miller et al (1993) found that women had a 45 percent smaller cross-section area in the brachii, 45 in the elbow flexion, 30 percent in the vastus lateralis, and 25 percent smaller CSA in the knee extensors, as I wrote in Muscular Strength by Gender and Race, where I concluded:
The cause for less upper-body strength in women is due the distribution of women’s lean tissue being smaller.
Men have larger fibers, which in my opinion is a large part of the reason for men’s strength advantage over women. Now, even if women were “discouraged” from physical activity, this would be a problem for their bone density. Our bones are porous, and so, by doing a lot of activity, we can strengthen our bones (see e.g., Fausto-Sterling, 2005). Bishop, Cureton, and Collins (1987) show that the sex difference in strength in close-to-equally-trained men and women “is almost entirely accounted for by the difference in muscle size.” Which lends credence to my claim I made above.
Lindle et al (1997) conclude that:
… the results of this study indicate that Con strength levels begin to decline in the fourth rather than in the fifth decade, as was previously reported. Contrary to previous reports, there is no preservation of Ecc compared with Con strength in men or women with advancing age. Nevertheless, the decline in Ecc strength with age appears to start later in women than in men and later than Con strength did in both sexes. In a small subgroup of subjects, there appears to be a greater ability to store and utilize elastic energy in older women. This finding needs to be confirmed by using a larger sample size. Muscle quality declines with age in both men and women when Con peak torque is used, but declines only in men when Ecc peak torque is used. [“Con” and “Ecc” strength refer to concentric and eccentric actions]
Women are shorter than men and have less fat-free muscle mass than men. Women also have a weaker grip (even when matched for height and weight, men had higher levels of lean mass compared to women (92 and 79 percent respectively; Nieves et al, 2009). So men had greater bone mineral density (BMD) and bone mineral content (BMC) compared to women. Now do some quick thinking—do you think that one with weaker bones could be stronger than someone with stronger bones? If person A had higher levels of BMC and BMD compared to person B, who do you think would be stronger and have the ability to do whatever strength test the best—the one with the weaker or stronger muscles? Quite obviously, the stronger one’s bones are the more weight they can bare on them. So if one has weak bones (low BMC/BMD) and they put a heavy load on their back, while they’re doing the lift their bones could snap.
Alswat (2017) reviewed the literature on bone density between men and women and found that men had higher BMD in the hip and higher BMC in the lower spine. Women also had bone fractures earlier than men. Some of this is no doubt cultural, as explained above. However, even if we had a boy and a girl locked in a room for their whole lives and they did the same exact things, ate the same food, and lifted the same weights, I would bet my freedom that there still would be a large difference between the two, skewing where we know it would skew. Women are more likely to suffer from osteoporosis than are men (Sözen, Özışık, and Başaran 2016).
So if women have weaker bones compared to men, then how could they possibly be stronger? Even if men and women had the same kind of physical activity down to the tee, could you imagine women being stronger than men? I couldn’t—but that’s because I have more than a basic understanding of anatomy and physiology and what that means for differences in strength—or running—between men and women.
I don’t doubt that there are cultural reasons that account for the large differences in strength between men and women—I do doubt, though, that the gap can be meaningfully closed. Yes, biology interacts with culture. So the developmental variables that coalesce to make men “Men” and those that coalesce to make women “Women” converge in creating the stark differences in phenotype between the sexes which then explains how the sex differences between the sexes manifest itself.
Differences in bone strength between men and women, along with distribution of lean tissue, differences in lean mass, and differences in muscle size explain the disparity in muscular strength between men and women. You can even imagine a man and woman of similar height and weight and they would, of course, look different. This is due to differences in hormones—the two main players being testosterone and estrogen (see Lang, 2011).
So yes, part of the difference in strength between men and women are rooted in culture and how we view women who strength train (way more women should strength train, as a matter of fact), though I find it hard to believe that even if the “cultural stigma” of the women who lifts heavy weights at the gym disappeared overnight, that women would be stronger than men. Differences in strength exist between men and women and this difference exists due to the complex relationship between biology and culture—nature and nurture (which cannot be disentangled).
DNA—Blueprint and Fortune Teller?
2500 words
What would you think if you heard about a new fortune-telling device that is touted to predict psychological traits like depression, schizophrenia and school achievement? What’s more, it can tell your fortune from the moment of your birth, it is completely reliable and unbiased — and it only costs £100.
This might sound like yet another pop-psychology claim about gimmicks that will change your life, but this one is in fact based on the best science of our times. The fortune teller is DNA. The ability of DNA to understand who we are, and predict who we will become has emerged in the last three years, thanks to the rise of personal genomics. We will see how the DNA revolution has made DNA personal by giving us the power to predict our psychological strengths and weaknesses from birth. This is a game-changer as it has far-reaching implications for psychology, for society and for each and every one of us.
This DNA fortune teller is the culmination of a century of genetic research investigating what makes us who we are. When psychology emerged as a science in the early twentieth century, it focused on environmental causes of behavior. Environmentalism — the view that we are what we learn — dominated psychology for decades. From Freud onwards, the family environment, or nurture, was assumed to be the key factor in determining who we are. (Plomin, 2018: 6, my emphasis)
The main premise of Plomin’s 2018 book Blueprint is that DNA is a fortune teller while personal genomics is a fortune-telling device. The fortune-telling device Plomin most discusses in the book is polygenic scores (PGS). PGSs are gleaned from GWA studies; SNP genotypes are then added up with scores of 0, 1, and 2. Then, the individual gets their PGS for trait T. Plomin’s claim—that DNA is a fortune teller—though, falls since DNA is not a blueprint—which is where the claim that “DNA is a fortune teller” is derived.
It’s funny that Plomin calls the measure “unbiased”, (he is talking about DNA, which is in effect “unbiased”), but PGS are anything BUT unbiased. For example, most GWAS/PGS are derived from European populations. But, for example, there are “biases and inaccuracies of polygenic risk scores (PRS) when predicting disease risk in individuals from populations other than those used in their derivation” (De La Vega and Bustamante, 2018). (PRSs are derived from statistical gene associations using GWAS; Janssens and Joyner, 2019.) Europeans make up more than 80 percent of GWAS studies. This is why, due to the large amount of GWASs on European populations, that “prediction accuracy [is] reduced by approximately 2- to 5-fold in East Asian and African American populations, respectively” (Martin et al, 2018). See for example Figure 1 from Martin et al (2018):
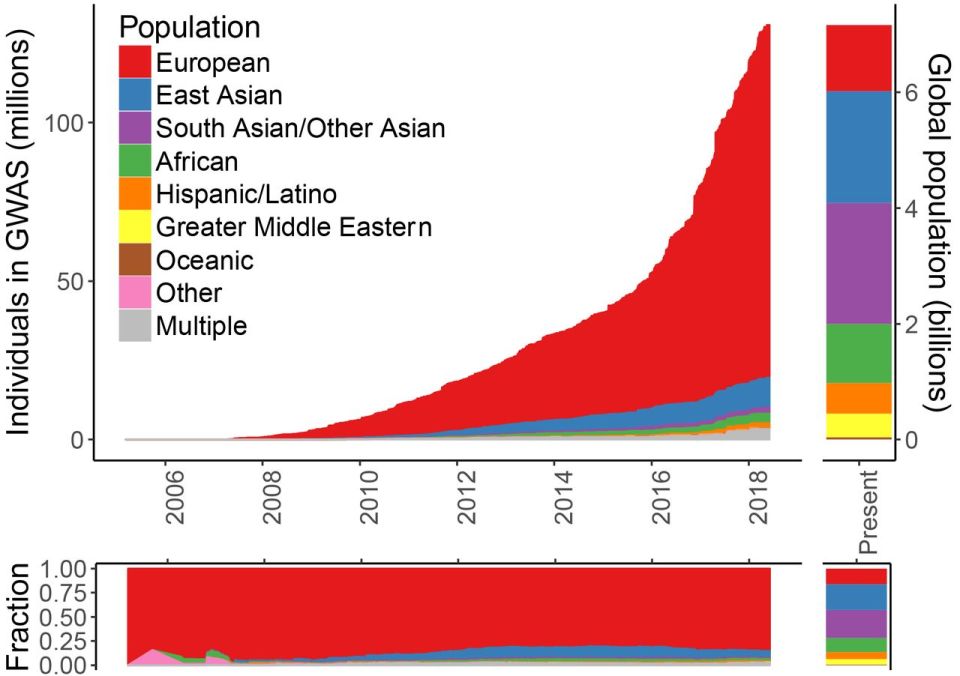
With the huge number of GWAS studies done on European populations, these scores cannot be used on non-European populations for ‘prediction’—even disregarding the other problems with PGS/GWAS.
By studying genetically informative cases like twins and adoptees, behavioural geneticists discovered some of the biggest findings in psychology because, for the first time, nature and nurture could be disentangled.
[…]
… DNA differences inherited from our parents at the moment of conception are the consistent, lifelong source of psychological individuality, the blueprint that makes us who we are. A blueprint is a plan. … A blueprint isn’t all that matters but it matters more than everything else put together in terms of the stable psychological traits that make us who we are. (Plomin, 2018: 6-8, my emphasis)
Nevermind the slew of problems with twin and adoption studies (Joseph, 2014; Joseph et al, 2015; Richardson, 2017a). I also refuted the notion that “A blueprint is a plan” last year, quoting numerous developmental systems theorists. The main thrust of Plomin’s book—that DNA is a blueprint and therefore can be seen as a fortune teller using the fortune-telling device to tell the fortunes of the people’s whose DNA are analyzed—is false, as DNA does not work how it does in Plomin’s mind.
These big findings were based on twin and adoption studies that indirectly assessed genetic impact. Twenty years ago the DNA revolution began with the sequencing of the human genome, which identified each of the 3 billion steps in the double helix of DNA. We are the same as every other human being for more than 99 percent of these DNA steps, which is the blueprint for human nature. The less than 1 per cent of difference of these DNA steps that differ between us is what makes us who we are as individuals — our mental illnesses, our personalities and our mental abilities. These inherited DNA differences are the blueprint for our individuality …
[DNA predictors] are unique in psychology because they do not change during our lives. This means that they can foretell our futures from our birth.
[…]
The applications and implications of DNA predictors will be controversial. Although we will examine some of these concerns, I am unabashedly a cheerleader for these changes. (Plomin, 2018: 8-10, my emphasis)
This quote further shows Plomin’s “blueprint” for the rest of his book—DNA can “foretell our futures from our birth”—and how it affects his conclusions gleaned from his work that he mostly discusses in his book. Yes, all scientists are biased (as Stephen Jay Gould noted), but Plomin outright claimed to be an unabashed cheerleader for his work. Plomin’s self-admission for being an “unabashed cheerleader”, though, does explain some of the conclusions he makes in Blueprint.
However, the problem with the mantra ‘nature and nurture’ is that it runs the risk of sliding back into the mistaken view that the effects of genes and environment cannot be disentangled.
[…]
Our future is DNA. (Plomin, 2018: 11-12)
The problem with the mantra “nature and nurture” is not that it “runs the risk of sliding back into the mistaken view that the effects of genes and environment cannot be disentangled”—though that is one problem. The problem is how Plomin assumes how DNA works. That DNA can be disentangled from the environment presumes that DNA is environment-independent. But as Moore shows in his book The Dependent Gene—and as Schneider (2007) shows—“the very concept of a gene requires the environment“. Moore notes that “The common belief that genes contain context-independent “information”—and so are analogous to “blueprints” or “recipes”—is simply false” (quoted in Schneider, 2007). Moore showed in The Dependent Gene that twin studies are flawed, as have numerous other authors.
Lewkowicz (2012) argues that “genes are embedded within organisms which, in turn, are embedded in external environments. As a result, even though genes are a critical part of developmental systems, they are only one part of such systems where interactions occur at all levels of organization during both ontogeny and phylogeny.” Plomin—although he does not explicitly state it—is a genetic reductionist. This type of thinking can be traced back, most popularly, to Richard Dawkins’ 1976 book The Selfish Gene. The genetic reductionists can, and do, make the claim that organisms can be reduced to their genes, while developmental systems theorists claim that holism, and not reductionism, better explains organismal development.
The main thrust of Plomin’s Blueprint rests on (1) GWA studies and (2) PGSs/PRSs derived from the GWA studies. Ken Richardson (2017b) has shown that “some cryptic but functionally irrelevant genetic stratification in human populations, which, quite likely, will covary with social stratification or social class.” Richardson’s (2017b) argument is simple: Societies are genetically stratified; social stratification maintains genetic stratification; social stratification creates—and maintains—cognitive differentiation; “cognitive” tests reflect prior social stratification. This “cryptic but functionally irrelevant genetic stratification in human populations” is what GWA studies pick up. Richardson and Jones (2019) extend the argument and argue that spurious correlations can arise from genetic population structure that GWA studies cannot account for—even though GWA study authors claim that this population stratification is accounted for, social class is defined solely on the basis of SES (socioeconomic status) and therefore, does not capture all of what “social class” itself captures (Richardson, 2002: 298-299).
Plomin also heavily relies on the results of twin and adoption studies—a lot of it being his own work—to attempt to buttress his arguments. However, as Moore and Shenk (2016) show—and as I have summarized in Behavior Genetics and the Fallacy of Nature vs Nurture—heritability estimates for humans are highly flawed since there cannot be a fully controlled environment. Moore and Shenk (2016: 6) write:
Heritability statistics do remain useful in some limited circumstances, including selective breeding programs in which developmental environments can be strictly controlled. But in environments that are not controlled, these statistics do not tell us much. In light of this, numerous theorists have concluded that ‘the term “heritability,” which carries a strong conviction or connotation of something “[in]heritable” in the everyday sense, is no longer suitable for use in human genetics, and its use should be discontinued.’ 31 Reviewing the evidence, we come to the same conclusion.
Heritability estimates assume that nature (genes) can be separated from nurture (environment), but “the very concept of a gene requires the environment” (Schneider, 2007) so it seems that attempting to partition genetic and environmental causation of any trait T is a fool’s—reductionist—errand. If the concept of gene depends on and requires the environment, then how does it make any sense to attempt to partition one from the other if they need each other?
Let’s face it: Plomin, in this book Blueprint is speaking like a biological reductionist, though he may deny the claim. The claims from those who push PRS and how it can be used for precision medicine are unfounded, as there are numerous problems with the concept. Precision medicine and personalized medicine are similar concepts, though Joyner and Paneth (2015) are skeptical of its use and have seven questions for personalized medicine. Furthermore, Joyner, Boros and Fink (2018) argue that “redundant and degenerate mechanisms operating at the physiological level limit both the general utility of this assumption and the specific utility of the precision medicine narrative.” Joyner (2015: 5) also argues that “Neo-Darwinism has failed clinical medicine. By adopting a broader perspective, systems biology does not have to.”
Janssens and Joyner (2019) write that “Most [SNP] hits have no demonstrated mechanistic linkage to the biological property of interest.” Researchers can show correlations between disease phenotypes and genes, but they cannot show causation—which would be mechanistic relations between the proposed genes and the disease phenotype. Though, as Kampourakis (2017: 19), genes do not cause diseases on their own, they only contribute to its variation.
Edit: Take also this quote from Plomin and Stumm (2018) (quoted by Turkheimer):
GPS are unique predictors in the behavioural sciences. They are an exception to the rule that correlations do not imply causation in the sense that there can be no backward causation when GPS are correlated with traits. That is, nothing in our brains, behaviour or environment changes inherited differences in DNA sequence. A related advantage of GPS as predictors is that they are exceptionally stable throughout the life span because they index inherited differences in DNA sequence. Although mutations can accrue in the cells used to obtain DNA, like any cells in the body these mutations would not be expected to change systematically the thousands of inherited SNPs that contribute to a GPS.
Turkheimer goes on to say that this (false) assumption by Plomin and Stumm (2018) assumes that there is no top-down causation—i.e., that phenotypes don’t cause genes, or there is no causation from the top to the bottom. (See the special issue of Interface Focus for a slew of articles on top-down causation.) Downward causation exists in biological systems (Noble, 2012, 2017), as does top-down. The very claim that “nothing in our brains, behaviour or environment changes inherited differences in DNA sequence” is ridiculous! This is something that, of course, Plomin did not discuss in Blueprint. But in a book that, supposedly, shows “how DNA makes us who we are”, why not discuss epigenetics? Plomin is confused, because DNA methylation impacts behavior and behavior impacts DNA methylation (Lerner and Overton, 2017: 114). Lerner and Overtone (2017: 145) write that:
… it should no longer be possible for any scientist to undertake the procedure of splitting of nature and nurture and, through reductionist procedures, come to conclusions that the one or the other plays a more important role in behavior and development.
Plomin’s reductionist takes, therefore again, fail. Plomin’s “reluctance” to discuss “tangential topics” to “inherited DNA differences” included epigenetics (Plomin, 2018: 12). But it seems that his “reluctance” to discuss epigenetics was a downfall in his book as epigenetic mechanisms can and do make a difference to “inherited DNA differences” (see for example, Baedke, 2018, Above the Gene, Beyond Biology: Toward a Philosophy of Epigenetics and Meloni, 2019, Impressionable Biologies: From the Archaeology of Plasticity to the Sociology of Epigenetics see also Meloni, 2018). The genome can and does “react” to what occurs to the organism in the environment, so it is false that “nothing in our brains, behaviour or environment changes inherited differences in DNA sequence” (Plomin and Stumm, 2018), since our behavior and actions can and do methylate our DNA (Meloni, 2014) which falsifies Plomin’s claim and which is why he should have discussed epigenetics in Blueprint. End Edit
Conclusion
So the main premise of Plomin’s Blueprint is his two claims: (1) that DNA is a fortune teller and (2) that personal genomics is a fortune-telling device. He draws these big claims from PGS/PRS studies. However, over 80 percent of GWA studies have been done on European populations. And, knowing that we cannot use these datasets on other, non-European datasets, greatly hampers the uses of PGS/PRS in other populations—although the PGS/PRS are not that useful in and of itself for European populations. Plomin’s whole book is a reductionist screed—“Sure, other factors matter, but DNA matters more” is one of his main claims. Though, a priori, since there is no privileged level of causation, one cannot privilege DNA over any other developmental variables (Noble, 2012). To understand disease, we must understand the whole system and how when one part of the system becomes dysfunctional how it affects other parts of the system and how it runs. The PGS/PRS hunts are reductionist in nature, and the only answer to these reductionist paradigms are new paradigms from systems biology—one of holism.
Plomin’s assertions in his book are gleaned from highly confounded GWA studies. Plomin also assumes that we can disentangle nature and nurture—like all reductionists. Nature and nurture interact—without genes, there would be an environment, but without an environment, there would be no genes as gene expression is predicated on the environment and what occurs in it. So Plomin’s reductionist claim that “Our future is DNA” is false—our future is studying the interactive developmental system, not reducing it to a sum of its parts. Holistic biology—systems biology—beats reductionist biology—the Neo-Darwinian Modern Synthesis.
DNA is not a blueprint nor is it a fortune teller and personal genomics is not a fortune-telling device. The claim that DNA is a blueprint/fortune teller and personal genomics is a fortune-telling device come from Plomin and are derived from highly flawed GWA studies and, further, PGS/PRS. Therefore Plomin’s claim that DNA is a blueprint/fortune teller and personal genomics is a fortune-telling device are false.
(Also read Erick Turkheimer’s 2019 review of Plomin’s book The Social Science Blues, along with Steve Pitteli’s review Biogenetic Overreach for an overview and critiques of Plomin’s ideas. And read Ken Richardson’s article It’s the End of the Gene As We Know It for a critique of the concept of the gene.)
Prediction, Accommodation, and Explanation in Science: Are Just-so Stories Scientific?
2300 words
One debate in the philosophy of science is whether or not a scientific hypothesis should make testable predictions or merely explain only what it purports to explain. Should a scientific hypothesis H predict previously unknown facts of the matter or only explain an observation? Take, for example, evolutionary psychology (EP). Any EP hypothesis H can speculate on the so-called causes that led a trait to fixate in a biological population of organisms, but the claim that they can do more than that—that is, that they can generate successful predictions of previously unknown facts not used in the construction of the hypothesis—but that’s all they can do. The claim, therefore, that EP hypotheses are anything but just-so stories, is false.
Prediction and novel facts
For example, Einstein’s theory of general relativity predicted the bending of light, which was a novel prediction for the hypothesis (see pg 177-180 for predictions generated from Einstein’s theory). Fresnel’s wave theory of light predicted different infraction fringes to the prediction of the white spot—a spot which appears in a circular object’s shadow due to Fresnel diffraction (see Worrall, 1989). So Fresnel’s theory explained the diffraction and the diffraction then generated testable—and successful—novel predictions (see Magnus and Douglas, 2013). There is an example of succeful novel prediction. Ad hoc hypotheses are produced “for this” explanation—so the only evidence for the hypothesis is, for example, the existence of trait T. EP hypotheses attempt to explain the fixation of any trait T in humans, but all EP hypotheses do is explain—they generate no testable, novel predictions of previously unknown facts.
A defining feature of science and what it purports to do is to predict facts-of-the-matter which are yet to be known. John Beerbower (2016) explains this well in his book Limits of Science? (emphasis mine):
At this point, it seems appropriate to address explicitly one debate in the philosophy of science—that is, whether science can, or should try to, do more than predict consequences. One view that held considerable influence during the first half of the twentieth venture is called the predictivist thesis: that the purpose of science is to enable accurate predictions and that, in fact, science cannot actually achieve more than that. The test of an explanatory theory, therefore, is its success at prediction, at forecasting. This view need not be limited to actual predictions of future, yet to happen events; it can accommodate theories that are able to generate results that have already been observed or, if not observed, have already occurred. Of course, in such cases, care must be taken that the theory has not simply been retrofitted to the observations that have already been made—it must have some reach beyond the data used to construct the theory.
That a theory or hypothesis explains observations isn’t enough—it must generate successful predictions of novel facts. If it does not generate any novel facts-of-the-matter, then of what use is the hypothesis if it only weakly justifies the phenomenon in question? So now, what is a novel fact?
A novel fact is a fact that’s generated by hypothesis H that’s not used in the construction of the hypothesis. For example, Musgrave (1988) writes:
All of this depends, of course, on our being able to make good the intuitive distinction between prediction and novel prediction. Several competing accounts of when a prediction is a novel prediction for a theory have been produced. The one I favour, due to Elie Zahar and John Worral says that a predicted fact is a novel fact for a theory if it was not used to construct that theory — where a fact is used to construct a theory if it figures in the premises from which that theory was deduced.
Mayo (1991: 524; her emphasis) writes that a “novel fact [is] a newly discovered fact—one not known before used in testing.” So a fact is novel when it predicts a fact of the matter not used in the construction of the hypothesis—i.e., a future event. About novel predictions, Musgrave also writes that “It is only novel predictive success that is surprising, where an observed fact is novel for a theory when it was not used to construct it.” So hypothesis H entails evidence E; evidence E is not used in the construction of hypothesis H, therefore E is novel evidence for hypothesis H.
To philosopher of science Imre Lakatos, a progressive research program is one that generates novel facts, whereas a degenerating research program either fails to generate novel facts or the predictions made that were novel continue to be falsified, according to Musgrave in his article on Lakatos. We can put EP in the “degenerating research program, as no EP hypothesis generates any type of novel prediction—the only evidence for the trait is the existence of the trait.
Evolutionary Psychology
The term “just-so stories” comes from Rudyard Kipling Just-so Stories for Little Children. Then Gould and Lewontin used the term for evolutionary hypotheses that can only explain and not predict future as-of-yet-known events. Law (2016) notes that just-so stories offer “little in the way of independent evidence to suggest that it is actually true.” Sterelny and Griffiths (1999: 61) state that just-so stories are “… an adaptive scenario, a hypothesis about what a trait’s selective history might have been and hence what its function may be.” Examples of just-so stories covered on this blog include: beards, FOXP2, cartels and Mesoamerican ritual sacrifice, Christian storytelling, just-so storytellers and their pet just-so stories, the slavery hypertension hypothesis, fear of snakes and spiders, and cold winter theory. Smith (2016: 278) has a helpful table showing ten different definitions and descriptions of just-so stories:
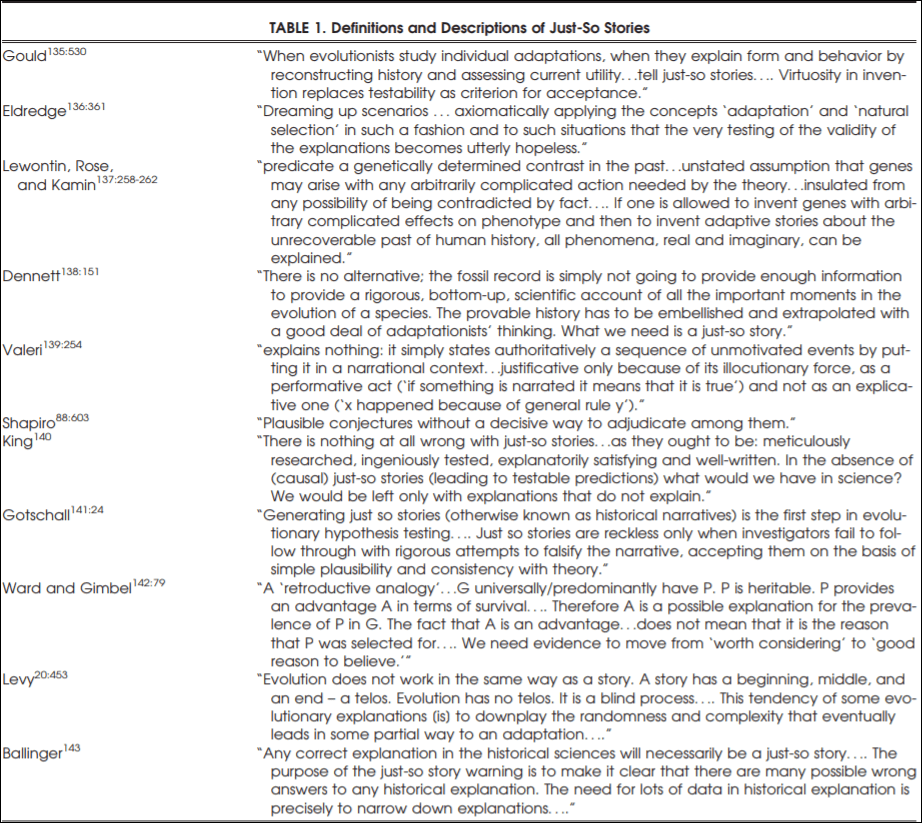
So the defining criterion for just-so stories is that there must be independent evidence to believe the proposed explanation for the existence of the trait. There must be independent reasons to believe a certain hypothesis, as the defining feature of a scientific hypothesis or theory is whether or not it can predict yet-to-happen events. Though, as Beerbower notes, we have to be careful that we do not retrofit the observations.
One can make an observation. Then they can work backward (what Richardson (2007) elicits is “reverse engineering”) and posit (speculate about) a good-sounding story (just-so storytelling) to explain this observation. Reverse engineering is “a process of figuring out the design of a mechanism on the basis of an analysis of the tasks it performs” (Buller, 2005: 92). Of course, the just-so storyteller can then create a story to explain the fixation of the trait in question. But that’s only (purportedly) the explanation of why the trait came to fixation for us to observe it today. There are no testable predictions of previously unknown facts. So it’s all storytelling—speculation.
The theory of natural selection is then deployed to attempt the explain the fixation of trait T in any population. It is true that a hypothesis is weakly corroborated by the existence of trait T, but what makes it a just-so story is the fact that there are no successful predictions of previously unknown facts,
When it comes to EP, one can say that the hypothesis “makes sense” and it “explains” why trait T still exists and went to fixation. However, the story only “makes sense” because there is no other way for it to be—if the story didn’t “make sense”, then the just-so storyteller wouldn’t be telling the story because it wouldn’t satisfy their aims of “proving” that a trait is an adaptation.
Smith (2016:277-278) notes 7 just-so story triggers:
1) proposing a theory-driven rather than a problem-driven explanation, 2) presenting an explanation for a change without providing a contrast for that change, 3) overlooking the limitations of evidence for distinguishing between alternative explanations (underdetermination), 4) assuming that current utility is the same as historical role, 5) misusing reverse engineering, 6) repurposing just-so stories as hypotheses rather than explanations, and 7) attempting to explain unique events that lack comparative data.
EP is most guilty of (3), (4), (5), (6), and (7). It is guilty of (3) in that it hardly ever posits other explanations for trait T, it’s always “adaptation”, as EP is an adaptationist paradigm. It is guilty of (4) perhaps the most. That trait T still exists and is useful for this today is not evidence that trait T was selected-for its use as we see it today. This then leads to (5) which is the misuse of reverse engineering. Just-so stories are ad hoc (“for this”) explanations and these types of explanations are ad hoc if there is no independent data for the hypothesis. Of course, it is guilty of (7) in that it attempts to explain, of course, unique events in human evolution. Many problems exist for evolutionary psychology (see for example Samuels, 1998; Lloyd, 1999; Prinz, 2006;), but the biggest problem is the ability of any hypothesis to generate testable, novel predictions. Smith (2016: 279) further writes that:
An important weakness in the use of narratives for scientific purposes is that the ending is known before the narrative is constructed. Merton pointed out that a “disarming characteristic” of ex post facto explanations is that they are always consistent with the observations because they are selected to be so.
Bo Winegard, in his defense of just-so storytelling, writes “that inference to the best explanation most accurately describes how science is (and ought to be) practiced. According to this description, scientists forward theories and hypotheses that are coherent, parsimonious, and fruitful.” However, as Smith (2016: 280-281) notes, that a hypothesis is “coherent”, “parsimonious” and “fruitful” (along with 11 more explanatory virtues of IBE, including depth, precision, consilience, and simplicity) is not sufficient to accept IBE—IBE is not a solution to the problems proposed by the just-so story critics as the slew of explanatory virtues do not lend evidence that T was an adaptation and thusly do not lend evidence that hypothesis H is true.
Simon (2018: 5) concludes that “(1) there is much rampant speculation in evolutionary psychology as to the reasons and the origin for certain traits being present in human beings, (2) there is circular reasoning as to a particular trait’s supposed advantage in adaptability in that a trait is chosen and reasoning works backward to subjectively “prove” its adaptive advantage, (3) the original classical theory is untestable, and most importantly, (4) there are serious doubts as to Natural Selection, i.e., selection through adaptive advantage, being the principal engine for evolution.” (1) is true since that’s all EP is—speculation. (2) is true in evolutionary psychologists notice trait T and that, since it survived today, there must be a function it performs for why natural selection “selected” the trait to propagate in species (though selection cannot select-for certain traits). (3) it is untestable in that we have no time machine to go back and watch how trait T evolved (this is where the storytelling narrative comes in: if only we had a good story to tell about the evolution of trait T). And finally, (4) is also true since natural selection is not a mechanism (see Fodor, 2008; Fodor and Piattelli-Palmarini, 2010).
EP exists in an attempt to explain so-called psychological adaptations humans have to the EEA (environment of evolutionary adaptiveness). So one looks at the current phenotype and then looks to the past in an attempt to construct a “story” which shows how a trait came to fixation. There are, furthermore, no hallmarks of adaptation. When one attempts to use selection theory to explain the fixation of trait T, they must wrestle with spandrels. Spandrels are heritable, can increase fitness, and they are selected as well—as the whole organism is selected. This also, of course, falls right back to Fodor’s (2008) argument against natural selection. Fodor (2008: 1) writes that the central claim of EP “is that heritable properties of psychological phenotypes are typically adaptations; which is to say that they are typically explained by their histories of selection.” But if “psychological phenotypes” cannot be selected, then the whole EP paradigm crumbles.
Conclusion
This is why EP is not scientific. It cannot make successful predictions of previously unknown facts not used in the construction of the hypothesis, it can only explain what it purports to explain. The claim, therefore, that EP hypotheses are anything but just-so stories is false. One can create good-sounding narratives for any type of trait. But that they “sound good” to the ear, and are “plausible” are not reasons to believe that the story told is true.
Are all hypotheses just-so stories? No. Since a just-so story is an ad hoc hypothesis and a hypothesis is ad hoc if it cannot be independently verified, then a hypothesis that makes predictions which can be independently verified are not just-so stories. There are hypotheses that generate no predictions, ad hoc hypotheses (where the only evidence to believe H is the existence of trait T), and hypotheses that generate novel predictions. EP is the second of these—the only evidence we have to believe H is true is that trait T exists. Independent evidence is a necessary condition of science—that is, the ability of a hypothesis to predict novel evidence is a necessary condition for science. That no EP hypothesis can generate a successful novel prediction is evidence that all EP hypotheses are just-so stories. So for the criticism to be refuted, one would have to name an EP hypothesis that is not a just-so story—that is, (1) name an EP hypothesis, (2) state the prediction, and then (3) state how the prediction follows from the hypothesis.
To be justified in believing hypothesis H in explaining how trait T became fixated in a population there must be independent evidence for this belief. The hypothesis must generate a novel fact which was previously unknown before the hypothesis was constructed. If the hypothesis cannot generate any predictions, or the predictions it makes are continuously falsified, then the hypothesis is to be rejected. No EP hypothesis can generate successful predictions of novel facts and so, the whole EP enterprise is a degenerative research program. The EP paradigm explains and accommodates, but no EP hypothesis generates independently confirmable evidence for any of its hypotheses. Therefore EP is not a scientific program and just-so stories are not scientific.
African Neolithic Part 1: Amending Common Misunderstandings
One of the weaknesses, in my opinion, to HBD is the focus on the Paleolithic and modern eras while glossing over the major developments in between. For instance, the links made between Paleolithic Western Europe’s Cromagnon Art and Modern Western Europe’s prowess (note the geographical/genetic discontinuity there for those actually informative on such matters).
Africa, having a worst archaeological record due to ideological histories and modern problems, leaves it rather vulnerable to reliance on outdated sources already discussed before on this blog. This lack of mention however isn’t strict.
Eventually updated material will be presented by a future outline of Neolithic to Middle Ages development in West Africa.
A recent example of an erroneous comparison would be in Heiner Rindermann’s Cogntivie Capitalism, pages 129-130. He makes multiple claims on precolonial African development to explained prolonged investment in magical thinking.
- Metallurgy not developed independently.
- No wheel.
- Dinka did not properly used cattle due to large, uneaten, portions left castrated.
- No domesticated animals of indigenous origin despite Europeans animals being just as dangerous, contra Diamond (lists African dogs, cats, antelope, gazelle, and Zebras as potential specimens, mentions European Foxes as an example of a “dangerous” animal to be recently domesticated along with African Antelopes in the Ukraine.
- A late, diffused, Neolithic Revolution 7000 years following that of the Middle East.
- Less complex Middle Age Structure.
- Less complex Cave structures.
Now, technically, much of this falls outside of what would be considered “neolithic”, even in the case of Africa. However, understanding the context of Neolithic development in Africa provides context to each of these points and periods of time by virtue of causality. Thus, they will be responded by archaeological sequence.
Dog domestication, Foxes, and human interaction.
The domestication of dogs occurred when Eurasian Hunter-Gathers intensified megafauna hunting, attracting less aggressive wild dogs to tame around 23k-25k ago. Rindermann’s mention of the fox experiment replicates this idea. Domestication isn’t a matter of breaking the most difficult of animals, it’s using the easiest ones to your advantage.
In this same scope, this needs to be compared to Africa’s case. In regards to behavior they are rarely solitary, so attracting lone individuals is already impractical. The species likewise developed under a different level of competition.
They were probably under as much competition from these predators as the ancestral African wild dogs were under from the guild of super predators on their continent.
What was different, though, is the ancestral wolves never evolved in an enviroment which scavenging from various human species was a constant threat, so they could develop behaviors towards humans that were not always characterized by extreme caution and fear.
Europe in particular shows that carnivore density was lower, and thus advantageous to hominids.
Consequently, the first Homo populations that arrived in Europe at the end of the late Early Pleistocene found mammal communities consisting of a low number of prey species, which accounted for a moderate herbivore biomass, as well as a diverse but not very abundant carnivore guild. This relatively low carnivoran density implies that the hominin-carnivore encounter rate was lower in the European ecosystems than in the coeval East African environments, suggesting that an opportunistic omnivorous hominin would have benefited from a reduced interference from the carnivore guild.
This would be a pattern based off of megafaunal extinction data.
The first hints of abnormal rates of megafaunal loss appear earlier, in the Early Pleistocene in Africa around 1 Mya, where there was a pronounced reduction in African proboscidean diversity (11) and the loss of several carnivore lineages, including sabertooth cats (34), which continued to flourish on other continents. Their extirpation in Africa is likely related to Homo erectus evolution into the carnivore niche space (34, 35), with increased use of fire and an increased component of meat in human diets, possibly associated with the metabolic demands of expanding brain size (36). Although remarkable, these early megafauna extinctions were moderate in strength and speed relative to later extinctions experienced on all other continents and islands, probably because of a longer history in Africa and southern Eurasia of gradual hominid coevolution with other animals.
This fundamental difference in adaptation to human presence and subsequent response is obviously a major detail in in-situ animal domestication.
Another example would be the failure of even colonialists to tame the Zebra.
Of course, this alone may not be good enough. One can nonetheless cite the tame-able Belgian Congo forest Elephant, or Eland. Therefore we can just ignore regurgitating Diamond.
This will just lead me to my next point. That is, what’s the pay-off?
Pastoralism and Utility
A decent test to understand what fauna in Africa can be utilized would the “experiments” of Ancient Egyptians, who are seen as the Eurasian “exception” to African civilization. Hyenas, and antelope from what I’ve, were kept under custody but overtime didn’t resulted in selected traits. The only domesticated animal in this region would be Donkeys, closer relatives to Zebras.
This brings to light another perspective to the Russian Fox experiments, that is, why have pet foxes not been a trend for Eurasians prior to the 20th century? It can be assumed then that attempts of animals domestication simply where not worth investment in the wake of already domesticated animals, even if one grew up in a society/genetic culture at this time that harnessed the skills.
For instance, a slow herd of Eland can be huddled and domesticated but will it pay off compared to the gains from investing into adapting diffused animals into a new environment? (This will be expanded upon as well into the future).
Elephants are nice for large colonial projects, but unique herding discouraging local diseases that also disrupts population density again effects the utility of large bodied animals. Investing in agriculture and iron proved more successful.
Cats actually domesticated themselves and lacked any real utility prior to feasting on urban pests. In Africa, with highly mobile groups as will be explained later, investment in cats weren’t going to change much. Wild Guineafowl, however, were useful to tame in West Africa and use to eat insects.
As can be seen here, Pastoralism is roughly as old in Africa diffused from the Middle East as compared to Europe. Both lacked independently raised species prior to it and making few innovations in regard to in situ beasts beyond the foundation. (Advancement in plant management preceding developed agriculture, a sort of skill that would parallel dog domestication for husbandry, will be discussed in a future article).
And given how advanced Mesoamericans became without draft animals, as mentioned before, their importance seems to be overplayed from a pure “indigenous” perspective. The role in invention itself ought be questioned as well in what we can actually infer.
Borrowed, so what?
In a thought experiment, lets consider some key details in diffusion. The invention of Animal Domestication or Metallurgy is by no means something to be glossed over as an independent invention. Over-fixating on this however in turn glosses over some other details on successful diffusion.
Why would a presumably lower apt population adopt a cognitively demanding skill, reorient it’s way of society around it, without attributing this change to an internal change of character compared to before? Living in a new type of economy system as a trend it undoubtedly bound to result in a new population in regards to using cognition to exploit resources. This would require contributions to their own to the process.
This applies regards to African Domesticated breeds,
Viewing domestication as an invention also produces a profound lack of curiosity about evolutionary changes in domestic species after their documented first appearances. [……] African domesticates, whether or not from foreign ancestors, have adapted to disease and forage challenges throughout their ranges, reflecting local selective pressures under human management. Adaptations include dwarfing and an associated increase in fecundity, tick resistance, and resistance to the most deleterious effects of several mortal infectious diseases. While the genetics of these traits are not yet fully explored, they reflect the animal side of the close co-evolution between humans and domestic animals in Africa. To fixate upon whether or not cattle were independently domesticated from wild African ancestors, or to dismiss chickens’ swift spread through diverse African environments because they were of Asian origin, ignores the more relevant question of how domestic species adapted to the demands of African environments, and how African people integrated them into their lives.
The same can be said for Metallurgy,
We do not yet knowwhether the seventh/sixth century Phoenician smelt-ing furnace from Toscanos, Spain (illustrated byNiemeyer in MA, p.87, Figure 3) is typical, but it isclearly very different from the oldest known iron smelt-ing technology in sub-Saharan Africa. Almost all pub-lished iron smelting furnaces of the first millennium calBC from Rwanda/Burundi, Buhaya, Nigeria, Niger,Cameroon, Congo, Central African Republic and Ga-bon are slag-pit furnaces, which are so far unknownfrom this or earlier periods in the Middle East or NorthAfrica. Early Phoenician tuyères, which have squareprofiles enclosing two parallel (early) or converging(later) narrow bores are also quite unlike those de-scribed for early sites in sub-Saharan Africa, which arecylindrical with a single and larger bore.
African ironworkers adapted bloomery furnacesto an extraordinary range of iron ores, some of whichcannot be used by modern blast furnaces. In bothnorthern South Africa (Killick & Miller 2014)andinthe Pare mountains of northern Tanzania (Louise Ilespers. comm., 2013) magnetite-ilmenite ores contain-ing up to 25 per cent TiO2(by mass) were smelted.The upper limit for TiO2in iron ore for modernblast furnaces is only 2 per cent by mass (McGan-non 1971). High-titanium iron ores can be smeltedin bloomery furnaces because these operate at lowertemperatures and have less-reducing furnace atmo-spheres than blast furnaces. In the blast furnace tita-nium oxide is partially reduced and makes the slagviscous and hard to drain, but in bloomery furnacesit is not reduced and combines with iron and siliconoxide to make a fluid slag (Killick & Miller 2014). Blastfurnace operators also avoid ores containing morethan a few tenths of a percent of phosphorus or ar-senic, because when these elements are dissolved inthe molten iron, they segregate to grain boundaries oncrystallization, making the solid iron brittle on impact.
Bulls (and rams) are often, but not necessarily, castrated at a
fairly advanced age, probably in part to allow the conformation and characteristics of the animal to become evident before
the decision is made. A castrated steer is called muor buoc, an
entire bull thon (men in general are likened to muor which are
usually handsome animals greatly admired on that account; an
unusually brave, strong or successful man may be called thon,
that is, “bull with testicles”). Dinka do not keep an excess of
thon, usually one per 10 to 40 cows. Stated reasons for the
castration of others are for important esthetic and cultural
reasons, to reduce fighting, for easier control, and to prevent
indiscriminant or repeat breeding of cows in heat (the latter
regarded as detrimental to pregnancy and accurate
genealogies).
Since then, Pearl Millet, Rice, Yams, and Cowpeas have been confirmed to be indigenous crops to the area. This is against hypotheses of others. Multiple studies show late expansion southwards, thus likely linking them to Niger-Kongo speakers. Modern SSA genetics revealed farmer population expansion signals similar to that of Neolithic ancestry in Europeans to their own late date of agriculture in the region as well.
Renfrew
Made multiple remarks on Africa’s “exemplars”, trying to construct a sort of perpetual gap since the Paleolithic by citing Renfew’s Neuroscience, evolution and the sapient paradox: the factuality of value and of the sacred. However, Renfrew doesn’t quite support the comparisons he made and approaches a whole different point.
The discovery of clearly intentional patterning on fragments of red ochre from the Blombos Cave (at ca 70 000 BP) is interesting when discussing the origins of symbolic expression. But it is entirely different in character, and very much simpler than the cave paintings and the small carved sculptures which accompany the Upper Palaeolithic of France and Spain (and further east in Europe) after 40 000 BP.[….]
It is important to remember that what is often termed cave art—the painted caves, the beautifully carved ‘Venus’ figurines—was during the Palaeolithic (i.e. the Pleistocene climatic period) effectively restricted to one developmental trajectory, localized in western Europe. It is true that there are just a few depictions of animals in Africa from that time, and in Australia also. But Pleistocene art was effectively restricted to Franco-Cantabria and its outliers.
It was not until towards the end of the Pleistocene period that, in several parts of the world, major changes are seen (but see Gamble (2007) for a more nuanced view, placing more emphasis upon developments in the Late Palaeolithic). They are associated with the development of sedentism and then of agriculture and sometimes stock rearing. At the risk of falling into the familiar ‘revolutionary’ cliché, it may be appropriate to speak of the Sedentary Revolution (Wilson 1988; Renfrew 2007a, ch. 7).[….] Although the details are different in each area, we see a kind of sedentary revolution taking place in western Asia, in southern China, in the Yellow River area of northern China, in Mesoamerica, and coastal Peru, in New Guinea, and in a different way in Japan (Scarre 2005).
Weil (2014) paints a picture of African development in 1500, both relative to the rest of the world and heterogeneity within the continent itself, using as his indicators population density, urbanization, technological advancement, and political development. Ignoring North Africa, which was generally part of the Mediterranean world, the highest levels of development by many indicators are found in Ethiopia and in the broad swathe of West African countries running from Cameroon and Nigeria eastward along the coast and the Niger river. In this latter region, the available measures show a level of development just below or sometimes equal to that in the belt of Eurasia running from Japan and China, through South Asia and the Middle East, into Europe. Depending on the index used, West Africa was above or below the level of development in the Northern Andes and Mexico. Much of the rest of Africa was at a significantly lower level of development, although still more advanced than the bulk of the Americas or Australia.
Richard Fuerle and OOA: Morphological and Genetic Incongruencies
This is a topic I’ve been wanting to do for a while. Though it can be said that many scientists who investigate topics receive public outcry to a return of racial segregationist ideology in academia to an unfair extent. It would be odd however to apply the same towards Richard Fuerle, and not in any ironic way. He basically peddled the Carleton Coon Multiregional Theory that not even Multi-regionalists would buy, but a quick Google search will lead you to those who would (not the most unbiased group).
The intent of this article is to show how a decent chunk of Fuerle’s arguments are indeed outdated and doesn’t jive with current evidence. While not a review of the whole book, this post will demonstrate enough basic facts that should convince you to discourage his arguments.
Credentials-
First page (the hardest in my opinion) and none in biology. For reference, I encourage commenters to cite from the book if they take issue with my criticisms, as I’m only paraphrasing from this point forward simply because of this.
Bone density-
Quick and simple (and somewhat setting a pattern), this is a trait that RR has talked about in the past with others still getting it wrong. Rather than a reduced or adaptive specialization, bone density in modern European came as a result of sedentary behavior from the Neolithic.
Sedentary living among Sub Saharans is far more recent, even with crops going back several millennia B.C.E intensification wasn’t that common until plantations were used during the slave trade. Shifting Cultivation, though variable, was the norm. I’ll touch upon this in a future article on the African Neolithic.
Dentition:
One of his other pitfall were the implications pf Shovel Teeth in Modern Populations.
- The high rate of such is indicative of modern phylogenic ancestry, supporting the case of Asians.
- The trait in Asians derives from Peking Man.
Both are pretty much refuted by archaic and modern variants being different. And contra to the expectations of his estimates of human divergences being millions of years old, Europeans are closer to Modern Africans than Neanderthals in dentition. This also refutes assertion on the primitive nature of Africans compared to other humans in the case of phylogenics. On the particular features, it’s another story.
In this case there’s no need to look any further than the works of Joel Irish, who I’m willing to bet is unparalleled in this topic in modern research.
Retention of primitive features was something that went back to African migrants into Eurasia, Homo Sapiens both recent and past having long retained archaic traits.
We recently examined whether or not a universal criterionfor dental modernity could be defined (Bailey and Hublin2013). Like cranial morphology, dental morphology shows amarked range of variation; so much that multiple geographicdental patterns (e.g., Mongoloid, Proto-Sundadont, Indodont,Sub-Saharan African, Afridont, Caucasoid, Eurodont, Sun-dadont, Sinodont) have been identified in recent humans(Hanihara 1969,1992; Mayhall et al. 1982; Turner 1990;Hawkey 1998; Irish 1998,2013; Scott et al. 2013). Ouranalysis confirmed that, while some populations retain higherfrequencies of ancestral (i.e., primitive) dental traits [e.g.,Dryopithecus molar, moderate incisor shoveling (Irish 1997)]and others show higher frequencies of recently evolved (i.e.,derived) dental traits [e.g., double shoveling, four-cuspedlower molars (Turner 1983; Irish and Guatelli-Steinberg2003)], all recent humans show some combination of bothprimitive and derived traits (Bailey and Hublin 2013).
Africans tend to have higher frequencies in retained features, but in the context of recent Eurasian variants, this is to be expected and Irish have actually used this data to support an African dispersal.
Assuming that phenetic expression approximates genetic variation, previous dental morphological analyses of Sub-Saharan Africans by the author show they are unique among the world’s modern populations. Numerically-derived affinities, using the multivariate Mean Measure of Divergence statistic, revealed significant differences between the Sub-Saharan folk and samples from North Africa, Europe, Southeast Asia, Northeast Asia and the New World, Australia/Tasmania, and Melanesia. Sub-Saharan Africans are characterized by a collection of unique, mass-additive crown and root traits relative to these other world groups. Recent work found that the most ubiquitous of these traits are also present in dentitions of earlier hominids, as well as extinct and extant non-human primates; other ancestral dental features are also common in these forms. The present investigation is primarily concerned with this latter finding. Qualitative and quantitative comparative analyses of Plio-Pleistocene through recent samples suggest that, of all modern populations, Sub-Saharan Africans are the least derived dentally from an ancestral hominid state; this conclusion, together with data on intra- and inter-population variability and divergence, may help provide new evidence in the search for modern human origins.
The same was done by his colleague who first posited an West Asian origin as Fuerle did (undoubtedly on much firmer grounds). Has recently integrated this into modern OOA.
To date, the earliest modern human fossils found outside of Africa are dated to around 90,000 to 120,000 years ago at the Levantine sites of Skhul and Qafzeh. A maxilla and associated dentition recently discovered at Misliya Cave, Israel, was dated to 177,000 to 194,000 years ago, suggesting that members of the Homo sapiens clade left Africa earlier than previously thought. This finding changes our view on modern human dispersal and is consistent with recent genetic studies, which have posited the possibility of an earlier dispersal of Homo sapiens around 220,000 years ago. The Misliya maxilla is associated with full-fledged Levallois technology in the Levant, suggesting that the emergence of this technology is linked to the appearance of Homo sapiens in the region, as has been documented in Africa.
This then smoothly glides into the next topic.
Craniofacial data-
Thus we also find that the basis of modern diversification is recent, as in below 50k in age.
On the appearance of Modern East Asian and Native Americans Traits,
Our results show strong morphological affinities
among the early series irrespective of geographical origin,
which together with the matrix analyses results
favor the scenario of a late morphological differentiation
of modern humans. We conclude that the geographic
differentiation of modern human morphology is a late
phenomenon that occurred after the initial settlement
of the Americas.
On the features of earlier Paleoamericans.
During the last two decades, the idea held by some
late 19th and early 20th century scholars (e.g., Lacerda
and Peixoto, 1876; Rivet, 1908) that early American populations
presented a distinct morphological pattern from
the one observed among recent Native Americans, has
been largely corroborated. Studies assessing the morphological
affinities of early American crania have shown
that crania dating to over seven thousand years BP generally
show a distinct morphology from that observed in
later populations. This observation is better supported in
South America, where larger samples of early specimens
are available: population samples from central Brazil
(Lagoa Santa; Neves and Hubbe, 2005; Neves et al.,
2007a) and Colombia (Bogota´ Savannah; Neves et al.,
2007b) as well as in isolated specimens from Southeast
Brazil (Capelinha; Neves et al., 2005), Northeast Brazil
(Toca dos Coqueiros; Hubbe et al., 2007) and Southern
Chile (Palli Aike; Neves et al., 1999). Distinct cranial
morphology has also been observed in early skulls from
Meso-America (Mexico; Gonzalez-Jose´ et al., 2005) and
North America (Jantz and Owsley, 2001; Powell, 2005).
This evidence has recently demonstrated that the
observed high levels of morphological diversity within
the Americas cannot simply be attributed to bias resulting
from the small available samples of early crania, as
was previously suggested (Van Vark et al., 2003).
Recent Native American cranial morphology varies
around a central tendency characterized by short and
wide neurocrania, high and retracted faces, and high
orbits and nasal apertures. In contrast, the early South andMeso-American (hereafter Paleoamerican) crania
tend to vary around a completely different morphology:
long and narrow crania, low and projecting faces, and
low orbits and nasal apertures (Neves and Hubbe, 2005).
These differences are not subtle, being of roughly the
same magnitude as the difference observed between
recent Australian aborigines and recent East Asians
(Neves and Hubbe, 2005; Neves et al., 2007a,b; but see
Gonza´lez-Jose´ et al., 2008 for a different opinion). When
assessed within the comparative framework of worldwide
craniometric human variation, Paleoamerican groups
show morphological affinities with some Australo-Melanesian
and African samples, while Amerindian groups
Earlier waves of Native Americans were replaced by later waves of migrants from Asia with latter specializations.
The same can be demonstrated in Africa.
For the second half of the Late Pleistocene and the period pre-ceding the Last Glacial Maximum (LGM) (i.e., MIS 3), the only twosites with well preserved and securely dated human remains areNazlet Khater 2 (38 ±6 Ky, Egypt; Crevecoeur, 2008) and Hofmeyr(36.2 ±3.3 Ky, South Africa; Grine et al., 2007). These fossilsrepresent additional evidence for Late Pleistocene phenotypicvariability of African sub-groups. The Hofmeyr specimen exhibitsthe greatest overall similarities to early modern human specimensfrom Europe rather than to Holocene San populations from thesame region (Grine et al., 2007). Moreover, the Nazlet Khater 2specimen preserves archaic features on the cranium and themandible more comparable to those of Late Middle Pleistocene andearly Late Pleistocene fossils than to chronologically closer recent
African populations (Crevecoeur, 2012). These specimens representaspects of modern human phenotypic variation not found in cur-rent populations. This situation seems to have lasted until thebeginning of the Holocene in the African fossil record, not only inthe northeastern part of the continent (Crevecoeur et al., 2009) butalso in the west central (Iwo Eleru, Nigeria, Harvati et al., 2011;Stojanowski, 2014) and eastern regions (Lukenya Hill, Kenya,Tryon et al., 2015). During the Holocene, an increased homogeni-zation of cranio-morphological features is documented, particu-larly within sub-Saharan Africa, with its peak during and after theBantu expansion from 6 Ky ago (Ribot, 2011).
Without Ambiguity, the EUP like Hofmeyr skull was found to be archaic relative to recent SSA.
Although the supraorbital torus is comparable in thickness to that in UP crania, its continuous nature represents a more archaic morphology ( 26 ). In this regard, Hofmeyr is more primitive than later sub-Saharan LSA and North African UP specimens (such as Lukenya Hill and Wadi Kubbaniya), even though they may have a somewhat thicker medial supraorbital eminence. Despite its glabellar prominence and capacious maxillary sinuses, Hofmeyr exhibits only incipient frontal sinus development, a condition that is uncommon among European UP crania ( 27 ). The mandibular ramus has a well-developed gonial angle, and the slender coronoid process is equivalent in height to the condyle. The mandibular (sigmoid) notch is deep and symmetrical, and its crest intersects the lateral third of the condyle. The anterior margin of the ramus is damaged, but it is clear that there was no retro- molar gap. The Hofmeyr molars are large. The bucco- lingual diameter of M 2 exceeds recent African and Eurasian UP sample means by more than 2 SD (table S3). Radiographs reveal cynodont molars, although pulp chamber height is likely to have been affected by the deposition of secondary dentine in these heavily worn teeth. Thus, Hofmeyr is seemingly primitive in comparison to recent African crania in a number of features, including a prominent glabella; moderately thick, continuous supraorbital tori; a tall, flat, and straight malar; a broad frontal process of the maxilla; and comparatively large molar crowns.
One of unique traits to Modern Eurasians is a measurable increase in Cranial Index.
Craniometric data have been collected from published and unpublished reports of numerous authors on 961 male and 439 female crania from various sites in Subsaharan Africa spanning the last 100 ka. All data available in the literature, irrespective of their “racial” affinities, were used to cover the prehistoric and early historic times (up to 400 a BP). Samples covering the last 400 years do not include European colonists and consist of skeletons exavated at archeological sites, collected by early European travelers and derived from anatomical collections. Cranial capacity, depending on the mode of its calculation, has decreased by 95–165 cm3 among males and by 74–106 cm3 among females between the Late Stone Age (30-2 ka BP) and modern times (last 200 years). Values of the cranial index did not show any trend over time and their averages remained in the dolichocephalic category. The decrease in cranial capacity in Subsaharan Africa is similar to that previously found in Europe, West Asia, and North Africa, but, unlike the latter, it is not accompanied by brachycephalization. © 1993 Wiley-Liss, Inc.
It’s worth noting in even Fuerle’s data, despite emphasizing this trait in a singular black example, Caucasians have a larger browridge by comparison. Black were described as small in comparison in this trait. Likewise, the data indicates that the skulls were generally smoother and rounder with more receded Cheekbones.
On a comprehensive look on how these difference, this paper seems sufficient.
Population variation.
Morphological characteristics of the orbit that are most variable among the
African, Asian, and European samples include orbital volume (obv), orbital depth (obd), basion-superior orbit (bso), and orbital breadth (obb), and are also those that contribute most to group separation in the multivariate analyses. Interorbital breadth (dkb), biorbital Samples Asian European African 20.9960 31.2139 Asian 15.4776 Samples Asian European African 1.80745 3.19353 Asian 3.70921
68 breadth (ekb), and basion-orbitale (bio) were not found to be statistically different among these samples, however the low significance value for basion-orbitale in a one-way analysis of variance (p = 0.055) indicates that some degree of divergence exists among them. Additionally, while a significance test was not carried out for “shape” of the orbital margins, it is clear that general differences exist among groups. The most notable difference is between the Asian and African samples, in which the former possesses high and narrow orbits (a more rounded shape), and the latter is characterized by lower and wider orbital margins (a more rectangular shape).
Hominin trends
This current investigation reveals that the orbital
margins vary in association with these long-term evolutionary changes, becoming
vertically shorter, horizontally elongated, more frontated, and retracted relative to basion, with a greater degree of reduction in the inferior orbital margins.
In otherwords, the Rectangular Shape of “Negroids” are a retention, but towards a baseline Sapiens trend.
The wide rectangular shape of the orbital margins resulting from a shift in relative
size of orbital height and orbital breadth is highly characteristic of anatomically modern humans from the Upper Paleolithic in Europe and Asia (chapter 5), and extant groups from Sub-Saharan Africa (chapter 3). Following the Upper Paleolithic however, the trend toward superoinferiorly shorter and more elongated orbits associated with a grade shift in craniofacial form began to reverse, and the orbital margins become taller and narrower, taking on a more rounded shape. This more recent trend has also been documented among East Asian groups dating to the Holocene (Brown & Maeda, 2004; Wu et al. 2007), and is investigated as part of a larger examination of orbital change through the European Upper Paleolithic in chapter 5 of this thesis.
On the specifics, Eurasians.
In looking at size and shape of the orbital margins it can be seen that orbital breadth does not vary in relation to cranial shape, but does decrease as the upper facial index increases, with the same being true of biorbital breadth. In contrast, orbital height is positively correlated with both shape features, which one might expect particularly in relation to the upper facial index, in which a vertical increase in facial height and decrease in facial width would be assumed to affect in a similar way these same dimensions of the orbit. However, Brown & Maeda (2004) found that throughout the Neolithic in China, orbital height increases substantially even while facial height is reduced in that region.
In nearly every case, orbital variables are more highly correlated with shape of the
face than with shape of the head, which is understandable given their inclusion in the facial framework. However, the relationship between basion-orbitale and basion-superior orbit is negatively correlated with both cranial and facial shape variables and to approximately the same degree. This is of particular interest given that the upper facial index comprises two variables that indicate the relationship between height and width of the face in the coronal plane, though measures of basion-orbitale and basion-superior orbit lie in the parasagittal plane. Orbital depth also decreases in association with increased facial height and decreased facial breadth, but is not statistically related to change in cranial shape. This too is surprising given that orbital depth might be expected to decrease more as a result of anterior-posterior shortening of the skull rather than in relation to a narrowing and elongation of the face. 104 Although the direction and magnitude of the relationship between orbital morphology and craniofacial shape largely mimics observed changes in orbital features during the last 30,000 years in Western Europe (section 5.4 above), orbital size deviates slightly from this pattern. Both orbital volume and the geometric mean of orbital height, breadth, and depth remained relatively unchanged since the Upper Paleolithic, however both show a statistically significant negative relationship to the upper facial index, meaning that as the face becomes taller and narrower, space within the orbits is diminished.
Brown and Maeda (2004) show that among skulls of Australian Aborigines and
Tohoku Japanese, which represent changing craniofacial form since the end of the
Pleistocene, orbital volume is highly correlated with supraorbital breadth, lower facial prognathism, and shape of the orbital margins. Among these crania a broader
supraorbital region, more projecting facial skeleton and lower orbital index (more
rectangular shape) are associated with a larger orbital volume. Change in these features, including a strong trend toward higher and narrower orbits, is considered to reflect a decrease in orbital volume that occurred throughout the Holocene in China (Brown & Maeda, 2004).
Africans’ Prognathism and inter Orbital breath can be accounted for here. Pg 13. Explains an association between interorbital breadth and prognathism. Within South Africans, however, wide breadth compensates for a low prognathic profile on page 229-230. In Africans, compare to African Americans, it is more variable. On Page 216 it notes how the role for robust craniofacial features do not correlate with browridge size. Uncorrelated features can be explained by geography for instance.
Fossils-
Richard Fuerle noted the particularly archaic nature of the 100-300k Kabwe/Broken Hill skull in contrast to Modern Humans in Ethiopia. He, in totality with modern “retentions”, asserted that this proved that African pecularities were long standing and postulated that the Middle East was the actual home of human origins.
Some problems with this logic are similar findings In Europe and Asia. Despite being contemporary with Neanderthals by context, the morphology of the Ceprano skull is closer to the LCA with Sapiens.
By contrast, Rhodesiensis existed alongside others that show more marked Sapiens differientation like the South African Florisbad mention here.
Others may mention the Iwo Eleru finding. That isn’t unique to Africa either, as the Red Deer Cave people will show. On their origins.
Our analysis suggests two plausible explanations for the morphology sampled at Longlin Cave and Maludong. First, it may represent a late-surviving archaic population, perhaps paralleling the situation seen in North Africa as indicated by remains from Dar-es-Soltane and Temara, and maybe also in southern China at Zhirendong. Alternatively, East Asia may have been colonised during multiple waves during the Pleistocene, with the Longlin-Maludong morphology possibly reflecting deep population substructure in Africa prior to modern humans dispersing into Eurasia.
More specifically.
The number of Late Pleistocene hominin species and the timing of their extinction are issues receiving renewed attention following genomic evidence for interbreeding between the ancestors of some living humans and archaic taxa. Yet, major gaps in the fossil record and uncertainties surrounding the age of key fossils have meant that these questions remain poorly understood. Here we describe and compare a highly unusual femur from Late Pleistocene sediments at Maludong (Yunnan), Southwest China, recovered along with cranial remains that exhibit a mixture of anatomically modern human and archaic traits. Our studies show that the Maludong femur has affinities to archaic hominins, especially Lower Pleistocene femora. However, the scarcity of later Middle and Late Pleistocene archaic remains in East Asia makes an assessment of systematically relevant character states difficult, warranting caution in assigning the specimen to a species at this time. The Maludong fossil probably samples an archaic population that survived until around 14,000 years ago in the biogeographically complex region of Southwest China.
Our results indicate that the Hexian teeth are metrically and morphologically primitive and overlap with H. ergaster and East Asian Early and mid-Middle Pleistocene hominins in their large dimensions and occlusal complexities. However, the Hexian teeth differ from H. ergaster in features such as conspicuous vertical grooves on the labial/buccal surfaces of the central incisor and the upper premolar, the crown outline shapes of upper and lower molars and the numbers, shapes, and divergences of the roots. Despite their close geological ages, the Hexian teeth are also more primitive than Zhoukoudian specimens, and resemble Sangiran Early Pleistocene teeth. In addition, no typical Neanderthal features have been identified in the Hexian sample. Our study highlights the metrical and morphological primitive status of the Hexian sample in comparison to contemporaneous or even earlier populations of Asia. Based on this finding, we suggest that the primitive-derived gradients of the Asian hominins cannot be satisfactorily fitted along a chronological sequence, suggesting complex evolutionary scenarios with the coexistence and/or survival of different lineages in Eurasia. Hexian could represent the persistence in time of a H. erectus group that would have retained primitive features that were lost in other Asian populations such as Zhoukoudian or Panxian Dadong. Our study expands the metrical and morphological variations known for the East Asian hominins before the mid-Middle Pleistocene and warns about the possibility that the Asian hominin variability may have been taxonomically oversimplified.
Mandibular and dental features indicate that the Hexian mandible and teeth differ from northern Chinese H. erectus and European Middle Pleistocene hominins, but show some affinities with the Early Pleistocene specimens from Africa (Homo ergaster) and Java (H. erectus), as well as the Middle-Late Pleistocene mandible from Penghu, Taiwan. Compared to contemporaneous continental Asian hominin populations, the Hexian fossils may represent the survival of a primitive hominin, with more primitive morphologies than other contemporaneous or some chronologically older Asian hominin specimens.
Our dental study reveals a mosaic of primitive and derived dental features for the Xujiayao hominins that can be summarized as follows: i) they are different from archaic and recent modern humans, ii) they present some features that are common but not exclusive to the Neanderthal lineage, and iii) they retain some primitive conformations classically found in East Asian Early and Middle Pleistocene hominins despite their young geological age.
Middle to Late Pleistocene human evolution in East Asia has remained controversial regarding the extent of morphological continuity through archaic humans and to modern humans. Newly found ∼300,000-y-old human remains from Hualongdong (HLD), China, including a largely complete skull (HLD 6), share East Asian Middle Pleistocene (MPl) human traits of a low vault with a frontal keel (but no parietal sagittal keel or angular torus), a low and wide nasal aperture, a pronounced supraorbital torus (especially medially), a nonlevel nasal floor, and small or absent third molars. It lacks a malar incisure but has a large superior medial pterygoid tubercle. HLD 6 also exhibits a relatively flat superior face, a more vertical mandibular symphysis, a pronounced mental trigone, and simple occlusal morphology, foreshadowing modern human morphology. The HLD human fossils thus variably resemble other later MPl East Asian remains, but add to the overall variation in the sample. Their configurations, with those of other Middle and early Late Pleistocene East Asian remains, support archaic human regional continuity and provide a background to the subsequent archaic-to-modern human transition in the region.
The HLD human sample, primarily the HLD 6 skull but includingthe isolated cranial, dental, and femoral remains, provides a suiteof morphological features that place it comfortably within the pre-viously known Middle to early Late Pleistocene East Asian humanvariation and trends. These Middle-to-Late Pleistocene archaichuman remains from East Asia can be grouped into four chro-nological groups, from the earlier Lantian–Chenjiawo, Yunxian,and Zhoukoudian; to Hexian and Nanjing; then Chaoxian, Dali,HLD, Jinniushan, and Panxian Dadong; and ending with Changyang,Xuchang, and Xujiayao. They are followed in the early LatePleistocene by Huanglong, Luna, Fuyan, and Zhiren, which to-gether combine archaic and modern features.
There is nonetheless substantial variation across the availableEast Asian sample within and across these chronological groupsand especially in terms of individual traits and their combinationswithin specimens (SI Appendix, Figs. S16 and S17 and Tables S10,S12, and S13). However, similar variation within regions andwithin site samples is evident elsewhere during the MPl (as reflectedin the persistent absence of taxonomic consensus regarding MPlhumans; see refs. 19, 23, 41, and 42), and it need not imply morethan normal variation among these fluctuating forager populations.The growing human fossil sample from mainland East Asia,enhanced by the HLD remains, therefore provides evidence ofcontinuity through later archaic humans, albeit with some degreeof variation within chronological groups. As such, the samplefollows the same pattern as the accumulating fossil evidence forMPl (variably into the Late Pleistocene) morphological conti-nuity within regional archaic human groups in Europe (e.g., ref.43), Northwest Africa (e.g., ref. 44), and insular Southeast Asia(e.g., refs. 21 and 24), as well as into early modern humans inEast Africa (e.g., ref. 45). Several divergent peripheral samples[Denisova, Dinaledi, and Liang Bua (46–48)] do not follow thispattern, but they are best seen as interesting human evolutionaryexperiments (49) and not representative of Middle to Late Pleisto-cene human evolution. It is the core continental regions that providethe overall pattern of human evolution during this time period andform the background for the emergence of modern humans.Although there is considerable interregional diversity across theseOld World subcontinental samples, primarily in details of craniofa-cial morphology, these fossil samples exhibit similar trends in primarybiological aspects (e.g., encephalization, craniofacial gracilization).Moreover, all of these regional groups of Middle to Late Pleistocenehuman remains reinforce that the dominant pattern through archaichumans [and variably into early modern humans through continuityor admixture (16, 50, 51)] was one of regional population consistencycombined with global chronological trends.
Fuerle has recently attempted to build a case for the existence
of multiple biological species of humans from a molecular perspective.
Fuerle used comparative genetic distance data involving various
DNA types obtained from a variety of sources for a range of
biological species and subspecies [54]. The results of his review
are summarized in the following table. Additional data involving
non-mtDNA based estimates of the genetic distance between the
gorilla species and the chimpanzees and bonobos have been included
for comparison.
Table 4 would seem to suggest that the Sub-Saharan African
(Bantu) and Australopapuan (Aborigine) genetic difference as measured
by SNP’s is greater than the genetic distance between both
the two species of gorilla (Gorilla gorilla and Gorilla beringei), and
greater than the distance between the common chimpanzee and
the bonobo as measured by mtDNA.
On the basis of this Fuerle suggests that there are only two
consistent courses of action to take regarding re-classification –
splitting or lumping. Either H. sapiens could be split into two species
– Homo africanus which would encompass modern African
populations and Homo eurasianensis which would encompass Eurasian
populations; making the genus Homo consistent in his view,
species-wise with respect to other genera in which the differences
between species are expressed in terms of much smaller genetic
distances; or alternatively the genetic variability within the human
species could be used to typologically define the absolute limits of
what constitutes a vertebrate species, which could then be employed
as a taxonomic baseline in the classification of other species.
This would mean lumping the two gorilla species and the
chimpanzee and the bonobo as single species.
FST reflects the relative amount of total genetic differentiation
between populations, however different measures of genetic distance
involving mtDNA and autosomal loci are simply inappropriate for the purposes of inter-specific comparison as the different
genes involved will have been subject to markedly different selection
pressures and are therefore not likely to have diverged at the
same time [62]. To illustrate this point, this author listed alternative
estimates of the distance between the gorilla species and the
common chimpanzee and bonobo, based on various nuclear loci
and autosomal DNA. The much higher numbers reflect the extreme
variation that can be expected when different genes are considered.
Fuerle’s presentation of the data is also problematic for another
reason, namely he makes no mention of the current
debates surrounding gorilla and chimpanzee/bonobo taxonomy;
as new research on these taxa regularly generates novel and in
some cases wildly variable estimates of genetic distance between
these primates, and there is even some debate over whether the
eastern and western gorillas are separate species [60].
Curnoe and Thorne have estimated that periods of around two
million years were required for the production of sufficient genetic
distances to represent speciation within the human ancestral lineage
[56]. This indicates that the genetic distances between the
races are too small to warrant differentiation at the level of biological
species, as the evolution of racial variation within H. sapiens
started to occur only 60,000 years ago, when the ancestors of modern
humans first left Africa.
How Things Change: Perspectives on Intelligence in Antiquity
1300 words
The cold winter theory (CWT) is a theory that purports to explain why those whose ancestors evolved in colder climes are more “intelligent” than those whose ancestors evolved in warmer climes. Popularized by Rushton (1997), Lynn (2006), and Kanazawa (2012), the theory—supposedly—accounts for the “haves” and the “have not” in regard to intelligence. However, the theory is a just-so story, that is, it explains what it purports to explain without generating previously unknown facts not used in the construction of the theory. PumpkinPerson is irritated by people who do not believe the just-so story of the CWT writing (citing the same old “challenges” as Lynn which were dispatched by McGreal):
The cold winter theory is extremely important to HBD. In fact I don’t even understand how one can believe in racially genetic differences in IQ without also believing that cold winters select for higher intelligence because of the survival challenges of keeping warm, building shelter, and hunting large game.
The CWT is “extremely important to HBD“, as PP claims, since there needs to be an evolutionary basis for population differences in “intelligence” (IQ). Without the just-so story, the claim that racial differences in “intelligence” are “genetically” based crumbles.
Well, here is the biggest “challenge” (all other refutations of it aside) to the CWT. Notions of which population are or are not “intelligent” change with the times. The best example is what the Greeks—specifically Aristotle—wrote about the intelligence of those who lived in the north. Maurizio Meloni, in his 2019 book Impressionable Biologies: From the Archaeology of Plasticity to the Sociology of Epigenetics captures this point (pg 41-42; emphasis his):
Aristotle’s Politics is a compendium of all these ideas [Orientals being seen as “softer, more delicate and unwarlike” along with the structure of militaries], with people living in temperate (mediocriter) places presented as the most capable of producing the best political systems:
“The nations inhabiting the cold places and those of Europe are full of spirit but somewhat deficient in intelligence and skill, so that they continue comparatively free, but lacking in political organization and the capacity to rule their neighbors. The peoples of Asia on the other hand are intelligent and skillful in temperament, but lack spirit, so that they are in continuous subjection and slavery. But the Greek race participates in both characters, just as it occupies the middle position geographically, for it is both spirited and intelligent; hence it continues to be free and to have very good political institutions, and to be capable of ruling all mankind if it attains constitutional unity.” (Pol. 1327b23-33, my italics)
Views of direct environmental influence and the porosity of bodies to these effects also entered the military machines of ancient empires, like that of the Romans. Offices such as Vegetius (De re militari, I/2) suggested avoiding recruiting troops from cold climates as they had too much blood and, hence, inadequate intelligence. Instead, he argued, troops from temperate climates be recruited, as they possess the right amount of blood, ensuring their fitness for camp discipline (Irby, 2016). Delicate and effemenizing land was also to be abandoned as soon as possible, according Manilius and Caesar (ibid). Probably the most famous geopolitical dictum of antiquity reflects exactly this plastic power of places: “soft lands breed soft men”, according to the claim that Herodotus attributed to Cyrus.
Isn’t that weird, how things change? Quite obviously, which population is or is not “intelligent” is based on the time and place of the observation. Those in northern Europe, who are purported to be more intelligent than those who live in temperate, hotter climes—back in antiquity—were seen to be less intelligent in comparison to those who lived in more temperate, hotter climes. Imagine stating what Aristotle said thousands of years ago in the present day—those who push the CWT just-so story would look at you like you’re crazy because, supposedly, those who live in and evolved in colder climes had to plan ahead and faced a tougher environment in comparison to those who lived closer to the equator.
Imagine we could transport Aristotle to the present day. What would he say about our perspectives on which population is or is not intelligent? Surely he would think it ridiculous that the Greeks today are less “intelligent” than those from northern Europe. But that only speaks to how things change and how people’s perspectives on things change with the times and who is or is not a dominant group. Now imagine that we can transport someone (preferably an “IQ” researcher) to antiquity when the Greeks were at the height of their power. They would then create a just-so story to justify their observations about the intelligence of populations based on their evolutionary history.
Anatoly Karlin cites Galton, who claims that ancient Greek IQ was 125, while Karlin himself claims IQ 90. I cite Karlin’s article not to contest his “IQ estimates”—nor Galton’s—I cite it to show the disparate “estimates” of the intelligence of the ancient Greeks. Because, according to the Greeks, they occupied the middle position geographically, and so they were both spirited and intelligent compared to Asians and northern Europeans.
This is similar to Wicherts, Boorsboom, and Dolan (2010) who responded to Rushton, Lynn, and Templer. They state that the socio-cultural achievements of Mesopotamia and Egypt stand in “stark contrast to the current low level of national IQ of peoples of Iraq and Egypt and that these ancient achievements appear to contradict evolutionary accounts of differences in national IQ.“ One can make a similar observation about the Maya. Their cultural achievements stand in stark contrast to their “evolutionary history” in warm climes. The Maya were geographically isolated from other populations and they still created a writing system (independently) along with other cultural achievements that show that “national IQs” are irrelevant to what the population achieved. I’m sure an IQ-ist can create a just-so story to explain this away, but that’s not the point.
Going back to what Karlin and Galton stated about Greek IQ, their IQ is irrelevant to their achievements. Whether or not their IQ was 120-125 or 90 is irrelevant to what they achieved. To the Mesopotamians and Egyptians, they were more intelligent than those from northern climes. They would, obviously, think that based on their achievements and the lack of achievements in the north. The achievements of peoples in antiquity would paint a whole different picture in regard to an evolutionary theory of human intelligence—and its distribution in human populations.
So which just-so story (ad hoc hypothesis) should we accept? Or should we just accept that which population is or is not “intelligent” and capable of constructing militaries is contingent based on the time and the place of the observation? Looking at “national IQs” of peoples in antiquity would show a huge difference in comparison to what we observe today about the “national IQs” (supposedly ‘intelligence’) of populations around the world. In antiquity, those who lived in temperate and even hotter climes had greater achievements than others. Greeks and Romans argued that peoples from northern climes should not be enlisted in the military due to where they were from.
These observations from the Greeks and Romans about who and who not to enlist in the military, along with their thoughts on Northern Europeans prove that perspectives on which population is or is not “intelligent” is contingent based on the time and place. This is why “national IQs” should not be accepted, not even accounting for the problems with the data (Richardson, 2004; also see Morse, 2008; also see The Ethics of Development: An Introduction by Ingram and Derdak, 2018). Seeing the development of countries/populations in antiquity would lead to a whole different evolutionary theory of the intelligence of populations, proving the contingency of the observations.
Race/Ethnic Differences in Dentition
1300 words
Different groups of people eat different things. Different groups of people also differ genetically. What one eats is part of their environment. So, there is a G and E (genes and environment) interaction between races/ethnies in regard to the shape of their teeth. Yes, one can have a different shape to their teeth, on average, compared to their co-ethnics if they eat different things from them as that is one thing that shapes the development of teeth.
It is very difficult to ascertain the race of an individual through their dentition, but there are certain dental characters which can lead to the identification of race. Rawlani et al (2017) show that there are differences in the dentition of Caucasians, Negroids, Mongoloids and Australoids.
One distinct difference that Monogloid teeth have is having a “shovel” or “scoop” appearance. They also have larger incisors than Caucasoids, while having shorter anatomic roots with better-developed trunks. Caucasoids had a “v” shape to their teeth, while their anterior teeth were “chisel shaped”; 37 percent of Caucasoids had a cusp on the carabelli cusp. Rawlani et al (2017) also note that one study found that 94 percent of Anglo-Saxons had four cusps compared to five for other races. Australoids had a larger arch size (but relatively smaller anterior teeth), which accommodates larger teeth. They have the biggest molars of any race; the mesiodistal diameter of the first molar is 10 percent larger than white Americans and Norweigian Lapps. Negroids had smaller teeth with more spacing, they are also less likely to have the Carabelli cusp and shovel incisors. They are more likely to have class III malocclusion (imperfect positioning of the teeth when the jaw is closed) and open bite. Blacks are more likely to have bimaxillary protrusion, though Asians do get orthodontic surgery for it (Yong-Ming et al, 2009).
Rawlani et al’s (2017) review show that there are morphologic differences in teeth between racial groups that can be used for identification.
When it comes to the emergence of teeth, American Indians (specifically Northern Plains Indians) had an earlier emergence of teeth compared to whites and blacks. American Indian children had a higher rate of dental caries, and so, since their teeth appear at an earlier age compared to whites and blacks, they had more of a chance for their teeth to be exposed to diets high in sugar and processed foods along with lack of oral hygiene (Warren et al, 2016).
Older blacks had more decayed teeth than whites in one study (Hybels et al, 2016). Furthermore, older blacks were more likely than older whites to self-report worse oral hygeine; blacks had a lower number of teeth than whites in this study—which was replicated in other studies—though differences in number of teeth may come down to differences in access to dental care along with dental visits (Huang and Park, 2016). One study even showed that there was unconscious racial bias in regard to root canal treatments: whites were more likely to get root canals (i.e., they showed a bias in decision-making favoring whites), whereas blacks were more likely to get the tooth pulled (Patel et al, 2018).
Kressin et al (2003) also show that blacks are less likely to receive root canals than whites, while Asians were more likely, which lends further credence to the claim of unconscious racial bias. So just like unconscious bias affects patients in regard to other kinds of medical treatment, the same is true for other doctors such as dentists: they have a racial bias which then affects the care they give their patients. Gilbert, Shewchuk, and Litaker (2006) also show that blacks are more likely to have tooth extractions when compared to other races, but people who went to a practice that had a higher percentage of black Americans were more likely to have a tooth extraction, regardless of the individual’s race. This says to me that, since there is unconscious bias in tooth extraction (root canals), that the more black patients a dentist sees the more it is likely that they would extract the tooth of the patient (regardless of race), since they would do that more often than not due to the number of patients they see that are black Americans.
Otuyemi and Noar (1996) showed that Nigerian children had larger mesio-distal crown diameters compared to Briton children. American blacks are more likely to have hyperdontia (extra teeth in the mouth) compared to whites, and are also more likely to have fourth molars and extra premolars (Harris and Clark, 2008). Blacks have slightly larger teeth than whites (Parciak, 2015).
Dung et al (2019) also note ethnic differences in teeth looking at four ethnic groups in Vietnam:
Our study of 4565 Vietnamese children of four ethnic groups (Kinh, Tay, Thai and Muong) showed that most dental arch indicators in males were statistically significantly higher than those in females.
[…]
In comparison to other ethnic groups, 12-year-old Vietnamese children had similar dimensions of the upper and lower intercanine and intermolar width to children in the same age group in South China. However, the average upper posterior length 1 and lower posterior length 1 were shorter than those in Africans (Kenyan) and Caucasian (American blacks aged 12). The 12-year-old Vietnamese have a narrower and shorter dental arch than Caucasian children, especially the maxillary, and they need earlier orthodontic intervention.
The size of the mandible reflects the type of energy ingested: decreases “in masticatory stress among agriculturalists causes the mandible to grow and develop differently” (Cramon-Taubadel, 2011). This effect would not only be seen in an evolutionary context. Cramon-Taubadel (2011) writes:
The results demonstrate that global patterns of human mandibular shape reflect differences in subsistence economy rather than neutral population history. This suggests that as human populations transitioned from a hunter-gatherer lifestyle to an agricultural one, mandibular shape changed accordingly, effectively erasing the signal of genetic relationships among populations.
So it seems like the change from a hunter-gatherer lifestyle to one based on plant/animal domestication had a significant effect on the mandible—and therefore teeth—of a population.
So teeth are a bone, and bones adapt. When an individual is young, the way their teeth, and subsequently jaw, are can be altered by diet. Eating hard or soft foods during adolescence can radically change the shape of the teeth (Liebermann, 2013). The harder the stuff one has to chew on will alter their facial morphology (i.e., their jaw and cheekbones) and, in turn, their teeth. This is because the teeth are bones and any stress put on them will change them. This, of course, speaks to the interaction of G and E (genes and environment). There are genes that contribute to differences in dental morphology between populations, and they impact the difference between ethnic/racial groups.
Further making the differences between these groups is what they choose to eat: the hardness or softness of the food they eat in adolescence and childhood can and will dictate the strength of one’s jaw and shape and strength of their teeth in adulthood, though racial/ethnic identification would still be possible.
Racial differences in dentition come down to evolution (development) and what and how much of the population in question eats. The differences in dentition between these populations are, in a way, dictated by what they eat in the beginning years of life. This critical period may dictate whether or not one has a strong or weak jaw. These differences come down to, like everything else, an interaction between G and E (genes and environment), such as the food one eats as an adolescent/baby which would then affect the formation of teeth in that individual. Of course, in countries that have a super-majority of one ethnic group over another, we can see what diet does to an individual in an ethnic group’s teeth.
There are quite striking differences in dentition between races/ethnic groups, and this can and will (along with other variables) lead to correctly identifying the race of an individual in question.
Black-White Differences in Bone Density
1100 words
I have written a few response articles to some of what Thompson has written over the past few years. He is most ridiculous when he begins to talk about nutrition (see my response to one of his articles on diet: Is Diet An IQ Test?). Now, in a review of Angela Saini’s (2019) new book Superior: The Return of Race Science, titled Superior Ideology, Thompson, yet again, makes more ridiculous assertions—this time about bone density as an adaptation. (I don’t care about what he says about race; though I should note that the debate will be settled with philosophy, not biology. Nor do I care about whatever else he says, I’m only concerned with his awful take on anatomy and physiology.)
The intellectually curious would ask: are there other adaptations which are not superficial? How about bone density?
https://academic.oup.com/jcem/article/82/2/429/2823249
https://www.ncbi.nlm.nih.gov/pmc/articles/PMC1863580/
Just-so story incoming.
I’m very familiar with these two papers. Let’s look at them both in turn.
The first study is Racial Differences in Bone Density between Young Adult Black and White Subjects Persist after Adjustment for Anthropometric, Lifestyle, and Biochemical Differences (Ettinger et al, 1997). Now, I did reference this article in my own piece on racial differences in drowning, though only to drive home the point that there are racial differences in bone density. Thompson is outright using this article as “evidence” that it is an adaptation.
In any case, Ettinger et al (1997) state that greater bone density in blacks may be due to differences in calciotropic hormones—hormones that play a major role in bone growth and bone remodeling. When compared with whites “black persons have lower urinary calcium excretion, higher 1,25-dihydroxyvitamin D (1, 25D) level, and lower 25-hydroxyvitamin D (25D) and osteocalcin level (9)” (Ettinger et al, 1997). They also state that bone density can be affected by calcium intake, physical activity, They also state that testosterone (an androgen) may account for racial and gender differences in bone density, writing “Two studies have demonstrated statistically significantly higher serum testosterone level in young adult black men (22) and women (23).”
Oh, wow. What are refs [22] and [23]? [22] is one of my favorites—Ross et al (1986) (read my response). To be brief, the main problems with Ross et al is that assay times were all over the place, along with it being a small convenience sample of 50 blacks and 50 whites. LabTests Online writes that it is preferred to assay in the morning while in a fasted state. In Ross et al, the assay times were between 10 am and 3 pm, which was a “convenient time” for the students. Along with the fact that the sample was small, this study should not be taken seriously regarding racial differences in testosterone, and, thus, racial differences in bone density.
Now what about [23]? This is another favorite of mine—Henderson et al (1988; of which Ross was a part of). Mazur (2016) shows that black women do not have higher levels of testosterone than white women. Furthermore, this is just like Ellis’ (2017) claims that there is a difference in prenatal androgen exposure, but that claim, too, fails. In any case, testosterone can’t explain differences in bone density between races.
Ettinger et al (1997) showed that blacks had higher levels of bone density than whites in all of the sites they looked at. (Though they also used skin-fold testing, which is notoroiously bad at measuring body composition in blacks; see Vickery, Cureton, and Collins, 1988). However, Ettinger et al (1997) did not claim, nor did they imply that bone density is an adaptation.
Now, getting to the second citation, Hochberg (2007). Hochberg (2007) is a review of differences in bone mineral density (BMD) between blacks and whites. Unfortunately, there is no evidence in this paper, either, that BMD is an adaptation. Hochberg (2007) gives numerous reasons why blacks would have stronger skeletons than whites, and neither is that they are an “adaptation”:
Higher bone strength in blacks could be due to several factors including development of a stronger skeleton during childhood and adolescence, slower loss of bone during adulthood due to reduced rates of bone turnover and greater ability to replace lost bone due to better bone formation. Bell and colleagues reported that black children had higher bone mass than white children and that this difference persisted into young adulthood, at least in men (23,24). Development of a stronger skeleton during childhood and adolescence is dependent on the interaction of genetic and environmental factors, including nutrition and lifestyle factors (25).
[…]
Genetic, nutritional, lifestyle and hormonal factors may contribute to differences in rates of bone turnover during adulthood
There are numerous papers in the literature that show that blacks have higher BMD than whites and that there are racial differences in this variable. However, the papers that Thompson has cited are not evidence. That trait T exists and there is a difference in trait T between G1 and G2 does not license the claim that the difference in trait T between G1 and G2 is “genetic.”
Thompson then writes:
Equally, how about differences in glomerular function, a measure of kidney health, for which the scores are adjusted for those of Black African descent, to account for their higher muscle mass? Muscle mass and bone density are not superficial characteristics. In conflicts it would be a considerable advantage to have strong warriors, favouring “hard survival”.
Here’s the just-so story.
Race adjustment for estimating glomerular filtration rate (GFR) is not always needed (Zanocco et al, 2012). Renal function is measured by GFR. Renal function is an indication of the kidney’s functioning. Racial differences in kidney function exist, even in cases where the patients do not have CKD (chronic kidney disease) (Peralta et al, 2011). Black Americans also constitute 35 percent of all patients in America receiving kidney dialysis, despite being only 13 percent of the US population. Blacks do generate higher levels of creatinine compared to whites, and this is due to higher average muscle mass when compared with whites.
There are differences in BMD and muscle mass between blacks and whites which is established by young adulthood (Popp et al, 2017), but the claim that there trait T is an adaptation because trait T exists and there is a difference between G1 and G2 is unfounded. It’s simply a just-so story, using the old EP reverse engineering. The two papers referenced by Thompson are not evidence that the BMD is an adaptation, it only shows that there are racial differences in the trait. That there are racial differences in the two traits does not license the claim that the traits in question are an adaptation as Thompson seems to be claiming. The papers he refers to only note a difference between the two groups; it does not discuss the ultimate etiology of the difference between the groups, which Thompson does with his just-so story.
