
Home » Posts tagged 'Racial Differences' (Page 4)
Tag Archives: Racial Differences
Race and Nutrition
2600 words
What we eat is important. What we eat can increase or decrease our lifespan. But do different races digest and metabolize different macro and micronutrients differently? On a racial level in terms of individual diet, would one individual benefit from adopting the diet of their ancestors over another diet? Many claims have been made like this in the past few years, such as Europeans evolving to eat plants and grains. This, some people would presume, implies that if you have a certain ancestry then you must eat a certain diet or take different steps in regard to nutrition. I will show this is wrong and that, at least in regard to health and nutrition, individual variation matters more than racial variation (don’t call Lewontin’s fallacy on me. This is not a fallacy).
Different genetically isolated breeding populations evolved eating different diets based on what they had in their environment. Over time, humans eventually developed agriculture and then changed the course of human evolution forever (Cochran and Harpending, 2009). This then leads to large changes in how our genes are expressed and how our microbiome metabolizes nutrients and food we ingest. The advent of farming was, obviously, pivotal to human evolution (Cochran and Harpending, 2009). This then lead to heritable changes in the genome brought on by new foods the farmers ate. This also started the environmental mismatches we now have in our modern world, which is the cause for rising obesity rates and a large part of the cause of so-called diseases of civilization (for a discussion of these matters, see Taubes, 2008, chapter 5; see also page 8 in this summary of his book on diseases of civilization and also see Burkitt, 1973; Cordain, Eades, and Eades, 2003; Sharma and Majumdar, 2009; Sikter, Rihmer, and Guevara, 2017. For an outstanding review on the subject, read Daniel Lieberman’s 2013 book The Story of the Human Body: Evolution, Health, and Disease for in-depth discussions on this point and more in regard to nutrition and our evolutionary history).
Studies come out all the time saying that X population evolved eating Y food therefore Z. Then, people not privy to nutrition science, jump to large sweeping conclusions (mostly laymen and journalists, who are also laymen). These assumptions imply that people’s metabolic systems aren’t, first and foremost, based on an individual level with individual variation in physiologic and metabolic traits. This, I will show, is the reason why these studies don’t mean you should change your diet to what your ancestors supposedly ate based on these studies (though as I have argued in the past, high consumption of processed foods lead to obesity, insulin resistance, diabetes etc which is the cause of a lot of the modern-day maladies currently present in our population today). This assumption is wrong on numerous levels.
Buckley et al (2017), using data from the 1000 Genomes Project (see also Via, Gignoux, and Burchard, 2010), identified novel potential selections in the FADs region. The 1000 Genomes Project tested the genomes of 101 Bronze Age Europeans. They show that SNPs which are associated with arachidonic acid and eicosapentaenoic acid has been favored in Europeans since the Bronze Age (the selection for arachidonic acid being due to milk consumption which is a form of niche construction; see Laland, Odling-Smee, and Feldman, 1999; Laland, Odling-Smee, and Feldman, 2001; Laland and Brown, 2006; Rendell, Fogarty, and Laland, 2011; Laland, et al, 2016; but see Gupta et al, 2017 for a different view which will be covered in the future). They also hypothesize that differences in the selection of these regions is different in different population, implying different epigenetic changes brought on by diet (more on this later).
The FADS1 gene codes for an enzyme called fatty acid desaturase 1 which desaturates n3 and n6 which then catalyzes eicosapentaenoic and Arachidonic acid (Park et al, 2009). These genes code for enzymes that then aid in the breakdown of fatty acids. So, by testing Bronze Age Europeans and comparing their genomes with modern-day Europeans, researchers can see how the expression of genes changed and then work backward and hypothesize how and why the differing gene expression occurred.
The regions selected for are involved in processing n3 and n6 fatty acids. We need a certain ratio of them, and if either is thrown out of whack then deleterious effects occur. This, of course, can be seen by comparing our ratio of n3 to n6 fatty acid consumption with our ancestors’, who ate a 1:1 ratio of n3 to n6 (Kris-Etherson et al, 2000) which you can then compare to our n3 to n6 ratio, which is 14 to 25 times higher than it should be. The authors state that n6 is important, but it’s only important to have the correct ratio, having too much n6 is not a good thing (as I have covered here).
Twenty percent of the dry weight of the brain is made up of long-chain polyunsaturated fatty acids (Lassek and Gaulin, 2009). Therefore it is pivotal we get the correct amount of n3 fatty acids for brain development both in vitro and during infancy, the best bet being to breastfeed the babe as the mother packs on fat during pregnancy so the babe can have PUfAs during its time on the womb as well as during infancy through breastfeeding.
About 85kya selective sweeping occurred in Africa on the FADs genes. Buckley et al (2017) write: “Humans migrating out of Africa putatively carried mostly the ancestral haplotype, which remained in high frequency in non-African populations, while the derived haplotype came close to fixation in Africa. It is unclear why positive selection for the derived haplotype appears to be restricted to Africa. Mathias et al. (2012) suggested that the emergence of regular hunting of large animals, dated to ∼50 kya, might have diminished the pressure for humans to endogenously synthesize LC-PUFAs.” This is true. There is a wealth of important fatty acids in the fatty and muscle tissue of animals, which we need for proper brain functioning and development.
They also write about a study on the Inuit that proves that certain alleles have been selected for that have to do with fatty acid metabolism, which I have also covered in the past in a response to Steve Sailer. Nevertheless, on a population level, this is worth it, but individual variation in metabolism matters more than population. In the article, Sailer implied—with a quote from New York Times science editor Carl Zimmer—that the Inuit have certain gene variants that influence fatty acid metabolism in that population. Sailer goes on to write “So maybe you should try different diets and see if one works better for you.” Of course, you should. However individual variation is more important than racial variation. (It’s also interesting to note that these genes that are expressed on the Inuit are also related to height.)
Nevertheless, it is true that selection occurred on these parts of the genome in these populations studied by Buckley et al (2017), but to claim that all populations wouldn’t benefit from a low carb, high fat diet is not true. I do agree with Sailer on, in the future, the scanning of individual genomes to see which diet would have a better effect. Though I would insist that most, if not all, humans should eat a higher fat lower carb diet.
Buckley et al (2017) cite a study (Mathieson et al, 2015) which “provides strong evidence of selection in the FADSregion in Europe over the past 4,000 years, in addition to the patterns of selection already reported in Africans, South Asians, and the Inuit.” Buckley et al (2017) also cite a study (Pan et al, 2017) which shows an SNP, rs174557, regulates FADS1.
In their analysis, they showed that “this variation is largely attributable to high differentiation between two haplotype clusters: a cluster widespread in Africa, largely containing derived alleles and possibly subject to a selective sweep (Mathias et al. 2011,, 2012), and an ancestral cluster, which is present across Eurasia.” They also showed that Neanderthal genomes cluster with the derived cluster, which is present in Africans, while Denisovans cluster with the ancestral cluster, which Eurasians also have.
Buckley et al (2017) write: “Thus the derived alleles appear to promote expression of FADS1 while simultaneously abating the expression of FADS2.” This is important to keep in mind for the end of this article when I talk about nutrition and how it affects the epigenome which can then become heritable in a certain population.
Buckley et al (2017) also confirm the results of the European sample using the Nurses Health Study and the Health Professionals follow-up study GWASs: “These results reinforce the associations with cholesterol from the GLGC GWAS. This confirms the hypothesized phenotypic effect of the selected variants in terms of increased EPA and ARA levels of the putatively positively selected variants in the European population.”
Selective (dietary) pressures on the three populations tested (Africans, Europeans and South Asians) have “have driven allele frequency changes in different FADS SNPs that are only in weak LD with each other [LD is linkage disequilibrium which is the nonrandom associations of alleles at different loci in a given population]” (Buckley et al, 2017). Further, the alleles (FADS1 and FADS2) that were under selection in Europeans were strongly associated with lipid metabolism, specifically reduced linoleic acid levels. An opposite pattern was noticed in the Inuit, where selection acted to “decrease conversion of SC-PUFAs to LC-PUFAs to compensate for the relative high dietary intake of LC-PUFAs.” The allele under selection was associated with a decrease in linoleic acid levels and an increase in eicosapentaenoic acid, which may possibly be due to improved metabolism in converting LC-PUFAs from SC-PUFAs.
Buckley et al (2017) hypothesize that the cause is eating a more plant-based diet which is rich in fatty acids (n6 and n3) while a subsequent decrease in fatty animal meats occurred. Of course, relative to hunter-gatherer populations, the increased plant consumption brought on by agriculture caused different methylation on the genome which then eventually became part of the heritable variation. So, of course, farmers would have eaten more plants and the like, which one then select for the production of SC-PUFAs to LC-PUFAs. This of course began at the dawn of agriculture (Cochran and Harpending, 2009).
Of course, this can help guide individual diets as we better map the human genome. These studies, for instance, can be used as guides for individual diets based on ancestral evolution. More studies, of course, are needed.
Also, in an email with correspondence with Arstechnica, one of the authors, Nelson Rasmussen, stated: “Of course, within the last century there have been drastic changes in the diets in many areas of Europe. Diets have typically become more caloric with a higher intake of simple sugars, and perhaps also more rich in proteins and fat from animals. So selection is unlikely to be working in exactly the same way now.”
Though the strong claim from Arstechnica that “This is another nail in the coffin for the scientific validity of paleo diets” is a strong claim which needs much more evidence because low carb high-fat diets are mostly best for people since their insulin levels aren’t spiked too much which then leads to obesity, diabetes and along with it hyperinsulinemia.
Now I need to talk about how epigenetics is involved here. Nutrition can alter the genome and epigenome (Niculescu and Lupu, 2011; Niculescu, 2012; Anderson, Sant, and Dolinoy, 2012) and cause permanent heritable variation in a population if a certain allele reaches fixation, since there is evidence that maternal and paternal dietary changes possibly affecting multiple generations (Rosenfeld, 2017; though see Burggren, 2016 for the view that there is no evidence for heritable epigenetic phenotype in the genome. I will return to this in the future; see also the Dutch Famine Study showing heritable epigenetic change from famine; Lumey et al, 1993; Heijmans, 2008; Stein et al, 2009; Tobi et al, 2009; Schulz, 2010; Lumey, Stein, and Susser, 2011; Hajj et al, 2014; Jang and Serra, 2014; Tobi et al, 2014). Of course, based on what a population eats (or does not eat), epigenetic changes can and will occur. This not only affects the expression of genes in the body, but also the trillions of gut microbiota in our microbiome that partly drive our metabolic functions. Diet can change the composition of the microbiome, diet can change the epigenome and gene expression, and the microbiome can also up- and down-regulate genes (Hullar and Fu, 2014) Lipid metabolism is also related to developmental epigenetic programming (Marchlewicz et al, 2016). They showed that circulating fatty lipids in the mother during pregnancy are associated with DNA methylation in the genomes of the child. This can also, of course, contribute to health and disease risk in the future for the affected infant. FADS1 is also involved here.
Nutritional factors also come into play in regards to epigenetic inheritance (Alam et al, 2015). The n3 PUFAs also affect gene expression and DNA methylation (Hussey, Lindley, and Mastana, 2017). Further, DNA methylation is also associated with FADS1 and, to a lesser extent, FADS2 (Howard et al, 2014). This is strong evidence that, of course, that what was reviewed above in regards to selection for certain alleles for fatty acid metabolism in certain populations was strongly driven by the consumption of certain foods. Epigenetic changes that occur both in the womb and previous generations like the grandparents’, for instance, also have an effect in regard to which genes are expressed in the baby in vitro as well as consequences for future generations. The study of epigenetics, along with transgenerational epigenetic inheritance, of course, will be very important for our future understanding of both the evolution of humans and the evolution of the human diet.
Finally, I need to touch on why this doesn’t really matter in terms of individual diet choice. The fact of the matter is, anatomic, physiologic, and metabolic variation within race trumps variation between it. Two different randomly selected individuals will have different anatomy, along with different organs missing (Saladin, 2010). This implies that the individual differences in these traits trump whatever racial selection occurred since the dawn of agriculture 10kya. This is why, in my opinion, one should not look to just their ancestry when choosing a diet and should always choose a diet based that’s good for them, individually. Now, I’m not saying that this research is useless in regards to healthy diets, however, increased consumption of processed foods is the cause of obesity since processed foods (high in carbs) spike insulin which lead to obesity and diabetes (insulin causes weight gain). So, obviously, full-on plant-based diets will lead to these maladies. Contrary to the Alternative Hypothesis’ thesis on race and nutrition, this doesn’t really matter, not at the individual level, anyway. This could have small implications in regard to the population as a whole, but as an effect on the diet of individuals? No. Individual variation in traits matters much more than racial variation here (again, don’t call Lewontin’s fallacy because I’ve explained my reasoning which is logically sound).
In sum, the SNPs associated with the increased expression of FADs1 and increased the production of eicosapentaenoic and Arachidonic acid in Europeans occurred around 5kya. These studies are interesting to see how diet and how we construct our niches leads to changes in the genome based on those changes that we enact ourselves. However, laypersons who read these popular science articles on the evolution of diet in human populations will then assume that since they have X ancestry then they must eat how their immediate ancestors ate. The Arstechnica article makes some strong claims that Buckley et al (2017) prove that the paleo diet is not a viable solution for diseases of civilization. Do not make sweeping claims about eating X and Y because your ancestors evolved in Z environment, because individual variation in metabolic and physiologic functioning is greater and matters way more than racial variation
[Note: Diet changes under Doctor’s supervision only.]
Black-White Differences in Physiology
2050 words
Black-white differences in physiology can tell a lot about how the two groups have evolved over time. On traits like resting metabolic rate (RMR), basal metabolic rate (BMR), adiposity, heart rate, Vo2 max, etc. These differences in physiological variables between groups, then, explain part of the reason why there are different outcomes in terms of life quality/mortality between the two groups.
Right away, by looking at the average black and average white, you can see that there are differences in somatype. So if there are differences in somatype, then there must be differences in physiological variables, and so, this may be a part of the cause of, say, differing obesity rates between black and white women (Albu et al, 1997) and even PCOS (Wang and Alvero, 2013).
Resting metabolic rate
Resting metabolic rate is your body’s metabolism at rest, and is the largest component of the daily energy budget in modern human societies (Speakman and Selman, 2003). So if two groups, on average, differ in RMR, then one with the lower RMR may have a higher risk of obesity than the group with the higher RMR. And this is what we see.
Black women do, without a shadow of a doubt, have a lower BMR, lower PAEE (physical activity energy expenditure) and TDEE (total daily expenditure) (Gannon, DiPietro, and Poehlman, 2000). Knowing this, then it is not surprising to learn that black women are also the most obese demographic in the United States. This could partly explain why black women have such a hard time losing weight. Metabolic differences between ethnic groups in America—despite living in similar environments—show that a genetic component is responsible for this.
There are even predictors of obesity in post-menopausal black and white women (Nicklas et al, 1999). They controlled for age, body weight and body composition (variables that would influence the results—no one tell me that “They shouldn’t have controlled for those because it’s a racial confound!”) and found that despite having a similar waist-to-hip ratio (WHR) and subcutaneous fat area, black women had lower visceral fat than white women, while fasting glucose, insulin levels, and resting blood pressure did not differ between the groups. White women also had a higher Vo2 max, which remained when lean mass was controlled for. White women could also oxidize fat at a higher rate than black women (15.4 g/day, which is 17% higher than black women). When this is expressed as percent of total kcal burned in a resting state, white women burned more fat than black women (50% vs 43%). I will cover the cause for this later in the article (one physiologic variable is a large cause of these differences).
We even see this in black American men with more African ancestry—they’re less likely to be obese (Klimentidis et al 2016). This, too, goes back to metabolic rate. Black American men have lower levels of body fat than white men (Vickery et al, 1988; Wagner and Heyward, 2000). All in all, there are specific genetic variants and physiologic effects, which cause West African men to have lower central (abdominal) adiposity than European men and black women who live in the same environment as black men—implying that genetic and physiologic differences between the sexes are the cause for this disparity. Whatever the case may be, it’s interesting and more studies need to be taken out so we can see how whatever gene variants are *identified* as protecting against central adiposity work in concert with the system to produce the protective effect. Black American men have lower body fat, therefore they would have, in theory, a higher metabolic rate and be less likely to be obese—while black women have the reverse compared to white women—a lower metabolic rate.
Skeletal muscle fiber
Skeletal muscle fibers are the how and why of black domination in explosive sports. This is something I’ve covered in depth. Type II fibers contract faster than type I. This has important implications for certain diseases that black men are more susceptible to. Though the continuous contraction of the fibers during physical activity leads to a higher disease susceptibility in black men—but not white men (Tanner et al, 2001). If you’re aware of fiber type differences between the races (Ama et al, 1986; Entine, 2000; Caeser and Henry, 2015); though see Kerr (2010’s) article The Myth of Racial Superiority in Sports for another view. That will be covered here in the future.
Nevertheless, fiber typing explains racial differences in sports, with somatype being another important variable in explaining racial disparities in sports. Two main variables that work in concert are the somatype (pretty much body measurements, length) and the fiber type. This explains why blacks dominate baseball and football; this explains why ‘white men can’t jump and black men can’t swim’. Physiological variables—not only ‘motivation’ or whatever else people who deny these innate differences say—largely explain why there are huge disparities in these sports. Physiology is important to our understanding of how and why certain groups dominate certain sports.
This is further compounded by differing African ethnies excelling in different running sports depending on where their ancestors evolved. Kenyans have an abundance of type I fibers whereas West Africans have an abundance of type II fibers. (Genetically speaking, ‘Jamaicans’ don’t exist; genetic testing shows them to come from a few different West African countries.) Lower body symmetry—knees and ankles—show that they’re more symmetrical than age-matched controls (Trivers et al, 2014). This also goes to show that you can’t teach speed (Lombardo and Deander, 2014). Though, of course, training and the will to want to do your best matter as well—you just cannot excel in these competitions without first and foremost having the right physiologic and genetic make-up.
Further, although it’s only one gene variant, ACTN3 and ACE explain a substantial percentage of sprint time variance, which could be the difference between breaking a world record and making a final (Papadimitriou et al, 2016). So, clearly, certain genetic variants matter more than others—and the two best studied are ACTN3 and ACE. Some authors, though, may deny the contribution of ACTN3 to elite athletic performance—like one researcher who has written numerous papers on ACTN3, Daniel MacArthur. However, elite sprinters are more likely to carry the RR ACTN3 genotype compared to the XX ACTN3 genotype, and the RR ACTN3 genotype—when combined with type II fibers and morphology—lead to increased athletic performance (Broos et al, 2016). It’s also worth noting that 2 percent of Jamaicans carry the XX ACTN3 genotype (Scott et al, 2010), so this is another well-studied variable that lends to superior running performance in Jamaicans.
In regards to Kenyans, of course when you are talking about genetic reasons for performance, some people don’t like it. Some may say that certain countries dominate in X, and that for instance, North Africa is starting to churn out elite athletes, should we begin looking for genetic advantages that they possess (Hamilton, 2000)? Though people like Hamilton are a minority view in this field, I have read a few papers that there is no evidence that Kenyans possess a pulmonary system that infers a physiologic advantage over whites (Larsen and Sheel, 2015).
People like these three authors, however, are in the minority here and there is a robust amount of research that attests to East African running dominance being genetic/physiologic in nature—though you can’t discredit SES and other motivating variables (Tucker, Onywera, and Santos-Concejero, 2015). Of course, a complex interaction between SES, genes, and environment are the cause of the success of the Kalenjin people of Kenya, because they live and train in such high altitudes (Larsen, 2003), though the venerable Bengt Saltin states that the higher Vo2 max in Kenyan boys is due to higher physical activity during childhood (Saltin et al, 1995).
Blood pressure
The last variable I will focus on (I will cover more in the future) is blood pressure. It’s well known that blacks have higher blood pressure than whites—with black women having a higher BP than all groups—which then leads to other health implications. Some reasons for the cause are high sodium intake in blacks (Jones and Hall, 2006); salt (Lackland, 2014; blacks had a similar sensitivity than whites, but had a higher blood pressure increase); while race and ethnicity was a single independent predictor of hypertension (Holmes et al, 2013). Put simply, when it comes to BP, ethnicity matters (Lane and Lip, 2001).
While genetic factors are important in showing how and why certain ethnies have higher BP than others, social factors are arguably more important (Williams, 1992). He cites stress, socioecologic stress, social support, coping patterns, health behavior, sodium, calcium, and potassium consumption, alcohol consumption, and obesity. SES factors, of course, lead to higher rates of obesity (Sobal and Stunkard, 1989; Franklin et al, 2015). So, of course, environmental/social factors have an effect on BP—no matter if the discrimination or whatnot is imagined by the one who is supposedly discriminated against, this still causes physiologic changes in the body which then lead to higher rates of BP in certain populations.
Poverty does affect a whole slew of variables, but what I’m worried about here is its effect on blood pressure. People who are in poverty can only afford certain foods, which would then cause certain physiologic variables to increase, exacerbating the problem (Gupta, de Wit, and McKeown, 2007). Whereas diets high in protein predicted lower BP in adults (Beundia et al, 2015). So this is good evidence that the diets of blacks in America do increase BP, since they eat high amounts of salt, low protein and high carb diets.
Still, others argue that differences in BP between blacks and whites may not be explained by ancestry, but by differences in education, rather than genetic factors (Non, Gravlee, and Mulligan, 2012). Their study suggests that educating black Americans on the dangers and preventative measures of high BP will reduce BP disparities between the races. This is in-line with Williams (1992) in that the social environment is the cause for the higher rates of BP. One hypothesis explored to explain why this effect with education was greater in blacks than whites was that BP-related factors, such as stress, poverty and racial discrimination (remember, even if no racial discrimination occurs, any so-called discrimination is in the eye of the beholder so that will contribute to a rise in physiologic variables) and maybe social isolation may be causes for this phenomenon. Future studies also must show how higher education causes lower BP, or if it only serves as other markers for the social environment. Nevertheless, this is an important study in our understanding of how and why the races differ in BP and it will go far to increase our understanding of this malady.
Conclusion
This is not an exhaustive list—I could continue writing about other variables—but these three are some of the most important as they are a cause for higher mortality rates in America. Understanding the hows and whys of these variables will have us better equipped to help those who suffer from diseases brought on by these differences in physiological factors.
The cause for some of these physiologic differences come down to evolution, but still others may come down to the immediate obesogenic environment (Lake and Townshend, 2006) which is compounded by lower SES. Since high carbs diets increase BP, this explains part of the reason why blacks have higher BP, along with social and genetic factors. Muscle fiber typing is set by the second trimester, and no change is seen after age 6 (Bell, 1980). Resting metabolic rate gap differences between black and white women can be closed, but not completely, if black women were to engage in exercise that use their higher amounts of type II muscle fibers (Tanner et al, 2001). This research is important to understand differences in racial mortality; because when we understand them then we can begin to theorize on how and why we see these disparities.
Physiologic differences between the races are interesting, they’re easily measurable and they explain both disparities in sports and mortality by different diseases. Once we study these variables more, we will be better able to help people with these variables—race be dammed. Race is a predictor here, only because race is correlated with other variables that lead to negative health outcomes. So once we understand how and why these differences occur, then we can help others with similar problems—no matter their race.
My Response to Jared Taylor’s Article “Breakthroughs in Intelligence”
1300 words
Here is my reply to Jared Taylor’s new article over at AmRen Breakthroughs in Intelligence:
“The human mind is not a blank slate; intelligence is biological”
The mind is not a ‘blank slate’, though there is no ‘biological’ basis for intelligence (at least in the way that hereditarians believe). They’re just correlations. (Whatever ‘intelligence’ is.)
“there is no known environmental intervention—including breast feeding”
There is a causal effect of breast feeding on IQ:
While reported associations of breastfeeding with child BP and BMI are likely to reflect residual confounding, breastfeeding may have causal effects on IQ. Comparing associations between populations with differing confounding structures can be used to improve causal inference in observational studies.
Brion, M. A., Lawlor, D. A., Matijasevich, A., Horta, B., Anselmi, L., Araújo, C. L., . . . Smith, G. D. (2011). What are the causal effects of breastfeeding on IQ, obesity and blood pressure? Evidence from comparing high-income with middle-income cohorts. International Journal of Epidemiology, 40(3), 670-680. doi:10.1093/ije/dyr020
Breastfeeding is related to improved performance in intelligence tests. A positive effect of breastfeeding on cognition was also observed in a randomised trial. This suggests that the association is causal.
Horta, B. L., Mola, C. L., & Victora, C. G. (2015). Breastfeeding and intelligence: a systematic review and meta-analysis. Acta Paediatrica, 104, 14-19. doi:10.1111/apa.13139
“before long we should be able to change genes and the brain itself in order to raise intelligence.“
Which genes? 84 percent of genes are expressed in the brain. Good luck ‘finding’ them…
These results corroborate with the results from previous studies, which have shown 84% of genes to be expressed in the adult human brain …
Negi, S. K., & Guda, C. (2017). Global gene expression profiling of healthy human brain and its application in studying neurological disorders. Scientific Reports, 7(1). doi:10.1038/s41598-017-00952-9
“Normal people can have extraordinary abilities. Prof. Haier writes about a non-savant who used memory techniques to memorize 67,890 digits of π! He also notes that chess grandmasters have an average IQ of 100; they seem to have a highly specialized ability that is different from normal intelligence. Prof. Haier asks whether we will eventually understand the brain well enough to endow anyone with special abilities of that kind.”
Evidence that intelligence is not related to expertise.
“It is only after a weight of evidence has been established that we should have any degree of confidence in a finding, and Prof. Haier issues another warning: “If the weight of evidence changes for any of the topics covered, I will change my mind, and so should you.” It is refreshing when scientists do science rather than sociology.”
Even with the “weight of evidence”, most people will not change their views on this matter.
“Once it became possible to take static and then real-time pictures of what is going on in the brain, a number of findings emerged. One is that intelligence appears to be related to both brain efficiency and structure”
Patterns of activation in response to various fluid reasoning tasks are diverse, and brain regions activated in response to ostensibly similar types of reasoning (inductive, deductive) appear to be closely associated with task content and context. The evidence is not consistent with the view that there is a unitary reasoning neural substrate. (p. 145)
Nisbett R. E., Aronson J., Blair C., Dickens W., Flynn J., Halpern D. F., Turkheimer E. Intelligence: New findings and theoretical developments. American Psychologist. 2012;67:130–159. doi: 10.1037/a0026699.
“Early findings suggested that smart people’s brains require less glucose—the main fuel for brain activity—than those of dullards.”
Cause and correlation aren’t untangled; they could be answering questions in a familiar format, for instance, and this could be why their brains show less glucose consumption.
“It now appears that grey matter is where “thinking” takes place, and white matter provides connections between different areas of grey matter. Some brains seem to be organized with shorter white-matter connections, which appear to allow more efficient communication, and there seem to be sex differences in the ways the part of the brain are connected. One of the effects of aging is deterioration of the white-matter connections, which reduces intelligence.”
Read this commentary (pg. 162): Norgate, S., & Richardson, K. (2007). On images from correlations. Behavioral and Brain Sciences, 30(02), 162. doi:10.1017/s0140525x07001379
“Brain damage never makes people smarter”
This is wrong:
You would think that cutting out one-half of people’s brains would kill them, or at least leave them vegetables needing care for the rest of their lives. But it does not. Consider this striking story. A boy starts having seizures at 10 years of age when his right cerebral hemisphere atrophies. By the time he is 12, the left side of his body is paralyzed. When he is 19, surgeons decide to operate and remove the right side of his brain, as it is causing gits in his intact left one. You might think this would lower his IQ or leave him severely retarded, but no. His IQ shoots up 14 points, to 142! The mystery is not so great when you realize that the operation has gotten rid of the source of his fits, which had previously hampered his intelligence. When doctors saw him 15 years later, they described him as “having obtained a university diploma . . . [and now holding] a responsible administrative position with a local authority.”
Skoyles, J. R., & Sagan, D. (2002). Up from dragons: the evolution of human intelligence. New York: McGraw-Hill (pg. 282)
“Prof. Haier wants a concerted effort: “What if a country ignored space exploration and announced its major scientific goal was to achieve the capability to increase every citizen’s g-factor [general intelligence] by a standard deviation?””
Don’t make me laugh. You need to prove that ‘g’ exists first. Glad to see some commentary on epigenetics that isn’t bashing it (it is a real phenomenon, though the scope of it in regards to health, disease and evolution remains to be discovered).
As most readers may know, I’m skeptical here and a huge contrarian. I do not believe that g is physiological and if it were then they better start defining it/talking about it differently because I’ve shown that if it were physiological then it would not mimick any known physiological process in the body. I eagerly await some good neuroscience studies on IQ that are robust, with large ns, their conclusions show the arrow of causality, and they’re not just making large sweeping claims that they found X “just because they want to” and are emotionally invested in their work. That’s my opinion about a lot of intelligence research; like everyone, they are invested in their own theories and will do whatever it takes to save face no matter the results. The recent Amy Cuddy fiasco is the perfect example of someone not giving up when it’s clear they’re incorrect.
I wish that Mr. Taylor would actually read some of the literature out there on TBI and IQ along with how people with chunks of their brains missing can have IQs in the normal range, showing evidence that most a lot of our brain mass is redundant. How can someone survive with a brain that weighs 1.5 pounds (680 gms) and not need care for the rest of his life? That, in my opinion, shows how incredible of an organ the human brain is and how plastic it is—especially in young age. People with IQs in the normal range need to be studied by neuroscientists because anomalies need explaining.
If large brains are needed for high IQs, then how do these people function in day-to-day life? Shouldn’t they be ‘as dumb as an erectus’, since they have erectus-sized brains living in the modern world? Well, the human body and brain are two amazing aspects of evolution, so even sudden brain damage and brain removal (up to half the brain) does not show deleterious effects in a lot of people. This is a clue, a clue that most of our brain mass after erectus is useless for our ‘intelligence’ and that our brains must have expanded for another reason—family structure, sociality, expertise, etc. I will cover this at length in the future.
Racial Differences in Physical Activity and Acquisition of Coronary Artery Calcification
1200 words
Last week a study was published stating that white men who exercised 3 times the recommendation of 1.5 hours (450 minutes, 7.5 hours) had a higher chance of getting coronary artery calcification (CAC), which is the accumulation of plaque and calcium in the arteries of the heart. You, of course see news headlines such as: “Physically active white men at high risk for plaque buildup in arteries“; “White Men Who Exercise Every Day Have 86 Per Cent Higher Risk of Heart Disease Than Black Men, Study Claims“; “Excessive Exercise May Harm The Heart, Study Suggests “; “Excessive exercise increases risk of arterial plaque buildup in white men“; (and my personal favorite headline about this study): “You can exercise yourself to death, says new study“. People just passing by and reading the title (like most do) may then conclude that “they’re saying not to exercise because of CAC.” No, this is not what they are saying at all.
The Coronary Artery Risk Development in Young Adults (CARDIA) study is one of the most important studies in the study of coronary heart disease that have been undertaken. It is a sample of men and women, about equal numbers of each race, from Birmingham, Alabama; Chicago, Illinois; Minneapolis, Minnesota; and Oakland, California. The study began in 1985-86 and there were follow-up examinations at “1987-1988 (Year 2), 1990-1991 (Year 5), 1992-1993 (Year 7), 1995-1996 (Year 10), 2000-2001 (Year 15), 2005-2006 (Year 20), 2010-2011 (Year 25), and 2015-2016 (Year 30).” The CARDIA website writes:
Data have also been collected on physical measurements such as weight and body composition as well as lifestyle factors such as dietary and exercise patterns, substance use (tobacco and alcohol), behavioral and psychological variables, medical and family history, and other chemistries (e.g., insulin).
So there is a goldmine of information to be gleaned from this data. The study that is getting press in the news uses data from this cohort.
The study
The study is titled 25-Year Physical Activity Trajectories and Development of Subclinical Coronary Artery Disease as Measured by Coronary Artery Calcium by Laddu et al (2017). They studied three cohorts by the amount of time they exercised per week: below requirement, at requirements, or above requirements. It is recommended to exercise at least 150 minutes per week.
There were 3,175 men and women who participated in the CARDIA study between 1985 and 2011 who had CAC data available for 25 years. About 47.4 percent of the sample was black, with 56.6 being women. The cohort “consisted of 18.9% black men, 24.6% white men, 28.6% black women, and 28.0% white women” (Laddu et al, 2017).
Of the three activity levels they studies (below 150 minutes, 150 minutes, and over 150 minutes), they observed that white men who exercised 3 times the weekly recommendation (150 minutes(3)= 450 minutes=7.5 hours) had a higher chance of developing CAC. It’s worth noting that exercise time was self-reported (which is the only way I can see how something like this would work, are you supposed to follow people with a camera every day to see how long they engage in physical activity?).
In regards to the physical activity measurement, Laddu et al (2017) write:
At each of the 8 examinations, self-reported leisure-time PA was ascertained by the interviewer-administered CARDIA Physical Activity History Questionnaire.17 Participants were asked about the frequency of participation in 13 specific categories (8 vigorous intensity and 5 moderate intensity) of recreational sports, exercise, home maintenance, and occupational activities during the previous 12 months. Intensity for each activity was expressed as metabolic equivalents (METs), in which 1 MET is defined as the energy expended at rest, which is approximately equivalent to an oxygen consumption of 3.5 mL per 1 kg of body weight per minute.18Vigorous activities (≥6 METs) included running or jogging; racquet sports; biking; swimming; exercise or dance class; job lifting, carrying, or digging; shoveling or lifting during leisure; and strenuous sports. Moderate-intensity activities (3-5 METs) included nonstrenuous sports, walking and hiking, golfing and bowling, home exercises or calisthenics, and home maintenance or gardening.19 Each activity was scored according to whether it was performed for 1 hour or longer during any 1 month during the past year, the number of months it was performed at that level, and the number of months the activity was performed frequently. Each activity was then assigned an intensity score, ranging from 3 to 8 METs, and a duration threshold (ranging from 2-5 hours per week), above which participation was considered to be frequent.20
This is a good metric; though I would like to see a study that looks at just gym-going activity and death, time spent in the gym strength training/moderate to intense cardio. Nevertheless, white men who reported more physical activity had a higher chance of acquiring CAC. Though I can see people’s recall being hazy, people over/under reporting, etc etc.
White men who exercised 7.5 hours per week were 27 percent more likely to get CAC, whereas blacks who exercised that much were at no greater risk to acquire CAC when compared to whites (7.5 hours of exercise compared to less than 2.5 hours per week). Black women who exercised less than the recommendations had a higher chance of acquiring CAC. The researchers couldn’t ascertain why white men who exercised three times the recommendations had such a higher chance of acquiring CAC by the time they reached middle age, but Dr. Jamal Rana says “however this plaque buildup may well be of the more stable kind, and thus less likely to rupture and causes heart attack, which was not evaluated in this study.” The head author, Dr. Deepika Laddu also reiterated: “it does not suggest that anyone should stop exercising.” So people who just read these click bait headlines who say “They’re telling whites not to exercise!”, you’re wrong and you should read papers and not news articles.
This is the perfect example of people reading click baity, fear-mongering headlines and running with it. I saw some people saying “They’re telling us not to exercise!” No. If you were to read the paper and any serious news articles on the matter, you’d see that they do not recommend that people do not exercise. Now the question is, why do whites who exercise more than 7.5 hours per week have a higher chance of acquiring heart disease? I can think of a few explanations (though they are not satisfactory): 1) genes: which genes? Why? How do they interact with the body over time to lead to arterial calcification?; 2) dietary habits: I’d like to know what their diet was like and see their macro composition, carbohydrates, not saturated fat, causes heart disease (Siri-Tirino et al, 2010; de Souza et al, 2015) so that may be a huge contributing factor.
Nevertheless, this is yet another physiological race difference. Oddly enough, black men are more likely than white men to have hypertension (Hicken et al, 2013).
Even though black men, on average, have higher rates of hypertension than white men, white men who are physically active for 7.5 had a higher chance of acquiring CAC than those who exercised less than 2.5 hours per week. This effect wasn’t seen in black men who had physical activity at that level, which, of course, implies that differences in genes and SES underlie this difference. I await more papers into this matter into the mechanisms of how and why this occurs and will ruminate on this myself in the future. No, this study does not tell white men not to exercise.
Evidence for Natural Selection in Humans: East Asians Have Higher Frequency of CASC5 Brain Size Regulating Gene
1500 words
Brain size is one physical difference that the races differ on. East Asians have bigger brains than Europeans who have bigger brains than Africans (Beals et al, 1984; Rushton, 1997). What caused these average differences and the ultimate causes for them have been subject to huge debate. Is it drift? Natural/sexual selection? Mutation? Gene flow? Epigenetic? One reason why brains would need to be large in colder climates is due to heat retention, while in tropical climates heads need to be smaller to dissipate heat. One of the biggest criticisms of HBD is that there is no/little evidence of recent natural selection between human races. Well, that has changed.
CASC5 “performs two crucial functions during mitosis, being required for correct attachment of chromosome centromeres to the microtubule apparatus, and also essential for spindle-assembly checkpoint (SAC) signaling” (Shi et al, 2016). The gene has been found to be important in recent human evolution along with neurogenesis.
Shi et al (2016) genotyped 278 Han Chinese (174 females and 104 males with a mean age of 36) who were free of maladies or genetic defects. They had the coding sequences of CASC5 for humans, chimpanzees, gorillas, baboons, gibbons, orangutans, tarsiers, Denisovans, and Neanderthals. They downloaded genotypes from the Human Genome Project for their analysis.
They compared CASC5 among three human species: humans, Neanderthals, and Denisovans. Using chimpanzees as an outgroup, they discovered 45 human-specific mutations, 48 Neanderthal-specific mutations, and 41 Neanderthal-specific mutations. Further, when one exon region was aligned among modern humans, non-human primates and other mammalian species, 12 amino acid sites showed divergence between modern humans, Neanderthals, and Denisovans with 8 occurring in modern humans. Of the 8 sites in humans, 6 are preserved which implies that they were important in our evolutionary history.
Shi et al (2016) write:
At the population level, among the 8 modern human amino acid changes, two (H159R and G1086S) are fixed in current human populations, and the other six are polymorphic Fig. 1). Surprisingly, 5 of the 6 amino acid polymorphic sites showed deep between-population divergence in allele frequencies. East Asians possess much higher frequencies of the derived alleles at four sites (T43R-rs7177192, A113T-rs12911738, S486A-rs2412541 and G936R-rs8040502) as compared to either Europeans or Africans (Fig. 1), while E1285K-rs17747633 is relatively enriched in Europeans (46%), and rare in East Asians (10%) and Africans (3%). No between-population divergence was observed for T598 M-rs11858113 (Fig. 1).
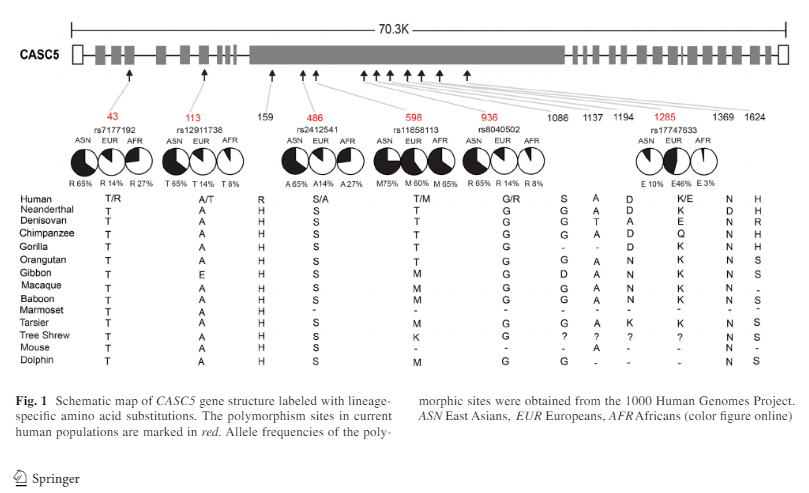
So East Asians have a much higher frequency of this derived trait. This is direct evidence for natural selection in recent human evolution in regards to the physical structure of the brain.
Since most of the amino acid polymorphic sites showed between-population divergence, they decided to analyze the three classical races using 1000 genomes. The variation between the races could be due to either genetic drift or natural selection. When they analyzed certain gene regions, they observed a signal of positive selection for East Asians but not Europeans or Africans. They further tested this selection signal using “the standardized integrated haplotype score (iHS) which is used for detecting recent positive selection with incomplete sweep (i.e. the selected allele is not yet fixed)” (Shi et al, 2016). Using this method, they discovered a few SNPs with large iHS values in Europeans (7 SNPs at 4.2 percent) and none in Africans.
They also conducted a genome-wide scan of Fst, iHS, and “XPCLR (searching for highly differentiated genomimc regions as targets of selective sweeps)” (Shi et al, 2016). Several SNPs had high Fst, iHS and XPCLR scores, which indicate that these alleles have been under positive selection in East Asians. Among the fixed amino acid sites in human populations, East Asians showed 5, Europeans showed 1, and Africans showed 0 which, the authors write, “[imply] that these amino acid changes may have functional effects” (Shi et al, 2016). Furthermore, using the HDGP, they obtained the frequency of the 6 amino acid sites in 53 populations. This analysis showed that 4 of the 6 amino acid sites are “regionally enriched in East Asia .. in line with the suggested signal of population-specific selection in this area” (Shi et al, 2016).
Then, since CASC5 is a brain size regulating gene, they looked for phenotypic effects. They recruited 167 Han Chinese (89 men, 178 women) who were free of maladies. They genotyped 11 SNPs and all of the frequencies followed Harvey-Weinberg Equilibrium (which states that allele and genotype frequencies will remain constant in a population from generation to generation in the absence of evolutionary pressures; Andrews, 2010). In the female sample, 5 regions were related to gray matter volume and four were on the amino acid polymorphic sites. Interestingly, the four alleles which showed such a stark difference between East Asians and Europeans and Africans showed more significant associations in Han Chinese females than males. Those carrying the derived alleles had larger brain volumes in comparison with those who had the ancestral alleles, implying recent natural selection in East Asia for brain size.
Shi et al (2015) also attempted two replications on this allele writing:
We further conducted a replication analysis of the five significant CAC5 SNPs in two other independent Han Chinese samples (Li et al. 2015; Xu et al. 2015). The results showed that three SNPs (rs 7177192, rs11858113 and rs8040502) remained significant in Replication-1 for total brain volume and gray matter volume (Xu et al. 2015), but no association was detected in Replication-2 (Li et al. 2015) (Table S4).
It is very plausible that the genes that have regulated brain growth in our species further aid differences in brain morphology within and between races. This effect is seen mostly in Han Chinese girls. Shi et al (2016) write in the Discussion:
If this finding is accurate and can be further verified, it suggests that that [sic] after modern humans migrated out of Africa less than 100,000 years ago, the brain size may still be subject to selection.
I do believe it is accurate. Of course, the brain size could still be subject to selection; there is no magic field shielding the brain against selection pressure. Evolution does not stop at the neck.
So Shi et al (2016) showed that there were brain genes under recent selection in East Asians. What could the cause be? There are a few:
- Climate: In colder climates you need a smaller body size and big brain to survive the cold to better thermoregulate. A smaller body means there is less surface area to cover, while a larger head retains heat. It, obviously, would have been advantageous for these populations to have large brains and thus get selected for them—whether by natural or sexual selection. This could also have to do with the fact that one needs bigger eyes in colder environments, which would cause an increase in the size of the brain for the larger eyes, as well as being sharper visio-spatially.
- Intelligence: East Asians in this study showed that they had high levels of gray matter in the skull. Further, large brains are favored by an intermediately challenging environment (Gonzalez-Forero, Faulwasser, and Lehmann, 2017).
- Expertise: I used Skoyle’s (1999) theory on expertise and human evolution and applied it to racial differences in brain size and relating it to the number of tools they had to use which differed based on climate. Now, of course, if one group uses more tools then, by effect, they would need more expertise with which to learn how to make those tools so large brains would be selected for expertise—especially in novel areas.
- Vision: Large brains mean large eyes, and people from cold climates have large eyes and large brains (Pearce and Dunbar, 2011). Decreasing light levels select for larger eye size and visual cortex size in order to “increase sensitivity and maintain acuity“. Large eyeballs mean enlarged visual cortices. Therefore, in low light, large brains and eyes get selected for so one can see better in a low light environment.
Of course, all four of the examples below could (and probably do) work in tandem. However, before jumping to conclusions I want to see more data on this and how the whole of the system interacts with these alleles and these amino acid polymorphic sites.
In sum, there is now evidence for natural selection on East Asians (and not Africans or Europeans) that favored large brains, particularly gray matter, in East Asians with considerable sexual dimorphism favoring women. Four of the genes tested (MCPH1, ASPM, CDK5RAP2, and WDR62) are regulated by estradiol and contribute to sexual dimorphism in human and non-human primates (Shi et al, 2016). Though it still needs to be tested if this holds true for CASC5.
This is some of the first evidence that I have come across for natural selection on genes that are implicated in brain evolution/structural development between and within populations. It does show the old “Rushton’s Rule of Three“, that is, Mongoloids on top, Caucasians in the middle, and Negroids on bottom, though Caucasians were significantly closer to Africans than Mongoloids in the frequency of these derived alleles. I can see a HBDer going “They must be related to IQ”, I doubt it. They don’t ‘have’ to be related to IQ. It just infers a survival advantage in low light, cold environments and therefore it gets selected for until it reaches a high frequency in that population due to its adaptive value—whether spreading by natural or sexual selection.
MAOA, Race, and Crime: A Simple Relationship?
2400 words
When I first got into HBD back in 2012, one of the first things I came across—along with the research on racial IQs from Rushton, Lynn, Jensen et al—was that the races differed in a gene called MAOA-L, which has a frequency in Caucasians at .1 percent (Beaver et al, 2013), 54 percent in Chinese people (Lu et al, 2013; 56 percent in Maoris (Lea and Chambers 2007) while about 60-65 percent of Japanese people have the low-frequency version of this gene (Way and Lieberman, 2007).
So if these ethnies have a higher rate of this polymorphism and it is true that this gene causes crime, then the Chinese and Japanese should have the highest rates of crime in the world, since even apparently the effect of MAOA and violence and antisocial behavior is seen even without child abuse (Ficks and Waldman, 2014). Except East Asian countries have lower rates of crime (Rushton, 1995; Rushton and Whytney, 2002). Though, Japan’s low crime rate is relatively recent, and when compared with other countries on certain measures “Japan fares the same or worse when compared to other nations” (Barberet 2009, 198). This goes against a lot of HBD theory, and I will save that for another day. (Japan has a 99 percent prosecution rate, which could be due to low prosecutorial budgets; Ramseyer and Rasmusen, 2001. I will cover this in the future.)
The media fervor—as usual—gave the MAOA gene the nickname “the warrior gene“, which is extremely simplistic (I will have much more to say on ‘genes for’ any trait towards the end of the article). I will show how this is a very simplistic view.
The MAOA gene was first discovered in 1993 in a Dutch family who had a history of extreme violence going as far back as the 1890s. Since the discovery of this gene, it has been invoked as an ultimate cause of crime. However, as some hereditarians do note, MAOA only ’causes’ violence if one has a specific MAOA genotype and if they have been abused as a child (Caspi et al, 2002; Cohen et al, 2006; Beaver et al, 2009; Ferguson et al, 2011; Cicchetti, Rogosch, Thibodeau, 2012;). People have invoked these gene variants as ultimate causes of crime—that is, people who have the low-expressing MAOA variants are more likely to commit more crime—but the relationship is not so simple.
Maoris are more four times more likely to have the low-expressing gene variant than Europeans, the same holding for African Americans and Europeans (Lea and Chambers, 2007).
There is, however, a protective effect that protects whites (and not non-whites in certain cases) against antisocial behavior/violent attitudes if one has a certain genotype (Widom and Brzustowicz, 2006), though the authors write on page 688: “For non-whites, the effect of child abuse and neglect on the juvenile VASB was not significant (beta .08, SE .11, t 1.19, ns), whereas the effect of child maltreatment on lifetime VASB composite approached significance (beta .13, SE .12, t 1.86, p .06). For non-whites (see Figure 2), neither gene (MAOA) environment (child abuse and neglect) interaction was significant: juvenile VASB (beta .06, SE .28, t .67, ns) and lifetime VASB (beta .01, SE .29, t .14, ns).” So as you can see, there are mixed results. Whites seem to be protected against the effect of antisocial behavior and violence but only if they have a certain genotype (which implies that if they have the other genotype, then if abused they will show violent and antisocial behavior). So, we can see that the relationship between MAOA and criminal behavior is not as simple as some would make it out to be.
MAOA, like other genetic variants, of course, has been linked to numerous other traits. Steven J. Heine, author of the book DNA is Not Destiny: The Remarkable and Completely Misunderstood Relationship Between You and Your Genes:
However, any labels like “the warrior gene” are highly problematic because they suggest that the this gene is specifically associated with violence. It’s not, just as alleles from other genes do not only have one outcome. Pleiotropy is the term for how a single genetic variant can influence multiple different phenotypes. MAOA is highly pleiotropic: the traits and conditions potientially connected to the MAOA gene invlude Alzheimer’s. anoerxia, autism, body mass index, bone mineral density, chronic fatigue syndrome, depression, extraversion, hypertension, individualism, insomnia, intelligence, memory, neuroticism, obesity, openness to experience, persistence, restless leg syndrome, schizophrenia, social phobia, sudden infant death syndrome, time perception and voting behavior. (59) Perhaps it would be more fitting to call MAOA “the everything but the kitchen sink gene. (Heine, 2017: 195)
Something that I have not seen brought up when discussions of race, crime, and MAOA come up is that Japanese people have the highest chance—even higher than blacks, Maoris, and whites—to have the low repeat MAOA variant (Way and Lieberman) yet have lower rates of crime. So MAOA cannot possibly be a ‘main cause’ of crime. It is way more complex than that. “However intuitively satisfying it may be to explain cultural differences in violence in terms of genes“, Heine writes, “as of yet there is no direct evidence for this” (Heine, 2017: 196).
Numerous people have used ‘their genes’ in an attempt to get out of criminal acts that they have committed. A judge even knocked off one year off of a murder’s sentence since he found the evidence for the MAOA gene’s link to violence “particularly compelling.” I find it “particularly ridiculous” that the man got less time in jail than someone who ‘had a choice’ in his actions to murder someone. Doesn’t it seem ridiculous to you that someone gets less time in jail than someone else, all because he may have the ‘crime/warrior gene’?
Aspinwall, Brown, and Tabery (2012) showed that when evidence of a ‘biomechanic’ cause of violence/psychopathy was shown to the judges (n=191), that they reduced their sentences by almost one year if they were reading a story in which the accused was found to have the low-repeat MAOA allele (13.93 to 12.83 years). So, as you can see, this can sway judges’ perception into giving one a lighter sentence since they believe that the evidence shows that one ‘can not control themselves’, which results in the judge giving assailants lighter sentences because ‘it’s in their genes’.
Further, people would be more lenient on sentences for criminals who are found to have these ‘criminal genes’ than those who were found to not have them (Cheung and Heine, 2015). Monterosso, Royzman, and Schwartz (2010) also write: “Physiologically explained behavior was more likely to be characterized as “automatic,” and willpower and character were less likely to be cited as relevant to the behavior. Physiological explanations of undesirable behavior may mitigate blame by inviting nonteleological causal attributions.” So, clearly, most college students would give a lighter sentence if the individual in question were found to have ‘criminal genes’. But, if these genes really did ’cause’ crime, shouldn’t they be given heavier sentences to keep them on the inside more so those with the ‘non-criminal genes’ don’t have to suffer from the ‘genetically induced’ crime?
Heine (2017: 198-199) also writes:
But is someone really less any responsible for their actions if his or her genes are implicated? A problem with this argument is that we would be hard-pressed to find any actions that we engage in where our genes are not involved—our behaviors do not occur in any gene-free zones. Or, consider this: there actually is a particular genetic variant that, if you possess it, makes you about 40 times more likely to engage in same-sex homicides than those who possess a different variant. (66) It’s known as the Y chromosome—that is, people who possess it are biologically male. Given this, should we infer that Y chromosomes cause murders, and thus give a reduced sentence to anyone who is the carrier of such a chromosome because he is really not responsible for his actions? The philosopher Stephen Morse calls the tendency to excuse a crime because of a biological basis the “fundamental psycholegal error.” (67) The problem with this tendency is that it involves separating yout genes from yourself. Saying “my genes made me do it” doesn’t make sense because there is no “I” that is independent of your genetic makeup. But curiously, once genes are implicaed, people see, to feel that the accused is no longer fully in control of his or her actions.
Further, in the case of a child pornographer, one named Gary Cossey, the court said:
The court predicted that some fifty years from now Cossey’s offense conduct would likely be discovered to be caused by “a gene you were born with. And it’s not a gene you can get rid of.” The court expressed its belief that although Cossey was in therapy, it “can only lead, in my view, to a sincere effort on your part to control, but you can’t get rid of it. You are what you’re born with. And that’s the only explanation for what I see here.”
However, this judge punished Cossey more severely due to the ‘possibility’ that scientists may find ‘genes for’ child pornography use in 50 years. Cossey was then given another, unbiased judge, and was given a ‘more lenient’ sentence than the genetic determinist judge did.
Sean Last over at The Alternative Hypothesis is also a big believer in this so-called MAOA-race difference that explains racial differences in crime. However, as reviewed above (and as he writes), MAOA can be called the “everything but the kitchen sink gene” (Heine, 2017: 195), as I will touch on briefly below, to attribute ’causes’ to genes is not the right way to look at them. It’s not so easy to say that since one ‘has the warrior gene’ that they’d automatically be violent. Last cites a study saying that even those who have the MAOA allele who were not abused showed higher rates of violent behavior (Ficks and Waldman, 2014). They write (pg. 429):
The frequency of the ‘‘risk’’ allele in nonclinical samples of European ancestry ranges from 0.3 to 0.4, although the frequency of this allele in individuals of Asian and African ancestry appears to be substantially higher (*0.6 in both groups; Sabol et al. 1998).
So, why don’t Asians have higher rates of crime—along with blacks—if MAOA on its own causes violent and antisocial behavior? Next I know that someone would claim that “AHA! TESTOSTERONE ALSO MEDIATES THIS RELATIONSHIP!!” However, as I’ve talked about countless times (until I’m blue in the face), blacks do not have/have lower levels of testosterone than whites (Richards et al, 1992; Gapstur et al, 2002; Rohrmann et al, 2007; Mazur, 2009; Lopez et al, 2013; Hu et al, 2014; Richard et al, 2014). Though young black males have higher levels of testosterone due to the environment (honor culture) (Mazur, 2016). So that canard cannot be trotted out.
All in all, these simplistic and reductionist approaches to ‘figuring out’ the ’causes’ of crime do not make any sense. To point at one gene and say that this is ‘the cause’ of that do not make sense.
One last point on ‘genes as causes’ for behavior. This is something that deserves a piece of its own, but I will just provide a quote from Eva Jablonska and Marion Lamb’s book Evolution in Four Dimensions: Genetic, Epigenetic, Behavioral, and Symbolic Variation in the History of Life (Jablonska and Lamb, 2014: 17; read chapter one of the book here; I have the nook version so the page number may be different):
Although many psychiatrists, biochemists, and other scientists who are not geneticists (yet express themselves with remarkable facility on genetic issues) still use the language of genes as simple causal agents, and promise their audience rapid solutions to all sorts of problems, they are no more than propagandists whose knowledge or motives must be suspect. The geneticists themselves now think and talk (most of the time) in terms of genetic networks composed of tens or hundreds of genes and gene products, which interact with each other and together affect the development of a particular trait. They recognize that whether or not a trait (a sexual preference, for example) develops does not depend, in the majority of cases, on a difference in a single gene. It involves interactions among many genes, many proteins and other types of molecule, and the environment in which an individual develops.
So to say that those who have low-functioning MAOA variants have an ‘excuse’ as to why they commit crime is incorrect. I know that most people know this, but when you read some people’s writings on things like this it’s like they think that these singular genes/polymorphisms/etc cause these things on their own. In actuality, you need to look at how the whole system interacts with these things, and not reduce whole complex physiological systems to a sum of its parts. This is why implicating singular genes/polymorphisms as explanations for racial differences in crime does not make sense (as can be seen with the Japanese example).
To reduce behaviors simply to gene X and not look at the whole system does not make any sense. There are no ‘genes for’ anything, except a few Mendelian diseases (Ropers, 2010). Stating that certain genes ’cause’ X, as I have shown does not make sense and, wrongly, in my opinion, gives criminals less of a sentencing since judges find stuff like this ‘very compelling’. If that’s the case, why implicate any murderer? ‘Their genes made them do it’, right? Though, things are not that simple to implicate one gene as a cause for crime or any other complex behavior; in this sense—like for most things to do with the human body—holism makes way more sense and not reductionism. We need to look at how these genes that are ‘implicated’ in criminal behavior interact with the whole system. Only then can we understand the causes of criminal behavior. Looking at singular genes impedes us from figuring out the true underlying reasons why people commit crime.
Remember: we can’t blame “warrior genes” for violent crime. If someone does have a ‘genetic predisposition to crime’ from the MAOA gene, then wouldn’t it make more sense to give them more time? Though, the relationship is not so simple as I have covered. So to close, there is no ‘simple relationship’ between race, crime and MAOA. Not in the way that other hereditarians would like you to believe. Because if this relationship were so simple, then East Asians (Chinese, Japanese) would have the highest rates of crime, and they do not.
No, Black Women Do Not Have Higher Testosterone than White Women (And More On Hereditarian Claims on Racial Testosterone Differences)
1850 words
It has been over a year since I wrote the article Black Women and Testosterone, and I really regret it. Yes, I did believe that black women had higher levels of testosterone than white women due to one flimsy study and another article on pregnant black women. I then wised up to the truth about testosterone and aggression/crime/race/sex and revised the articles (like I have done with r/K selection theory). However, after I revised my views on the supposed differences in testosterone between black men/white men and black women/white women, people still cite the article, disregarding the disclaimer at the top of the article. I quoted Mazur (2016), who writes (emphasis mine):
The pattern [high testosterone] is not seen among teenage boys or among females.
…
There is no indication of inordinately high T among young black women with low education.
…
Honor cultures are cast as male affairs, but with T data in hand for both sexes, it is worth exploring whether or not a similar pattern exists among women. Mean T was calculated as a function of age for the four combinations of race and education used in Table 1 but now for women. All plots show T declining with age, from about 35 ng/dL in the 20–29 age group to about 20 ng/dL among women 60 years and older. The four plots essentially overlap without discernible differences among them. Given the high skew of T among adult females, both raw and ln-transformed values were analyzed with similar results. There is no indication of inordinately high T among young black women with low education.
…
In the present study, at least, the sexes differ because the very high T seen among young black men with low education does not occur among young black women with low education.
This is very clear… Mazur (2016) analyzed the NHANES 2011-2012 data and this is what he found. I understand that most HBD bloggers do believe this, well, like a lot of their strong assertions (which I have rebutted myself), they’re wrong. They don’t get it. They do not understand the hormone.
The reason why I’m finally writing this (which is long overdue) is that I saw a referral from this website today: https://www.minds.com/RedPillTV who writes about the aforementioned black women and testosterone article:
It is known that blacks have the highest levels of testosterone out of the major races of humanity. However, what’s not known is that black women have higher rates than white women. The same evolutionary factors that make it possible for black men to have high testosterone make it possible for women as well.
https://notpoliticallycorrect.me/2016/09/06/black-women-and-testosterone/
…..No. It seems that people just scroll on by the disclaimer at the top that is bolded and italicized and just go to the (now defunct) article and attempt to prove their assertion that black women have higher testosterone than white women with an article that I have stated myself I no longer believe and have provided the rationale/data for the position. This shows that people have their own biases and no matter what the author writes about their views that have changed due to good arguments/data, they will still attempt to use the article to prove their assertion.
I’ve written at length that testosterone does not cause 1) aggression, 2) crime and 3) prostate cancer. People are scared of testosterone mostly due to the media fervor of any story that may have a hint of ‘toxic masculinity’. They (most alt-righters) are scared of it because of Lynn/Rushton/Templer/Kanazawa bullshit on the hormone. Richard Lynn doesn’t know what he’s talking about on testosterone. No, Europeans did not need lower levels of aggression in the cold; Africans didn’t need higher levels of aggression (relative to Europeans) to survive in the tropics. The theory that supposed differential testosterone differences between the races are “the physiological basis in males of the racial differences in sexual drive which form the core of the different r/K reproduction strategies documented by J.P. Rushton” (Lynn, 1990: 1203). The races, on average, do not differ in testosterone as I have extensively documented. So hereditarians like Lynn and others need to look for other reasons to explain blacks’ higher rate of sexual activity.
Rushton’s views on the testosterone and supposed r/K continuum have been summarily rebutted by me. These psychologists’ views on the hormone (that they don’t understand the production of nor do they understand the true reality of the differences between the races) are why people are afraid of testosterone. No, testosterone is not some ‘master switch’ as Rushton (1999) asserts. Rushton asserts that racial differences in temperament are mediated by the hormone testosterone. He further dives into this assertion stating “Testosterone level correlates with temperament, self-concept, aggression, altruism, crime, and sexuality, in women as well as in men (Harris, Rushton, Hampson, & Jackson, 1996). It may ‘correlate’ with aggression and crime, but as I have documented, they do not cause either.
The aggression/testosterone correlation is only .08 (Archer, Graham-Kevan, and Davies, 2005). Furthermore, the diurnal variation in testosterone does not directly correlate to when testosterone levels are highest in the day (at 8 am and drop thereafter), with adults peaking in crime at 10 pm and kids at 3 pm, with rises at 8 pm and 12 pm (not surprisingly, kids go in to school around 8 am, go to recess at 12 and leave at 3).

(Source: The Office of Juvenile Justice and Delinquency Prevention (OJJDP))
If you’ve read as much Rushton as I have, you’ll notice that he begins to sound like a broken record when talking about certain things. One of the most telling is Rushton’s repeated assertions that blacks average 3-19 percent higher testosterone than whites. The 3 percent number comes from Ellis and Nyborg (1992) and the 19 percent number comes from Ross et al (1986) (which Rushton should know that after adjustments for confounding, it decreased to 13 percent). These are the only studies that hereditarians ever cite for these claims that blacks average higher testosterone than whites. That seems a bit fishy to me. Cite a 30-year-old study along with a 25-year-old study (with such huge variation from Rushton and those who cite him for this matter—3-19 percent!!) as ‘proof’ that blacks average such higher levels of testosterone in comparison to whites.
Ross et al (1986) is one of the most important studies to rebut for this hereditarian claim that testosterone causes all of these maladies in black American populations. Ross et al (1986) propose that higher levels of the hormone lead to the higher rates of prostate cancer in black American populations. However, meta-analyses do not show this (Zagars et al, 1998; Sridhar et al, 2010).
Rushton et al’s assertions—largely—lie on this supposed testosterone difference between the races and how it supposedly leads to higher rates of crime, prostate cancer, aggression, and violence. However, the truth of the matter is, this is all just hereditarian bullshit. Larger analyses—as I have extensively documented—do not show this trend. And even accepting the claim that blacks have, say, 19 percent higher levels of testosterone than whites, it still would not explain the supposed prostate cancer rates between the races (Stattin et al, 2003; Michaud, Billups, and Partin, 2015). Even if blacks had 19 percent higher testosterone than whites, it would not explain higher levels of crime nor aggression due to such a hilariously low correlation of .08 (Archer, Graham-Kevan, and Davies, 2005).
Finally, I have a few words for Michael Hart and his (albeit sparse) claims on testosterone in his 2007 book Understanding Human History.
Hart (2007) writes:
(Many of these differences in sexual behavior may be a consequence of the fact that
blacks, on average, have higher levels of testosterone than whites.7) (pg. 127)
And….. footnote number 7 is…. surprisingly (not): 7) Ross, R., et al. (1986). Not going to waste my time on this one, again. I’ve pointed out numerous flaws in the study. (I will eventually review the whole thing.)
It seems unlikely, though, that the higher testosterone level in blacks — which is largely genetic in origin — has no effect on their sexual behavior (pg. 128; emphasis mine)
This is bullshit. People see the moderately high heritability of testosterone (.60; Harris, Vernon, and Boomsma, 1998) and jump right to the “It’s genetics!!!” canard without even understanding its production in the body (it is a cholesterol-based hormone which is indirectly controlled by DNA, there are no ‘genes for’ testosterone). Here are the steps: 1) DNA codes for mRNA; 2) mRNA codes for the synthesis of an enzyme in the cytoplasm; 3) luteinizing hormone stimulates the production of another messenger in the cell when testosterone is needed; 4) this second messenger activates the enzyme; 5) the enzyme then converts cholesterol to testosterone
I have documented numerous lines of evidence showing that testosterone is extremely sensitive to environmental factors (Mazur and Booth, 1998; Mazur, 2016), and due to the homeodynamic physiology we have acquired due to ever-changing environments (Richardson, 2017), this allows our hormones to up- or down-regulate depending on what occurs in the environment. The quote from Hart is bullshit; he doesn’t know what he’s talking about.
For females in Siberia, the disadvantages of failing to find a man who would
provide for her and her children during their childhood were much greater than they were in tropical climates, and females who were not careful to do so were much less likely to pass on their genes. Furthermore, because females in harsh climates were so demanding on this point, males who seemed unlikely to provide the needed assistance found it hard to find mates. In other words, there was a marked sexual selection against such males. Such selection could result, for example, in the peoples living in northerly climates gradually evolving lower levels of testosterone than the peoples living in subSaharan Africa. (pg. 131)
This is a bullshit just-so story. Africans in Africa have lower levels of testosterone than Western men (Campbell, O’Rourke, and Lipson, 2003; Lucas and Campbell, and Ellison, 2004; Campbell, Gray, and Ellison, 2006).
Note also that a difference in testosterone level frequently affects not
only the sexual behavior of a young male, but also his aggressiveness.
No it does not (Archer, Graham-Kevan, and Davies, 2005).
Thankfully, that’s all he wrote about testosterone. There is so much bullshit out there. Though, people who like and seek out the truth will learn that there are no racial differences and that testosterone does not cause crime/aggression/prostate cancer and that it’s just hereditarian bullshit.
The evidence I have amassed and the arguments I have given point to a few things: 1) the races do not differ in testosterone/there is a small negligible difference; 2) testosterone does not cause crime; 3) testosterone does not cause aggression; 4) black women do not have higher levels of testosterone than white women; 5) high levels of testosterone do not cause prostate cancer; and 6) even allowing a 19 percent black/white difference will not have hereditarian claims hold true.
So for anyone who comes across my old articles on testosterone and sex/race, do a bit more reading of my newer material here to see my new viewpoints/arguments. DO NOT cite these articles as proof for your claims of higher levels of black men/women. DO cite the old articles ALONG WITH the new ones to show how and why my views changed along with the studies I have cited that changed my view. (Actually understanding the production of testosterone in the body was a huge factor too, which I talk about in Why Testosterone Does Not Cause Crime.)
Why Do Jamaicans, Kenyans, and Ethiopians Dominate Running Competitions?
2050 words
Much has been written about the genotypic and phenotypic differences in Jamaicans, Kenyans, and Ethiopians. Why do they dominate these competitions? Is it cultural? Genetic? Does training matter more? Grit? Expertise? There are multiple reasons that they have such an advantage, the most important one being their morphology/somatype. Of course other physiologic and morphologic factors come into play for these three populations, but the greatest physical advantage they have is their somatype which lends itself to running—whether short, medium or long distance.
Back in July, I argued that the wide-hipped Neanderthals were stronger than the recently migrated Homo sapiens, due mostly to pelvic anatomy (along with Neanderthal protein intake). That’s one of the keys to explaining African dominance in running: their long slender bodies with high limb ratios.
Kenyans and Ethiopians
Kenyan distance running is driven by an ethny named the Kalenjin, particularly of the Nandi tribe. Much research has been undertaken on the physiology and morphology of certain subpopulations of Kenyans, with a complex genotype, phenotype, and even SES interaction driving the dominance of this subpopulation (Tucker, Onywera, and Santos-Concejero, 2015). Another important factor is their low BMI. Kenyans have the lowest BMIs in the world at 21.5, which considerably helps in regards to distance running (Radovanovic et al, 2014; Shete, Bute, and Deshmukh, 2014; Sedeaud et al, 2015).
Kenyans—like Jamaicans and Ethiopians—dominate these competitions due to a complex interaction between genes, environment and SES (Tucker, Onywera, and Santos-Concejero, 2015). Though, of course, a lot of what makes certain Kenyan populations dominate is trainable in other populations. Caucasians can have similar trainability in regards to Vo2 max, oxidative enzymes, and running economy. However, Kenyans are more likely to be slender with longer limbs which is a huge advantage in these competitions. So having a good running economy and a high Vo2 max may be the primary causal factors that cause them to be so good at distance running, with, as I’ve noted in the past, a higher genetic ceiling for high Vo2 max, along with high-altitude training (Larsen, 2003). Though Saltin et al (1995) conclude that physical activity during childhood combined with intense training as a teenager explains the higher Vo2 max in Kenyan boys. Other factors such as low blood lactate and ammonia accumulation are also important.
Genetics, though, is the most likely explanation for African distance-running dominance (Vancini et al, 2014; see Scott and Pitsiladis, 2007 for alternative view that as of yet there are no genetic evidence for African running superiority).
Not all studies show that Kenyans have more slow-twitch (type I) fibers than Caucasians, though the oxygen cost of running at a given velocity was found to be lower in elite Kenyan runners compared to non-Kenyans, which may be due to body dimensions. Apparently, there is no indication that Kenyans possess a pulmonary system that confers a physiologic advantage over non-Kenyans (Larsen and Sheel, 2015). Ethiopian diets, however, met the most recommendations for macronutrients, but fluids were lacking (Beis et al, 2011), similar to what is found on similar studies in Kenyans (Onywera et al, 2003).
It is important to note that not all of the literature out there says that there are mainly physiologic/genetic reasons for their success in distance running; other factors that may be at play are somatype which leads to exceptional biomechanical and metabolic efficiency, high-altitude training, and the want to succeed for economic and social advancement (Wilbur and Pitsiladis, 2012). Oxygen transport of the blood doesn’t explain Kenyan dominance either, they have similar oxygen transport as elite German runners (Prommer et al, 2010). Though, women and men from Ethiopia and Kenya, although they only account for <0.1% of the marathons and half-marathons, achieved the fastest times and were the youngest in the half-marathons and full-marathons (Knechtle et al, 2016). Similar results were seen in Switzerland, with male Africans being faster and younger than non-Africans (Aschmann et al, 2013).
From the years 2000-2014, Knechtle et al (2017) analyzed the Boston, Berlin, New York, and Chicago marathon along with the Stockholm marathon. Over this time period, Ethiopian men improved their times, but Ethiopian women didn’t. Age increased in Ethiopian men, but not women. Female and male marathon runners from Ethiopia were the fastest (Knechtle et al 2017). More studies, though, are needed to unravel the complex relationship between environmental and genetic factors that cause East Africans to dominate distance running (Onywera, 2009). However, elite endurance athletes consistently test higher than non-elite athletes on running economy, Vo2 max, and anaerobic threshold (Lorenz et al, 2013), and mechanical work may be able to predict recreational long distance performance (Tartaruga et al, 2013).
Jamaicans
Jamaican sprinting dominance has been chalked up to numerous factors, most recently, symmetry of the knees and ankles (Trivers, Palestis, and Manning, 2013; Trivers et al, 2014). Trivers et al (2014) write in the Discussion:
Jamaicans are the elite sprinters of the world. Why? If symmetry of knees and ankles is a factor, why should Jamaicans be especially symmetrical (there is no knowledge of whether they actually are)? One possibility is heterozygosity for genes important to sprinting. The slave trade greatly increased heterozygosity on the West African side by mixing genes up and down the West coast of Africa from Senegal to Nigeria [15], [16]. Recently a mtDNA haplotype has been isolated that correlates with success in African American–but not Jamaican–sprinters [17]. Since there is a general (if often weak) positive relationship between heterozygosity and body symmetry [18] we are eager to do targeted studies of genomics on areas associated with sprinting, including energy substrate utilization, muscle fibre-type distribution and body composition analyses (with specific reference to the shape and size of the glutei maximi). Fast twitch (anaerobic) muscle fibres are characterized by specific adaptations which benefit the performances of explosive high-intensity actions such as those involved in sprinting. Notably, West Africans appear to have a higher fast twitch muscle fibre content than do comparable Europeans (67.5% vs 59% in one sample [19], as cited in [20]).
It’s interesting to note that the mtDNA haplotype predicts success in African American sprinters, but not Jamaicans. In regards to mtDNA haplotypes, Jamaican sprinters had statistically similar mtDNA haplotypes, which suggests that the elite sprinters arose from the same source population which indicates that there is no population stratification or isolation on sprint performance. African American sprinters and non-sprinters, on the other hand, had statistically significant differences in mtDNA, which implies that maternal ancestry plays a part in sprinting performance (Deason et al, 2011). Studying both maternal and paternal haplotypes to see where source populations originate is important in these fields, since if we know where their population came from, then we can better understand the hows and whys of elite running performance—especially between race. Though demographic studies on Jamaicans show that elite sprinters come from the same demographic population, so genetics cannot possibly account for Jamaican sprinting success, so their sprinting success may be related to environmental and social factors (Irving et al, 2013). We know little about the genomics of elite sporting performance (Pitsiladis et al, 2013), so the physical correlates (somatype) and physiologic correlates will do for now.
Usain Bolt is the current fastest man in the world, due in part to his anthropometric advantage (Krzystof and Mero, 2013). As everyone knows, you cannot teach speed (Lombardo and Deaner, 2014). Bolt himself has a large advantage, in part, to his power development and biomechanical efficiency compared to the people he competes with (Beneke and Taylor, 2010). Though one study has noted that a human may be able to run faster quadrupedally than bipedally–stating that at the 2048 Olympic Games, that the fastest human on the planet may well be a quadrupedal runner (Kinugasa and Usami, 2016). One of the most important factors of acceleration in the 100m sprint is stride frequency (Mackala, Fostiak, and Kowalski, 2015).
In Afro-Caribbean adolescents, body height and stride number to body height ratio were the main determinants of sprint performance (Copaver, Hertogh, and Hue, 2012). Body height being a predictor of sprint performance is nothing new; taller people have longer limbs; longer limbs cover more distance per step. Indeed, sprinters are taller than the American population, there is more variability in men than in women, sprinters have lower body mass and the height range excludes people who are really tall or really short (Uth, 2005).
Fiber typing
I will touch on fiber typing again since I’ve come across new information on it.
East Asians are less likely to have the RR allele of the ‘sprint gene’ (MacArthur and North, 2004) (ACTN3) while Bantus are more likely to have it. Alpha-actinen-3 is a skeletal muscle isoform which is encoded by the ACTN3 gene. Alpha-actinen-3 deficiency is common in the general population (North, 2008; Berman and North, 2010), which means that most people in the general population are XX. Eighteen percent of the population on earth is homozygous for this mutation (Ivarsson and Westerblad, 2015). This allele is the 577X allele, and Bantus are less likely to have it while Eurasians are more likely to have it. The frequency of the RR genotype is also highest in Bantus than in Asians (Mills et al, 2001). This is one very important reason why Eurasians are not faster than Africans (somatype matters too, of course).
Elite sprinters are more likely to be RR and less likely to be XX. Why does this matter? It matters because the RR genotype with the right morphology, fiber type (fast twitch) and contractile properties of the individual fast twitch fibers contribute to heightened performance with an RR genotype (Broos et al, 2016). Jamaicans are also less likely to have the XX genotype (~2 percent) along with Kenyans (Scott et al, 2010). So this shows that since Jamaicans are less likely to be XX, they’re more likely to be RR. So since XX i negatively associated with sprint status, then populations that have a lower frequency will be more likely to have more sprinters, whereas a population that has the genotype will have fewer sprinters.
This is one of many genetic factors that account for elite sprinting performance between populations. So, clearly, the right muscle fiber type combined with the right genotype from the ACTN3 gene infers an advantage, contrary to Daniel MacArthur’s claims that it does not (one of the authors of numerous studies on the ACTN3 gene).
Conclusion
The genetics of sprinting/distance running is currently poorly understood. Though we have a few candidates (and they’re really good, showing variation where they should) like the RR ACTN3 genotype combined with fast twitch fibers. This is very important to note. If you’re missing this, and you’re short with a low Vo2 max and low limb length, there’s an extremely high chance you will not be an elite sprinter/distance runner. I cannot emphasize enough how much the physical factors mean when it comes to this.
It is possible that SES variables combined with other psycho-social factors could explain why these three populations excel so well in these sports. Though, on the other hand, you cannot discount that the individual has to have the right somatype and physical capabilities first. Contrary to popular belief, fiber typing DOES give an advantage, especially if combined with other variables. Low BMI is very important, as are long limbs and a taller than average height.
When it comes to Jamaicans, symmetry of the knees and ankles help considerably, along with a low body mass and taller body. SES factors could be driving the will to compete in these three populations, however, the physical ability needs to be there first, then it needs to be nurtured. Over the next 5 to 10 years, we will have a better understanding of why some populations excel over others and that will largely be due to somatype, physiology, and genetic factors, with SES and other psycho-social factors driving the want to excel in the sport.
The physical differences that underlie the success of these three populations needs more study. Elite athletes of Jamaican, Kenyan, and Ethiopian descent need to be studied more to untangle the physiologic, psychological, physical and social factors that have them excel so well. We know that certain combinations of traits infer a great advantage in certain populations, we now just need enough elite athletes of these populations to study to see how and why they excel so much. The current body of research reviewed here is a good start, though it does leave some questions unanswered.
Responses to The Alternative Hypothesis and Robert Lindsay on Testosterone
2300 words
I enjoy reading what other bloggers write about testosterone and its supposed link to crime, aggression, and prostate cancer; I used to believe some of the things they did, since I didn’t have a good understanding of the hormone nor its production in the body. However, once you understand how its produced in the body, then what others say about it will seem like bullshit—because it is. I’ve recently read a few articles on testosterone from the HBD-blog-o-sphere and, of course, they have a lot of misconceptions in them—some even using studies I have used myself on this blog to prove my point that testosterone does not cause crime!! Now, I know that most people don’t read studies that are linked, so they would take what it says on face value because, why not, there’s a cite so what he’s saying must be true, right? Wrong. I will begin with reviewing an article by someone at The Alternative Hypothesis and then review one article from Robert Lindsay on testosterone.
The Alternative Hypothesis
Faulk has great stuff here, but the one who wrote this article, Testosterone, Race, and Crime, 1) doesn’t know what he’s talking about and 2) clearly didn’t read the papers he cited. Read this article, you’ll see him make bold claims using studies I have used for my own arguments that testosterone doesn’t cause crime! Let’s take a look.
One factor which explains part of why Blacks have higher than average crime rates is testosterone. Testosterone is known to cause aggression, and Blacks are known to at once have more of it and, for genetic reasons, to be more sensitive to its effects.
- No it doesn’t.
- “Testosterone is known to cause aggression“, but that’s the thing: it’s only known that it ’causes’ aggression, it really doesn’t.
- Evidence is mixed on blacks being “… for genetic reasons … more sensitive to its effects” (Update on Androgen Receptor gene—Race/History/Evolution Notes).
Testosterone activity has been linked many times to aggression and crime. Meta-analyses show that testosterone is correlated with aggression among humans and non human animals (Book, Starzyk, and Quinsey, 2001).
Why doesn’t he say what the correlation is? It’s .14 and this study, while Archer, Graham-Kevan and Davies, (2005) reanalyzed the studies used in the previous analysis and found the correlation to be .08. This is a dishonest statement.
Women who suffer from a disease known as congenital adrenal hyperplasia are exposed to abnormally high amounts of testosterone and are abnormally aggressive.
Abnormal levels of androgens in the womb for girls with CAH are associated with aggression, while boys with and without CAH are similar in aggression/activity level (Pasterski et al, 2008), yet black women, for instance, don’t have higher levels of testosterone than white women (Mazur, 2016). CAH is just girls showing masculinized behavior; testosterone doesn’t cause the aggression (See Archer, Graham-Kevan and Davies, 2005)
Artificially increasing the amount of testosterone in a person’s blood has been shown to lead to increases in their level of aggression (Burnham 2007; Kouri et al. 1995).
Actually, no. Supraphysiological levels of testosterone administered to men (200 and 600 mg weekly) did not increase aggression or anger (Batrinos, 2012).
Finally, people in prison have higher than average rates of testosterone (Dabbs et al., 2005).
Dabbs et al don’t untangle correlation from causation. Environmental factors can explain higher testosterone levels (Mazur, 2016) in inmates, and even then, some studies show socially dominant and aggressive men have the same levels of testosterone (Ehrenkraz, Bliss, and Sheard, 1974).
Thus, testosterone seems to cause both aggression and crime.
No, it doesn’t.
Why Testosterone Does Not Cause Crime
Testosterone and Aggressive Behavior
Furthermore, of the studies I could find on testosterone in Africans, they have lower levels than Western men (Campbell, O’Rourke, and Lipson, 2003; Lucas and Campbell, and Ellison, 2004; Campbell, Gray, and Ellison, 2006) so, along with the studies and articles cited on testosterone, aggression, and crime, that’s another huge blow to the testosterone/crime/aggression hypothesis.
Richard et al. (2014) meta-analyzed data from 14 separate studies and found that Blacks have higher levels of free floating testosterone in their blood than Whites do.
They showed that blacks had 2.5 to 4.9 percent higher testosterone than whites, which could not explain the higher prostate cancer incidence (which meta-analyses call in to question; Sridhar et al 2010; Zagars et al 1998). That moderate amount would not be enough to cause differences in aggression either.
Exacerbating this problem even further is the fact that Blacks are more likely than Whites to have low repeat versions of the androgen receptor gene. The androgen reception (AR) gene codes for a receptor by the same name which reacts to androgenic hormones such as testosterone. This receptor is a key part of the mechanism by which testosterone has its effects throughout the body and brain.
The rest of the article talks about CAG repeats and aggressive/criminal behavior, but it seems that whites have fewer CAG repeats than blacks.
Robert Lindsay
This one is much more basic, and tiring to rebut but I’ll do it anyway. Lindsay has a whole slew of articles on testosterone on his blog that show he doesn’t understand the hormone, but I’ll just talk about this one for now: Black Males and Testosterone: Evolution and Perspectives.
It was also confirmed by a recent British study (prostate cancer rates are somewhat lower in Black British men because a higher proportion of them have one White parent)
Jones and Chinegwundoh (2014) write: “Caution should be taken prior to the interpretation of these results due to a paucity of research in this area, limited accurate ethnicity data, and lack of age-specific standardisation for comparison. Cultural attitudes towards prostate cancer and health care in general may have a significant impact on these figures, combined with other clinico-pathological associations.”
This finding suggests that the factor(s) responsible for the difference in rates occurs, or first occurs, early in life. Black males are exposed to higher testosterone levels from the very start.
In a study of women in early pregnancy, Ross found that testosterone levels were 50% higher in Black women than in White women (MacIntosh 1997).
I used to believe this, but it’s much more nuanced than that. Black women don’t have higher levels of testosterone than white women (Mazur, 2016; and even then Lindsay fails to point out that this was pregnant women).
According to Ross, his findings are “very consistent with the role of androgens in prostate carcinogenesis and in explaining the racial/ethnic variations in risk” (MacIntosh 1997).
Testosterone has been hypothesized to play a role in the etiology of prostate cancer, because testosterone and its metabolite, dihydrotestosterone, are the principal trophic hormones that regulate growth and function of epithelial prostate tissue.
Testosterone doesn’t cause prostate cancer (Stattin et al, 2003; Michaud, Billups, and Partin, 2015). Diet explains any risk that may be there (Hayes et al, 1999; Gupta et al, 2009; Kheirandish and Chinegwundoh, 2011; Williams et al, 2012; Gathirua-Mingwai and Zhang, 2014). However in a small population-based study on blacks and whites from South Carolina, Sanderson et al (2017) “did not find marked differences in lifestyle factors associated with prostate cancer by race.”
Regular exercise, however, can decrease PCa incidence in black men (Moore et al, 2010). A lot of differences can be—albeit, not too largely— ameliorated by environmental interventions such as dieting and exercising.
Many studies have shown that young Black men have higher testosterone than young White men (Ellis & Nyborg 1992; Ross et al. 1992; Tsai et al. 2006).
Ellis and Nyborg (1992) found 3 percent difference. Ross et al (1992) have the same problem as Ross et al (1986), which used University students (~50) for their sample. They’re not representative of the population. Ross et al (1992) also write:
Samples were also collected between 1000 h and 1500 h to avoid confounding
by any diurnal variation in testosterone concentrations.
Testosterone levels should be measured near to 8 am. This has the same time variation too, so I don’t take this study seriously due to that confound. Assays were collected “between” the hours of 10 am and 3 pm, which means it was whenever convenient for the student. No controls on activities, nor attempting to assay at 8 am. People of any racial group could have gone at whatever time in that 5 hour time period and skew the results. Assaying “between” those times completely defeats the purpose of the study.
This advantage [the so-called testosterone advantage] then shrinks and eventually disappears at some point during the 30s (Gapstur et al., 2002).
Gapstur et al (2002) help my argument, not yours.
This makes it very difficult if not impossible to explain differing behavioral variables, including higher rates of crime and aggression, in Black males over the age of 33 on the basis of elevated testosterone levels.
See above where I talk about crime/testosterone/aggression.
Critics say that more recent studies done since the early 2000’s have shown no differences between Black and White testosterone levels. Perhaps they are referring to recent studies that show lower testosterone levels in adult Blacks than in adult Whites. This was the conclusion of one recent study (Alvergne et al. 2009) which found lower T levels in Senegalese men than in Western men. But these Senegalese men were 38.3 years old on average.
Alvergne, Fauri, and Raymond (2009) show that the differences are due to environmental factors:
This study investigated the relationship between mens’ salivary T and the trade-off between mating and parenting efforts in a polygynous population of agriculturists from rural Senegal. The men’s reproductive trade-offs were evaluated by recording (1) their pair-bonding/fatherhood status and (2) their behavioral profile in the allocation of parental care and their marital status (i.e. monogamously married; polygynously married).
They also controlled for age, so his statement “But these Senegalese men were 38.3 years old on average” is useless.
These critics may also be referring to various studies by Sabine Rohrmann which show no significance difference in T levels between Black and White Americans. Age is poorly controlled for in her studies.
That is one study out of many that I reference. Rohrmann et al (2007) controlled for age. I like how he literally only says “age is poorly controlled for in her studies“, because she did control for age.
That study found that more than 25% of the samples for adults between 30 and 39 years were positive for HSV-2. It is likely that those positive samples had been set aside, thus depleting the serum bank of male donors who were not only more polygamous but also more likely to have high T levels. This sample bias was probably worse for African American participants than for Euro-American participants.
Why would they use diseased samples? Do you even think?
Young Black males have higher levels of active testosterone than European and Asian males. Asian levels are about the same as Whites, but a study in Japan with young Japanese men suggested that the Japanese had lower activity of 5-alpha reductase than did U.S. Whites and Blacks (Ross et al 1992). This enzyme metabolizes testosterone into dihydrotestosterone, or DHT, which is at least eight to 10 times more potent than testosterone. So effectively, Asians have the lower testosterone levels than Blacks and Whites. In addition, androgen receptor sensitivity is highest in Black men, intermediate in Whites and lowest in Asians.
Wu et al (1995) show that Asians have the highest testosterone levels. Evidence is also mixed here as well. See above on AR sensitivity.
Ethnicmuse also showed that, contrary to popular belief, Asians have higher levels of testosterone than Africans who have higher levels of testosterone than Caucasians in his meta-analysis. (Here is his data.)
The Androgen Receptor and “masculinization”
Let us look at one study (Ross et al 1986) to see what the findings of a typical study looking for testosterone differences between races shows us. This study gives the results of assays of circulating steroid hormone levels in white and black college students in Los Angeles, CA. Mean testosterone levels in Blacks were 19% higher than in Whites, and free testosterone levels were 21% higher. Both these differences were statistically significant.
Assay times between 10 am and 3 pm, unrepresentative sample of college men, didn’t have control for waist circumference. Horribly study.
A 15% difference in circulating testosterone levels could readily explain a twofold difference in prostate cancer risk.
No, it wouldn’t (if it were true).
Higher testosterone levels are linked to violent behavior.
Causation not untangled.
Studies suggest that high testosterone lowers IQ (Ostatnikova et al 2007). Other findings suggest that increased androgen receptor sensitivity and higher sperm counts (markers for increased testosterone) are negatively correlated with intelligence when measured by speed of neuronal transmission and hence general intelligence (g) in a trade-off fashion (Manning 2007).
Who cares about correlations? Causes matter more. High testosterone doesn’t lower IQ. Racial differences in testosterone are tiring to talk about now, but there are still a few more articles I need to rebut.
Conclusion
Racial differences in testosterone don’t exist/are extremely small in magnitude (as I’ve covered countless times). The one article from TAH literally misrepresents studies/leaves out important figures in the testosterone differences between the two races to push a certain agenda. Though if you read the studies you see something completely different. It’s the same with Lindsay. He misunderstood a few studies to push his agenda about testosterone and crime and prostate cancer. They’re both wrong, though.
Why Testosterone Does Not Cause Crime
Testosterone and Aggressive Behavior
Race, Testosterone, and Prostate Cancer
Population variation in endocrine function—Race/History/Evolution Notes
Racial differences in testosterone are tiring to talk about now, but there are still a few more articles I need to rebut. People read and write about things they don’t understand, which is the cause of these misconceptions with the hormone, as well as, of course, misinterpreting studies. Learn about the hormone and you won’t fear it. It doesn’t cause crime, prostate cancer nor aggression; these people who write these articles have one idea in their head and they just go for it. They don’t understand the intricacies of the endocrine system and how sensitive it is to environmental influence. I will cover more articles that others have written on testosterone and aggression to point out what they got wrong.
Racial Differences in Jock Behavior: Implications for STI Prevalence and Deviance
1350 words
The Merriam-Webster dictionary defines jock as “a school or college athlete” and “a person devoted to a single pursuit or interest“. This term, as I previously wrote about, holds a lot of predictive power in terms of life success. What kind of racial differences can be found here? Like with a lot of life outcomes/predictors, there are racial differences and they are robust.
Male jocks get more sex, after controlling for age, race, SES and family cohesion. Being involved in sports is known to decrease sexual promiscuity, however, this effect did not hold for black American jocks, with the jock label being associated with higher levels of sexual promiscuity (Miller et al, 2005). Black American jocks reported significantly higher levels of sexual activity than non-black jocks, but they did not find that white jocks too fewer risks than their non-jock counterparts.
Black Americans do have a higher rate of STDs compathe average population (Laumann et al, 1999; Cavanaugh et al, 2010; CDC, 2015). Black females who are enrolled in, or have graduated from college had a higher STI (sexually transmitted infection) rate (12.4 percent self-reported; 13.4 percent assayed) than white women with less than a high school diploma (6.4 percent self-reported; 2.3 percent assayed) (Annang et al, 2010). I would assume that these black women would be more attracted to black male jocks and thusly would be more likely to acquire STIs since black males who self-identify as jocks are more sexually promiscuous. It seems that since black male jocks—both in high school and college—are more likely to be sexually promiscuous, this then has an effect on even the college-educated black females, since higher educational status has one less likely to acquire STIs.
Whites use the ‘jock identity’ in a sports context whereas blacks use the identity in terms of the body. Black jocks are more promiscuous and have more sex than white jocks, and I’d bet that black jocks have more STDs than white jocks since they are more likely to have sex than white jocks. Jock identity—but not athletic activity and school athlete status—was a better predictor of juvenile delinquency in a sample of 600 Western New York students, which was robust across gender and race (Miller et al, 2007a). Though, surprisingly, the ‘jock effect’ on crime was not as you would expect it: “The hypothesis that effects would be stronger for black adolescents than for their white counterparts, derived from the work of Stark et al. 1987 and Hughes and Coakley (1991), was not supported. In fact, the only clear race difference that did emerge showed a stronger effect of jock identity on major deviance for whites than for blacks” (Miller et al, 2007a).
Miller et al (2007b) found that the term jock means something different to black and white athletes. For whites, the term was associated with athletic ability and competition, whereas for blacks the term was associated with physical qualities. Whites, though, were more likely to self-identify with the label of jock than blacks (37 percent and 22 percent respectively). They also found that binge drinking predicted violence amongst family members, but in non-jocks only. The jock identity, for whites and not blacks, was also associated with more non-family violence while whites were more likely to use the aggression from sports in a non-sport context in comparison to blacks.
For black American boys, the jock label was a predictor of promiscuity but not for dating. For white American jocks, dating meant more than the jock label. Miller et al (2005) write:
We suggest that White male jocks may be more likely to be involved in a range of extracurricular status-building activities that translate into greater popularity overall, as indicated by more frequent dating; whereas African American male jocks may be “jocks” in a more narrow sense that does not translate as directly into overall dating popularity. Furthermore, it may be that White teens interpret being a “jock” in a sport context, whereas African American teens see it more in terms of relation to body (being strong, fit, or able to handle oneself physically). If so, then for Whites, being a jock would involve a degree of commitment to the “jock” risk-taking ethos, but also a degree of commitment to the conventionally approved norms with sanctioned sports involvement; whereas for African Americans, the latter commitment need not be adjunct to a jock identity.
It’s interesting to speculate on why whites would be more prone to risk-taking behavior than blacks. I would guess that it has something to do with their perception of themselves as athletes, leading to more aggressive behavior. Though certain personalities would be more likely to be athletic and thusly refer to themselves as a jock. The same would hold true for somatype as well.
So the term jock seems to mean different things for whites and blacks, and for whites, leads to more aggressive behavior in a non-sport context.
Black and females who self-identified as jocks reported lower grades whereas white females who self-identified as jocks reported higher grades than white females who did not self-report as jocks (Miller et al, 2006). Jocks also reported more misconduct such as skipping school, cutting class, being sent to the principals office, and parents having to go to the school for a disciplinary manner compared to non-jocks. Boys were more likely to engage in actions that required disciplinary intervention in comparison to girls, while boys were also more likely to skip school, have someone called from home and be sent to the principal’s office. Blacks, of course, reported lower grades than whites but there was no significant difference in misconduct by race. However, blacks reported fewer absences but more disciplinary action than whites, while blacks were less likely to cut class, but more likely to have someone called from home and slightly more likely to be sent to the principal’s office (Miller et al, 2006).
This study shows that the relationship between athletic ability and good outcomes is not as robust as believed. Athletes and jocks are also different; athletes are held in high regard in the eyes of the general public while jocks are seen as dumb and slow while also only being good at a particular sport and nothing else. Miller et al (2006) also state that this so-called ‘toxic jock effect‘ (Miller, 2009; Miller, 2011) is strongest for white boys. Some of these ‘effects’ are binge drinking and heavy drinking, bullying and violence, and sexual risk-taking. Though Miller et al (2006) say that, for this sample at least, “It may be that where academic performance is concerned, the jock label constitutes less of a departure from the norm for white boys than it does for female or black adolescents, thus weakening its negative impact on their educational outcomes.”
The correlation between athletic ability and jock identity was only .31, but significant for whites and not blacks (Miller et al, 2007b). They also found, contrary to other studies, that involvement in athletic programs did not deter minor and major adolescent crime. They also falsified the hypothesis that the ‘toxic jock effect’ (Miller, 2009; Miller, 2011) would be stronger for blacks than whites, since whites who self-identified as jocks were more likely to engage in delinquent behavior.
In sum, there are racial differences in ‘jock’ behavior, with blacks being more likely to be promiscuous while whites are more likely to engage in deviant behavior. Black women are more likely to have higher rates of STIs, and part of the reason is sexual activity with black males who self-identify as jocks, as they are more promiscuous than non-jocks. This could explain part of the difference in STI acquisition between blacks and whites. Miller et al argue to discontinue the use of the term ‘jock’ and they believe that if this occurs, deviant behavior will be curbed in white male populations that refer to themselves as ‘jocks’. I don’t know if that will be the case, but I don’t think there should be ‘word policing’, since people will end up using the term more anyway. Nevertheless, there are differences between race in terms of those that self-identify as jocks which will be explored more in the future.
