
Home » Posts tagged 'Racial Differences' (Page 5)
Tag Archives: Racial Differences
Why Are People Afraid of Testosterone?
1100 words
The answer to the question of why people are afraid of testosterone is very simple: they do not understand the hormone. People complain about birth rates and spermatogenesis, yet they believe that having high testosterone makes one a ‘savage’ who ‘cannot control their impulses’. However, if you knew anything about the hormone and how it’s vital to normal functioning then you would not say that.
I’ve covered why testosterone does not cause crime by looking at the diurnal variation in the hormone, showing that testosterone levels are highest at 8 am and lowest at 8 pm, while children commit the most crimes at 3 pm and adults at 10 pm. The diurnal variation is key: if testosterone truly did cause crime then rates of crime would be higher in both children and adults in the morning; yet, as can be seen with children, there are increases in amounts of violence committed when they enter school, go to recess, and exit school. This shows why those times are related to the spike in crime in children.
I have wrote a previous article citing a paper by Book et al (2001) in which they meta-analyzed testosterone studies and found that the correlation between testosterone and aggression was .14. However, that estimate is too high since they included 15 studies that should have not been included in the analysis. The true correlation is .08 (Archer, Graham-Kevan, and Davies, 2004). So, clearly, along with the fact that the diurnal variation in testosterone does not correlate with crime spikes, it shows that testosterone has no relationship to the cause of crime; it’s just always at the scene because it prepares the body to deal with a threat. That does not mean that testosterone itself causes crime.
One main reason people fear testosterone and believe that it causes crime and by extension aggressive behavior is because of racial crime disparities. According to the FBI, black Americans by and large commit the most crime, despite being 13 percent of the US population. And since it has been reported that blacks have higher levels of testosterone (Ross et al, 1986; Lynn, 1992; Rushton, 1997; Ellis, 2017), people believe that the supposed higher levels of testosterone that blacks, on average, have circulating in their blood is the ultimate cause of the crime disparities in America between races. Though see above to see why this is not the ultimate cause.
Blacks, contrary to popular belief, don’t have higher levels of testosterone (Gasper et al, 2006; Rohrrman et al, 2007; Lopez et al, 2013; Richard et al, 2014). Even if they did have higher levels, say the 13 percent that is often cited, it would not be the cause of higher rates of crime, nor the cause of higher rates of prostate cancer in blacks compared to whites. What does cause part of the crime differential, in my opinion, is honor culture (Mazur, 2016). The blacks-have-higher-testosterone canard was pushed by Rushton and Lynn to explain both higher rates of prostate cancer and crime in black Americans, however I have shown that high levels of testosterone do not cause prostate cancer (Stattin et al, 2003; Michaud, Billups, and Partin, 2015). Looking to testosterone as a ‘master switch’ as Rushton called it is the wrong thing to research because, clearly, the theories of Lynn, Rushton, and Ellis have been rebutted.
People are scared of testosterone because they do not understand the hormone. Indeed, people complain about lower birth rates and lower sperm counts, yet believe that having high testosterone will cause one to be a high T savage. This is seen in the misconception that injecting anabolic steroids causes higher levels of aggression. One study looked at the criminal histories of men who self-reported drug use and steroid use Lundholm et al (2014) who conclude: “We found a strong association between self-reported lifetime AAS use and violent offending in a population-based sample of more than 10,000 men aged 20-47 years. However, the association decreased substantially and lost statistical significance after adjusting for other substance abuse. This supports the notion that AAS use in the general population occurs as a component of polysubstance abuse, but argues against its purported role as a primary risk factor for interpersonal violence. Further, adjusting for potential individual-level confounders initially attenuated the association, but did not contribute to any substantial change after controlling for polysubstance abuse.“
The National Institute of Health (NIH) writes: “In summary, the extent to which steroid abuse contributes to violence and behavioral disorders is unknown. As with the health complications of steroid abuse, the prevalence of extreme cases of violence and behavioral disorders seems to be low, but it may be underreported or underrecognized.” We don’t know whether steroids cause aggression or more aggressive athletes are more likely to use the substance (Freberg, 2009: 424). Clearly, the claims of steroids causing aggressive behavior and crime are overblown and there has yet to be a scientific consensus on the matter. A great documentary on the matter is Bigger, Stronger, Faster, which goes through the myths of testosterone while chronicling the use of illicit drugs in bodybuilding and powerlifting.
People are scared of the hormone testosterone—and by extent anabolic steroids—because they believe the myths of the hulking, high T aggressive man that will fight at the drop of the hat. However, reality is much more nuanced than this simple view and psychosocial factors must also be taken into account. Testosterone is not the ‘master switch’ for crime, nor prostate cancer. This is very simply seen with the diurnal variation of the hormone as well as the peak hours for crime in adolescent and adult populations. The extremely low correlation with aggression and testosterone (.08) shows that aggression is mediated by numerous other variables other than testosterone, and that testosterone alone does not cause aggression, and by extension crime.
People fear things they don’t understand and if people were to truly understand the hormone, I’m sure that these myths pushed by people who are scared of the hormone will no longer persist. Low levels of testosterone are part of the cause of our fertility problems in the West. So does it seem logical to imply that high testosterone is for ‘savages’, when, clearly, high levels of testosterone are needed for spermatogenesis which, in turn, would mean a higher birth rate? Anyone who believes that testosterone causes aggression and crime and that the injection of anabolic steroids causes ‘roid rage’ should do some reading on how the production of the hormone in the body as well as the literature on anabolic steroids. If one wants birth rates to increase in the West, then they must also want testosterone levels to increase as well, since they are intimately linked.
Testosterone does not cause crime and there is no reason to fear the hormone.
Homo Neanderthalis vs. Homo Sapiens Sapiens: Who is Stronger? Implications for Racial Strength Differences
1300 words
Unfortunately, soft tissue does not fossilize (which is a problem for facial reconstructions of hominins; Stephan and Henneberg, 2001; I will cover the recent ‘reconstructions’ of Neanderthals and Nariokotome boy soon). So saying that Neanderthals had X percent of Y fiber type is only conjecture. However, to make inferences on who was stronger, I do not need such data. I only need to look at the morphology of the Neanderthals and Homo sapiens, and from there, inferences can be made as to who was stronger. I will argue that Neanderthals were stronger which is, of course, backed by solid data.
Neanderthals had wider pelves than Homo sapiens. Wider pelves in colder climes are due to adaptations. Although Neanderthals had wider pelves than ours, they had infants around the same size as Homo sapiens, which implies that Neanderthals had the same obstetric difficulties that we do. Neanderthals also had a pelvis that was similar to Heidelbergensis, however, most of the pelvic differences Neanderthals had that were thought to be derived traits are, in fact, ancestral traits—except for the cross-sectional shape of the pubic ramus (Gruss and Schmidt, 2015). Since Neanderthals had wider pelves and most of their pelvis were ancestral traits, then wide pelves may have been a trait of ancestral Homo (Trinkaus, Holliday, and Aurbach, 2014).
Hominins do need wider pelves in colder climates, as it is good for heat retention, however (see East Asians and Northern Europeans). Also, keep in mind that Neanderthals were shorter than us—with the men averaging around 5 feet five inches, and the women averaging about 5 feet, about 5.1 inches shorter than post-WW II Europeans (Helmuth, 1998).
So what does a wider pelvis mean? Since the Neanderthals were shorter than us and also had a wider pelvis, they had a lower center of gravity in comparison to us. Homo sapiens who came Out of Africa, had a narrower pelvis since narrow pelves are better to dissipate heat (Gruss and Schmidt, 2015). Homo sapiens would have been better adapted to endurance running and athleticism, in comparison to the wide-pelved Neanderthals.
People from tropical climates have longer limbs, and are tall and narrow (which is also good for endurance running/sprinting) while people from colder climates are shorter and more ‘compact’ (Lieberman, 2015: 113-114) with a wide pelvis for heat retention (Gruss and Schmidt, 2015). So, clearly, due to the differences in pelvic anatomy between Homo sapiens and Neanderthals,
Furthermore, due to the length of Neanderthal clavicles, it was thought that they had long clavicles which would have impeded strength. However, when the clavicles were reanalyzed it was discovered that when the clavicles were adjusted with the body size of Neanderthals—and not compared with the humeral lengths—Neanderthals had a similar clavicular length, which implies a similar shoulder breadth as well, to Homo sapiens (Trinkaus, Holliday, and Aurbach, 2014). This is another clue that Neanderthals were stronger.
Yet more evidence comes from comparing the bone density of Neanderthal bones to that of Homo sapiens. Denser bones would imply that the body would be able to handle a heavier load, and thusly generate more power. In adolescent humans, muscle power predicts bone strength (Janz et al, 2016). So if the same holds true for Neanderthals—and I don’t see why not—then Neanderthals would have higher muscle power since it predicts bone strength.
Given the “heavy musculature” of Neanderthals, along with high bone robusticity, then they must have had denser bones than Homo sapiens (Friedlander and Jordan, 1994). So since Neanderthals had denser bones, then they had higher muscle power; they had a lower center of gravity due to having a wider pelvis and being shorter than Homo sapiens whose body was heat-adapted. Putting this all together, the picture is now becoming clearer that Neanderthals were, in fact, way stronger than Homo sapiens.
Another cause for these anatomical differences between Neanderthals and Homo sapiens is completely independent of cold weather. Neanderthals had an enlarged thorax (rib cage), which evolved to hold an enlarged liver, which is responsible for metabolizing large amounts of protein. Since protein has the highest thermic effect of food (TEF), then they would have had a higher metabolism due to a higher protein diet which would also have resulted in an enlarged bladder and kidneys which are necessary to remove urea, which possibly would have also contributed to a wider pelvis for Neanderthals (Ben-Dor, Gopher, and Barkai, 2016).
During glacial winters, Neanderthals would have consumed 74-85 percent of their calories from fat, with the rest coming from protein (Ben-Dor, Gopher, and Barkai, 2016). Neanderthals also consumed around 3,360-4,480 kcal per day (Steegman, Cerny, and Holliday, 2002). Let’s assume that Neanderthals averaged 3800 kcal per day. Since the upper limit of protein intake is 3.9 g/bw/day (erectus) and 4.0 g/bw/day for Homo sapiens (Ben-Dor et al, 2011), then Neanderthals would have had a theoretical higher upper limit due to having larger organs, which are useful in processing large amounts of protein. The protein intake for a Neanderthal male was between estimated to be between 985 kcal (low end) to 1170 kcal (high end). It was estimated that Neanderthal males had a protein intake of about 292 grams per day, or 1,170 kcal (Ben-Dor, Gopher, and Holliday, 2016: 370).
Assuming that Neanderthals did not eat carbohydrates during glacial winters (and even if a small amount were eaten, the model would not be affected) and an upper limit of protein intake of 300 grams per day for Neanderthal males, this implies that 74-85 percent of their diet came from animal fat—the rest being protein. Protein is the most thermogenic macro (Corvelli et al, 1997; Eisenstein et al, 2002; Buchholz and Schoeller, 2004; Halton and Hu, 2004; Gillingham et al, 2007; Binns, Grey, and Di Brezzo, 2014). So since Neanderthals ate a large amount of protein, along with their daily activities, they had to have had a high metabolic rate.
To put into perspective how much protein Neanderthals ate, the average American man eats about 100 grams of protein per day. In an analysis of the protein intake of Americans from 2003-2004, it was found that young children ate about 56 grams of protein per day, adults aged 19-30 ate about 91 grams of protein per day, and the elderly ate about 56 grams of protein per day (Fulgoni, 2008). Neanderthals ate about 3 times the amount of protein than we do, which would lead to organ enlargement since larger organs are needed to metabolize said protein as well. Another factor in the increase of metabolism for Neanderthals was the fact that it was, largely, extremely cold. Shivering increases metabolism (Tikuisis, Bell, and Jacobs, 1985; van Ooijen et al, 2005). So the Neanderthal metabolism would have been revved up close to a theoretical maximum capacity.
The high protein intake of Neanderthals is important because high amounts of protein are needed to build muscle. Neanderthals consumed a sufficient amount of kcal, along with 300 grams of protein per day on average for a Neanderthal male, which would have given Neanderthals yet another strength advantage.
I am also assuming that Neanderthals had slow twitch muscle fibers since they have wider pelves, along with evolving in higher latitudes (see Kenyans, East Asians, European muscle fiber distribution), they would have an abundance of type slow twitch muscle fibers, in comparison to fast twitch muscle fibers, however, they also have more slow twitch fibers which Europeans have, while African-Americans (West-African descendants) have a higher amount of fast twitch fibers. (Caesar and Henry, 2015). So now, thinking of everything I explained above and replacing Neanderthals with Europeans and Homo sapiens with Africans, who do you think would be stronger? Clearly, Europeans, which is what I have argued for extensively. African morphology (tall, lanky, high limb ratio) is not conducive to strength; whereas European morphology (wide pelvis, low limb ratio, an abundance of slow twitch fibers) is.
The implications for these anatomic differences between Neanderthals and Homo sapiens and how it translates into racial differences will be explored more in the future. This was just to lay the anatomic and morphologic groundwork in regards to strength and cold weather adaptations. Nevertheless, the evidence that Neanderthals were stronger/more powerful than Europeans stands on solid ground, and the same does hold for the differences in strength between Africans and Europeans. The evolution of racial pelvic variation is extremely important to understand if you want to understand racial differences in sports.
The ENA Theory: On Testosterone and Aggressive Behavior by Race/Ethnicity
3250 words
A commenter by the name of bbloggz alerted me to a new paper by Lee Ellis published this year titled Race/ethnicity and criminal behavior: Neurohormonal influences in which Ellis (2017) proposed his theory of ENA (evolutionary neuroandrogenic theory) and applied it to racial/ethnic differences in crime. On the face, his theory is solid and it has great explanatory power for the differences in crime rates between men and women, however, there are numerous holes in the application of the theory in regards to racial/ethnic differences in crime.
In part I, he talks about racial differences in crime. No one denies that, so on to part II.
In part II he talks about environmental causes for the racial discrepancies, that include economic racial disparities, racism and societal discrimination and subordination, a subculture of violence (I’ve been entertaining the honor culture hypothesis for a few months; Mazur (2016) drives a hard argument showing that similarly aged blacks with some college had lower levels of testosterone than blacks with less than high school education which fits the hypothesis of honor culture. Though Ellis’ ENA theory may account for this, I will address this below). However, if the environment that increases testosterone is ameliorated (i.e., honor culture environments), then there should be a subsequent decrease in testosterone and crime, although I do believe that testosterone has an extremely weak association with crime, nowhere near high enough to account for racial differences in crime, the culture of honor could explain a good amount of the crime gap between blacks and whites.
Ellis also speaks about the general stress/strain explanation, stating that blacks have higher rates of self-esteem and Asians the lowest, with that mirroring their crime rates. This could be seen as yet another case for the culture of honor in that blacks with a high self-esteem would feel the need to protect their ‘name’ or whatever the case may be and feel the need for physical altercation based on their culture.
In part III, Ellis then describes his ENA theory, which I don’t disagree with on its face as it’s a great theory with good explanatory power but there are some pretty large holes that he rightly addresses. He states that, as I have argued in the past, females selected men for higher rates of testosterone and that high rates of testosterone masculinize the brain, changing it from its ‘default feminine state’ and that the more androgens the brain is exposed to, the more likely it is for that individual to commit crime.
Strength
Ellis cites a study by Goodpaster et al (2006) in which he measured the races on the isokinetic dynamometry, pretty much a leg extension. However, one huge confound is that participants who did not return for follow-up were more likely to be black, obese and had more chronic disease (something that I have noted before in an article on racial grip strength). I really hate these study designs, but alas, it’s the best we have to go off of and there are a lot of holes in them that must be addressed. Though I applaud the researchers’ use of the DXA scan (regular readers may recall my criticisms on using calipers to assess body fat in the bench press study, which was highly flawed itself; Boyce et al, 2014) to assess body fat as it is the gold standard in the field.
Ellis (2017: 40) writes: “as brain exposure to testosterone surges at puberty, the prenatally-programmed motivation to strive for resources, status, and mating opportunities will begin to fully activate.” This is true on the face, however as I have noted the correlation between physical aggression and testosterone although positive is low at .14 (Archer, 1991; Book et al, 2001). Testosterone, as I have extensively documented, does cause social dominance and confidence which do not lead to aggression. However, when other factors are coupled with high testosterone (as noted by Mazur, 2016), high rates of crime may occur and this may explain why blacks commit crime; a mix of low IQ, high testosterone and low educational achievement making a life of crime ‘the smart way’ to live seeing as, as Ellis points out, and that intelligent individuals find legal ways to get resources while less intelligent individuals use illegal ways.
ENA theory may explain racial differences in crime
In part IV he attempts to show how his ENA theory may explain racial differences in crime—with testosterone sitting at the top of his pyramid. However, there are numerous erroneous assumptions and he does rightly point out that more research needs to be done on most of these variables and does not draw any conclusions that are not warranted based on the data he does cite. He cites one study in which testosterone levels were measured in the amniotic fluid of the fetus. The sample was 59 percent white and due to this, the researchers lumped blacks, ‘Hispanics’ and Native Americans together which showed no significant difference in prenatal testosterone levels (Martel and Roberts, 2014).
Umbilical cord and testosterone exposure
Ellis then talks about testosterone in the umbilical cord, and if the babe is exposed to higher levels of testosterone in vitro, then this should account for racial/ethnic differences in crime. However, the study he cited (Argus-Collins et al, 2012) showed no difference in testosterone in the umbilical cord while Rohrmann et al (2009) found no difference in testosterone between blacks and whites but found higher rates of SHBG (sex hormone-binding globulin) which binds to testosterone and makes it unable to leave the blood which largely makes testosterone unable to affect organ development. Thusly, if the finding of higher levels of SHBG in black babes is true, then they would be exposed to less androgenic hormones such as testosterone which, again, goes against the ENA theory.
He also cites two more studies showing that Asian babes have higher levels of umbilical cord testosterone than whites (Chinese babes were tested) (Lagiou et al, 2011; Troisi et al, 2008). This, again, goes against his theory as he rightly noted.
Circulating testosterone
Next he talks about circulating differences in testosterone between blacks and whites. He rightly notes that testosterone must be assayed in the morning within an hour after waking as that’s when levels will be highest, yet cites Ross et al (1986) where assay times were all over the place and thusly testosterone cannot be said to be higher in blacks and whites based on that study and should be discarded when talking about racial differences in testosterone due to assay time being between 10 am and 3 pm. He also cites his study on testosterone differences (Eliss and Nyborg, 1993), but, however, just as Ross et al (1986) did not have a control for WC (waist circumference) Ellis and Nyborg (1993) did not either, so just like the other study that gets cited to show that there is a racial difference in testosterone, they are pretty hugely flawed and should not be used in discussion when discussing racial differences in testosterone. Why do I not see these types of critiques for Ross et al (1986) in major papers? It troubles me…
He also seems to complain that Lopez et al (2013) controlled for physical activity (which increases testosterone) and percent body fat (which, at high levels, decreases testosterone). These variables, as I have noted, need to be controlled for. Testosterone varies and fluctuated by age; WC and BMI vary and fluctuate by age. So how does it make sense to control for one variable that has hormone levels fluctuate by age and not another? Ellis also cites studies showing that older East Asian men had higher levels of testosterone (Wu et al, 1995). Nevertheless, there is no consensus; some studies show Chinese babes have higher levels of testosterone than whites and some studies show that whites babes have higher levels of testosterone than Chinese babes. Indeed, this meta-analysis by Ethnicmuse shows that Asians have the highest levels, followed by Africans then Europeans, so this needs to be explained to save the theory that testosterone is the cause of black overrepresentation of violence (as well as what I showed that testosterone is important for vital functioning and is not the boogeyman the media makes it out to be).
Bone density and crime
Nevertheless, the next variable Ellis talks about is bone density and its relationship to crime. Some studies find that blacks are taller than whites while other show no difference. Whites are also substantially taller than Asian males. Blacks have greater bone density than the other three races, but according to Ellis, this measure has not been shown to have a relationship to crime as of yet.
Penis size, race and crime
Now on to penis size. In two articles, I have shown that there is no evidence for the assertion that blacks have larger penises than whites. However, states that penis length was associated with higher levels of testosterone in Egyptian babes. He states that self-reported penis size correlates with self-reports of violent delinquency (Ellis and Das, 2012). Ellis’ main citations for the claim that blacks have larger penises than other races comes from Nobile (1982), the Kinsey report, and Rushton and Boagert (1987) (see here for a critique of Rushton and Boagert, 1987), though he does cite a study stating that blacks had a longer penis than whites (blacks averaging 5.77 inches while whites averaged 5.53 inches). An HBDer may go “Ahah! Evidence for Rushton’s theory!”, yet they should note that the difference is not statistically significant; just because there is a small difference in one study also doesn’t mean anything for the totality of evidence on penis size and race—that there is no statistical difference!
He then cites Lynn’s (2013) paper which was based on an Internet survey and thus, self-reports are over-measured. He also cites Templer’s (2002) book Is Size Important?, which, of course, is on my list of books to read. Nevertheless, the ‘evidence’ that blacks average larger penises than whites is extremely dubious, it’s pretty conclusive that the races don’t differ in penis size. For further reading, read The Pseudoscience of Race Differences in Penis Size, and read all of Ethnicmuses’ posts on penis size here. It’s conclusive that there is no statistical difference—if that—and any studies showing a difference are horribly flawed.
2d/4d ratio and race
Then he talks about 2d/4d ratio, which supposedly signifies higher levels of androgen exposure in vitro (Manning et al, 2008) however these results have been challenged and have not been replicated (Koehler, Simmons, and Rhodes, 2004; Yan et al, 2008, Medland et al, 2010). Even then, Ellis states that in a large analysis of 250,000 respondents, Asians had the lowest 2d/4d ratio, which if the hypothesis of in vitro hormones affecting digit length is to be believed, they have higher levels of testosterone than whites (the other samples had small ns, around 100).
Prostate-specific antigens, race, and prostate cancer
He then talks about PSA (prostate-specific antigen) rates between the races. Blacks are two times more likely to get prostate cancer, which has been blamed on testosterone. However, I’ve compiled good evidence that the difference comes down to the environment, i.e., diet. Even then, there is no evidence that testosterone causes prostate cancer as seen in two large meta-analyses (Stattin et al, 2003; Michaud, Billups, and Partin, 2015). Even then, rates of PCa (prostate cancer) are on the rise in East Asia (Kimura, 2012; Chen et al, 2015; Zhu et al, 2015) which is due to the introduction of our Western diet. I will cover the increases in PCa rates in East Asia in a future article.
CAG repeats
He then reviews the evidence of CAG repeats. There is, however, no evidence that the number of CAG repeats influences sensitivity to testosterone. However, intra-racially, lower amounts of CAG repeats are associated with higher spermatozoa counts—but blacks don’t have higher levels of spermatozoa (Mendiola et al, 2011; Redmon et al, 2013). Blacks do have shorter CAG repeats, and this is consistent with the racial crime gap of blacks > whites > Asians. However, looking at the whole of the evidence, there is no good reason to assume that this has an effect on racial crime rates.
Intelligence and education
Next he talks about racial differences in intelligence and education, which have been well-established. Blacks did have higher rates of learning disabilities than whites who had higher levels of learning disabilities then Asians in a few studies, but other studies show whites and South Asians having different rates, for instance. He then talks about brain size and criminality, stating that the head size of males convicted for violent crimes did not differ from males who committed non-violent crimes (Ikaheimo et al, 2007). I won’t bore anyone with talking about what we know already: that the races differ in average brain size. However, a link between brain size and criminality—to the best of my knowledge—has yet to been discovered. IQ is implicated in crime, so I do assume that brain size is as well (no matter if the correlation is .24 or not; Pietschnig et al, 2015).
Prenatal androgen exposure
Now to wrap things up, the races don’t differ in prenatal androgen exposure, which is critical to the ENA theory; there is a small difference in the umbilical cord favoring blacks, and apparently, that predicts a high rate of crime. However, as noted, blacks have higher levels of SHBG at birth which inhibits the production of testosterone on the organs. Differences in post-pubertal testosterone are small/nonexistent and one should not talk about them when talking about differences in crime or disease acquisition such as PCa. DHT only shows a weak positive correlation with aggression—the same as testosterone (Christiansen and Winkler, 1992; however other studies show that DHT is negatively correlated with measures of physical aggression; Christiansen and Krussmann, 1987; further, DHT is not so evil after all).
Summing it all up
Blacks are not stronger than whites, indeed evidence from the races’ differing somatype, grip strength and leverages all have to do with muscular strength. Furthermore, the study that Ellis cites as ‘proof’ that blacks are stronger than whites is on one measure; an isokinetic dynamometry machine which is pretty much a leg extension. In true tests of strength, whites blow blacks away, which is seen in all major professional competitions all around the world. Blacks do have denser bones which is due to androgen production in vitro, but as of yet, there has been no research done into bone density and criminality.
The races don’t differ on penis size—and if they do it’s by tenths of an inch which is not statisitcally significant and I won’t waste my time addressing it. It seems that most HBDers will see a racial difference of .01 and say “SEE! Rushton’s Rule!” even when it’s just that, a small non-significant difference in said variable. That’s something I’ve encountered a lot in the past and it’s, frankly, a waste of time to converse about things that are not statistically significant. I’ve also rebutted the theory on 2d/4d ration as well. Finally, Asians had a similar level of androgen levels compared to blacks, with whites having the least amount. Along with a hole in the theory for racial differences in androgen causing crime, it’s yet another hole in the theory for racial differences in androgens causing racial differences in penis size and prostate cancer.
On intelligence scores, no one denies that blacks have scored about 1 SD lower than whites for 100 years, no one denies that blacks have a lower educational attainment. In regards to learning disabilities, blacks seem to have the highest rates, followed by Native Americans, than non-Hispanic whites, East Asians and the lowest rates found in South Asians. He states only one study links brain size to criminal behavior and it showed a significant inverse relationship with crime but not other types of offenses.
This is a really good article and I like the theory, but it’s full of huge holes. Most of the variables described by Ellis have been shown to not vary at all or much between the races (re: penis size, testosterone, strength [whites are stronger] prostate cancer caused mainly by diet, 2d/4d ratio [no evidence of it showing a digit ratio difference], and bone density not being studied). Nevertheless, a few of his statements do await testing so I await future studies on the matter. He says that androgen exposure ‘differs by race and ethnicity’, yet the totality of evidence shows ‘not really’ so that cannot be the cause of higher amounts of crime. Ellis talks about a lot of correlates with testosterone, but they do not pass the smell test. Most of it has been rebutted. In fact, one of the central tenets of the ENA theory is that the races should differ in 2d/4d ratio due to exposure of differing levels of the hormone in vitro. Alas, the evidence to date has not shown this—it has in fact shown the opposite.
ENA theory is good in thought, but it really leaves a lot to be desired in regards to explaining racial differences in crime. More research needs to be looked into in regards to intelligence and education and its effect on crime. We can say that low IQ people are more likely to drop out of school and that is why education is related to crime. However, in Mazur (2016) shows that blacks matched for age had lower levels of testosterone if they had some college under their belt. This seems to point in the direction of the ENA theory, however then all of the above problems with the theory still need to be explained away—and they can’t! Furthermore, one of the nails in the coffin should be this: East Asian males are found to have higher levels of testosterone than white males, often enough, and East Asian males actually have the lowest rate of crime in the worle!
This seems to point in the direction of the ENA theory, however then all of the above problems with the theory still need to be explained away—and they can’t! Furthermore, one of the nails in the coffin should be this: East Asian males are found to have higher levels of testosterone than white males, often enough, and East Asian males actually have some of the lowest rate of crime in the world (Rushton, 1995)! So this is something that needs to be explained if it is to be shown that testosterone facilitates aggression and therefore, crime.
Conclusion
I’ve shown—extensively—that there is a low positive correlation between testosterone and physical aggression, why testosterone does not cause crime, and have definitively shown that, by showing how flawed the other studies are that purport to show blacks have higher testosterone levels than whites, along with citing large-scale meta-analyses, that whites and blacks either do not differ or the differences is small to explain any so-called differences in disease acquisition or crime. One final statement on the CAG repeats, they are effect by obesity, men who had shorter CAG repeats were more likely to be overweight, which would skew readings (Gustafsen, Wen, and Koppanati, 2003). So depending on the study—and in most of the studies I cite whites have a higher BMI than blacks—BMI and WC should be controlled for due to the depression of testosterone.
It’s pretty conclusive that testosterone itself does not cause crime. Most of the examples cited by Ellis have been definitively refuted, and his other claims lack evidence at the moment. Even then, his theory rests on the 2d/4d ratio and how blacks may have a lower 2d/4d ratio than whites. However, I’ve shown that there is no significant relationship between 2d/4d ratio and traits mediated by testosterone (Kohler, Simmons, and Rhodes, 2004) so that should be enough to put the theory to bed for good.
Why Testosterone Does Not Cause Crime
1900 words
Edit: (The correlation between aggression and testosterone isn’t .14 as Book et al (2001) state; the true correlation is .08 (Archer, Graham-Kevan and Davies, 2005) So it’s even lower than I thought. This is one of the many reasons why testosterone does not cause crime. It’s just feminist bullshit and fear mongering from people who do not understand the hormone and what it does in the body. The misconceptions come from Rushton’s r/K selection bullshit which has been summarily refuted.)
Recently, I’ve written at length on racial differences in testosterone and how the correlation between testosterone and physical aggression is .14. Pitifully low to account for the cause of crime and any overall differences in racial crime (that will be touched on at length in the future). Tonight I will show, yet again, why testosterone does not cause crime by looking at what times most crimes are committed by both adults and children under the age of 18. This will definitively put the ‘testosterone causes crime’ myth to bed for good.
Before I get into the time of day that most crimes are committed, I must talk about the production of testosterone in the body. There are no ‘genes for’ testosterone (although men who had three certain alleles had a 6.5 fold higher risk of having low testosterone; Ohlsson et al, 2011, I am unaware of there being a variation by race; over 10,000 Caucasian men were studied). There is, however, an indirect control of testosterone synthesis by DNA. DNA regulates the production of testosterone by coding for enzymes that convert cholesterol to testosterone (testosterone is a cholesterol-based hormone).
There are five simple steps to the production of testosterone: 1) DNA codes for mRNA; 2) mRNA codes for the synthesis of an enzyme in the cytoplasm; 3) luteinizing hormone stimulates the production of another messenger in the cell when testosterone is needed; 4) this second messenger activates the enzyme; 5) the enzyme then converts cholesterol to testosterone (Leydig cells produce testosterone in the presence of luteinizing hormone). That’s how testosterone is produced in the body. It is indirectly controlled by DNA.

Above is a graph from the Office of Juvenile Justice and Delinquency Prevention which shows the time of day that most crimes are committed. Notice how crime goes up as the time of day goes on and since kids are at school, they’re more likely to fight. This then peaks at 3 pm when kids are getting out of school.
Now look at rates of crime for adults. At its peak of 10 pm, it’s vastly lower than that of people under the age of 18, which is important to keep in mind. You can see how at 8 am that rates of crime are low for adults and high for kids, right when they would be entering school so there would be a lot of other kids around and the chance for violence goes up. Keep the times of 8 am (kids when they enter school), 12 pm (when most kids go on lunch) and 3 pm (when most kids get out of school) along with the hours of 12 pm to 8 pm for adults (when 74 percent of crimes are committed by adults).
- In general, the number of violent crimes committed by adults increases hourly from 6 a.m. through the afternoon and evening hours, peaks at 10 p.m., and then drops to a low point at 6 a.m. In contrast, violent crimes by juveniles peak in the afternoon between 3 p.m. and 4 p.m., the hour at the end of the school day.
- Nearly one-third (29%) of all violent crime committed by juvenile offenders occurs between 3 p.m. and 7 p.m. In comparison, 26% of all violent committed by adult offenders occurs between 8 p.m. and 12 p.m.
So since testosterone varies by day and levels are highest at 8 am and lowest at 8 pm (Brambilla et al, 2009; however testing men aged 45 years of age and older is fine before 2 pm due to a blunted circadian rhythm; Long, Nguyen, and Stevermer, 2015), then how could testosterone account for why men commit most of their crimes at night and why the crime that children commit spikes when they go to school, go to lunch and get out of school? The answer is that it doesn’t because testosterone does not cause crime. What testosterone does cause, however, are feelings of confidence and dominance, which does not—surprisingly—lead to increased aggression and assault on others (Booth et al, 2006).
What testosterone does cause, however, is social dominance and success, not physical aggression and maladjustment (Shcaal et al, 1996). The effects of environment are also more notable on testosterone than are genetics at 5 months of age (Carmaschi et al, 2010). Furthermore, aggressive behavior is first noticed in infancy and reaches its peak before school age (Tremblay et al, 2004; Cote et al, 2006). Though testosterone does seem to have an effect on aggression in preschool boys, however genetic and environmental causality has not been established (Sanchez-Martin et al, 2000).
Nevertheless, the meta-analyses I cited last week show that testosterone has an extremely low correlation of .14, so other factors must be at play. However, Sanchez-Martin et al (2000:778-779) also note that “Tremblay et al (1998) suggested that associations between testosterone titer and physical aggression are likely to be observed in contexts where such attack leads to social dominance. This may be true of the preschool boys in the present study. The data generated in the present study generally support Scerbo and Kolko (1994), who studied older children (7 to 14 years of age). They found a significant relationship between testosterone levels and aggression (as assessed by clinical staff).”
It’s interesting to note that in the case of Scerbo and Kolko (1994) that after controlling for age and size, testosterone correlated with aggression when rated by staff but not parents or teachers. ‘Staff’ refers to clinic staff at a facility where the children were assessed for hyperactivity disorders. Of course, the staff would rate higher levels of aggression compared to parents of teachers—people who are around the children every day—since they would want a higher chance for diagnosis for certain drugs to ‘cure’ the hyperactivity, but I digress. Testosterone does not induce aggression in children, but it does induce social dominance and confidence which does not lead to aggression (Rowe et al, 2004; Booth et al, 2006).
There was also little difference in testosterone between socially dominant prisoners and aggressive prisoners (Ehrenkraz, Bliss, and Sheard, 1974). Furthermore, the testosterone increase leading to pubertal development in boys is not associated with increased aggression (Tremblay et al, 1998; Booth et al, 2006: 171). Indeed, increased body size is a marker for physical aggression in children, and I doubt these children have high muscle mass so, I assume, they have high levels of body fat and thusly lower levels of testosterone than they would have if they were leaner. Yet another strike against the ‘testosterone causes crime/physical aggression’ hypothesis.
Indeed, this has some implications for the honor culture hypothesis of why low-income blacks have higher levels of testosterone than similarly aged blacks with some college (Mazur, 2016). The patterns for crime as shown by the OOJDP shows that crime rises as the day progresses from the morning until its peak at 3 pm for children and then sharply declines while for adults it peaks at 10 pm.
Testosterone does increase when a challenge is issued; when one man feels his reputation is threatened, the propensity for violence is increased, but this was most notably seen in Southern men (Cohen et al, 1996). So the same would be said for this ‘culture of honor’ found in low-income black neighborhoods, the so-called ‘code of the street’ as stated by Anderson (1994: 88): “Moreover, if a person is assaulted, it is important, not only in the eyes of his opponent but in the eyes of his “running buddies,” for him to avenge himself. Otherwise, he risks being “tried” (challenged) or “moved on” by any number of others. To maintain his honor, he must show he is not someone to be “messed with” or “dissed.””
This culture of honor is found all over the world, including Brazil where homicide can be explained by the need to maintain honor and can be understood by taking into account cultural factors; biological, psychological and socioeconomic factors do not explain murder in Northeast Brazil as well as honor and culture (de Souza et al, 2015). People in honor cultures also have a higher chance of self-harm (Osterman and Brown, 2011) as well as a higher chance of committing violence in school (Brown, Osterman, and Barnes, 2009).
Testosterone does not cause crime; it does not cause aggression. Increases in testosterone before, during and after events are a physiologic process to prime the body for competition. As cited above, dominant behavior does not necessarily lead to violence in most cases, which may be surprising for some. Indeed, honor and culture may explain a nice amount of the homicide and violence rate in the South. Since testosterone is highest at 8 am and lowest at 8 pm and the rates of crime committed by adults and children are vastly different than the diurnal variance in the day, then testosterone does not cause crime and its increase is not associated with crime, but social dominance and confidence which does not lead to crime.
Hopefully—if anyone still believes testosterone to be the boogeyman its made out to be—I’ve put those misconceptions to rest. Racial differences in testosterone cannot be the cause of racial differences in crime—because there is either no statistical difference in testosterone between the races or the difference is non-existent. Testosterone is clearly a beneficial hormone—as I have extensively documented. Misunderstandings of the hormone are abound—especially in the HBD sphere—only due to literally a few paragraphs in a book (Rushton, 1997) and one study that showed blacks have higher testosterone than whites which was the cause of their higher rates of prostate cancer (Ross et al, 1986). The study is hard to find so I had to buy access to it. I will cover this in the future, but I discovered that they assayed the subjects when it was convenient for them—between the hours of 10 am and 3 pm—which is unacceptable. You cannot gauge racial differences in testosterone from a small study (n=50) and a non-representative sample (college students). For these reasons, the study should be thrown in the trash—especially when formulating evolutionary hypotheses.
Testosterone is one of the most important hormones for vital functioning. By knowing how it is processed in the body and that there are no ‘genes for’ testosterone (‘low testosterone genes’ notwithstanding) along with how testosterone has a low relationship with physical aggression one should not be scared of having high levels, on the contrary, one should be scared of having low levels. I have once again proven my case that testosterone is not related to violence in showing the diurnal variation in testosterone levels in adults, as well as the time of day that crimes are committed by both adults and children. High testosterone means high confidence and high dominance—and those two traits have a lot to do with masculinity—which do not lead to violence.
I know why testosterone does not cause crime—because I have an understanding of the hormone, how its produced in the body and what its effects on the body are. The most important thing to note here, is that even if blacks had 15 percent higher testosterone than whites, it still wouldn’t explain higher rates of crime or disease such as prostate cancer. So those who try so hard to prove that blacks have higher levels of the hormone do so in vain, because even if they did it wouldn’t mean anything for any theories they may have. The myth of testosterone causing aggression and crime need to be put to bed for good.
Testosterone and Aggressive Behavior
1200 words
Testosterone gets a bad rep. People assume that if one has higher testosterone than average, that they will be a savage, bloodthirsty beast with an insatiable thirst for blood. This, however, is not the case. I’ve documented how testosterone is vital for male functioning, and how higher levels don’t lead to maladies such as prostate cancer. Testosterone is feared for no reason at all. The reason that people are scared of it is that of the anecdotal reports that individual A had higher testosterone when he committed crime B so, therefore, anyone who commits a crime has higher testosterone and that is the ultimate—not proximate—cause of crime. This is erroneous. There is a positive—albeit extremely low—correlation between physical aggression and violence at .14. That’s it. Furthermore, most of these claims of higher levels of testosterone causing violence is extrapolated from animal studies to humans.
Testosterone has been shown to lead to violent and aggressive behavior, largely only in animal studies (Archer, 1991; Book et al, 2001). For years, the relationship between the two variables was thought to be causal, i.e., high levels of testosterone cause violent crimes, which has been called into question over recent years. This is due to how the environment can raise testosterone levels. I have documented how these environmental factors can raise testosterone—and after these events, testosterone stays elevated.
Largely, animal studies are used to infer that high levels of testosterone in and of themselves lead to higher rates of aggression and therefore crime. However, two important meta-analyses show this is not necessarily the case (Archer, 1991; Book et al, 2001). Book et al, 2001 showed that two variables were important in seeing the relationship between aggression and crime—the time of day that the assay was taken and the age of the participant. This effect was seen to be largest in, not unexpectedly, males aged 13-20 (Book et al, 2001: 594). So since age confounds the relationship between aggression and testosterone in males, that is a variable that must also be controlled for (which, in the meta-analyses and other papers I cite on black and white testosterone is controlled for).
More interestingly, Book et al (2001) showed that the nature of the measure of aggression (self-reported or behavioral) did not have any effect on the relationship between testosterone and aggression. Since there is no difference between the two measures, then a pencil-and-paper test is a good enough index of measure of aggression, comparable to observing the behavior of the individual studied.
Archer (1991) also showed the same low—but positive—correlations between aggression and testosterone. Of course, as I’ve extensively documented since there is a positive relationship between the two variables does not necessarily mean that high-testosterone men commit more crime—since the outcome of certain situations can increase and decrease testosterone, no causal factors have been detangled. Book et al (2001) confirmed Archer’s (1991) finding that the correlation between violent and aggressive behavior was positive and low at .14.
Valois et al (2017) showed there was a relationship between emotional self-efficacy (ESE) and aggressive and violent behaviors in a statewide sample of high school children in South Carolina (n=3,386). Their results suggested that there was a relationship between carrying a weapon to school within the past 30 days along with being injured with a club, knife or gun in the past 12 months was significantly associated with ESE for specific race and sex groups.
Black girls who reported a low ESE reported carrying a weapon to school 30 days prior to the survey were 3.22 times more than black girls with a high ESE who did not report carrying a weapon to school within the past 30 days prior to the questionnaire. For black boys with low ESE, they were 3.07 times more likely to carry a weapon to school within the past 30 days in comparison to black boys with high ESE who did not carry a weapon to school in the past 30 days. White girls who reported low ESE had the highest chance of bringing a weapon to school in comparison to white girls with low ESE—they were 5.87 times more likely to carry a weapon to school 30 days prior to the survey. Finally, white boys with low ESE were slightly more than 2 times more likely than white boys with high ESE to carry a weapon to school 30 days prior to the survey.
Low ESE in white and black girls is associated with carrying a weapon to school, whereas low ESE for white and black boys is associated with being threatened. Further, their results suggested that carrying a weapon to school was associated with low ESE in black and white girls suggesting that low ESE is both situation-specific and specific to the female sex. The mediator between these things is low ESE—it is different for both black boys and black girls, and when it occurs different courses of action are taken, whether it’s through bringing a weapon to school or being threatened. What this tells me is that black and white boys with low ESE are more likely to be threatened because they are perceived to be more meek, while black and white girls with low ESE that get provoked at school are more likely to bring weapons. So it seems that girls bring weapons when provoked and boys fight.
The two meta-analyses reviewed above show that there is a low positive (.14) correlation between testosterone and aggression (Archer, 1991; Book et al, 2001). Thusly, high levels of testosterone on their own are not sufficient enough to explain high levels of aggression/violence. Further, there are race- and sex-specific differences when one is threatened at high school with black and white boys being more likely to report being threatened more (which implies a higher rate of physical fighting) while black and white girls when threatened brought weapons to school. These race- and sex-specific differences in the course of action taken when they are physically threatened needs to be looked into more.
I’d like to see the difference in testosterone levels for a matched sample of black and white boys from two neighboring districts with different murder rates as a proxy for the amount of violence in the area. I’d bet that the places with a higher murder rate would have children 1) report more violence and instances of bringing weapons to school and 2) report more harm from these encounters—especially if they have low ESE as seen in Valois (2017) and 3) the children in the high schools along with the residents of the area would have higher testosterone than the place with less violence. I would expect these differences to be magnified in the direction of Valois (2017) in that areas with higher murder rates would have black and white girls report bringing weapons to school when threatened whereas black and white boys would report more physical violence.
High testosterone itself is not sufficient enough to explain violence as the correlation is extremely low at .14. Testosterone levels fluctuate depending on the time of day (Brambilla et al, 2009; Long, Nguyen, and Stevermer, 2015) to the time of year (Stanton, Mullette-Gillman, and Huettel, 2011; Demur, Uslu, and Arslun, 2016). How the genders/races react differently when threatened in adolescence is interesting and deserves further study.
The Evolution of Racial Pelvis Variation
1850 words
It’s well-known that blacks have narrower hips than whites (Rushton, 1997; Handa et al, 2008). These pelvic differences then account for part of the variation in elite sporting events such as sprinting and jumping (Entine, 2000). These pelvic differences are the result of climatic variation and sexual selection.
The evolution of the pelvis is due to bipedalism. We are bipeds because of our S-shaped spine, which helps us to cope with differing loads. The human pelvis had to evolve in two ways—to make birthing babies easier and to become more efficient for bipedal walking. Termed the ‘obstetric dilemma’, it has implications for osteoarthritis in both men and women (Hogervorst, Heinse, and de Vos, 2009). Having a more efficient bipedal gait meant the body could allocate energy to other parts of the body—mainly our growing brains/neuronal count. Over time, the brain grew while the pelvis had to shrink for more efficient bipedalism. The pelvis also got narrower in our evolution, being wider in Australopithicenes, while becoming more narrow when erectus appeared—which is the first instance of a humanlike pelvis in the fossil record—which increased how far we could travel as well as reduce our energy expenditure (Lieberman, et al, 2006). Further discussion can be found in my article Man the Athlete.
So we began evolving a narrower pelvis in comparison to our ancestors because it was more efficient for heat dissipation. Smaller trunks are more efficient for heat dissipation (Lieberman, 2015), whereas wider trunks are more efficient for thermoregulation in colder climes (Weaver and Hublin, 2008; Weaver, 2009; Gruss and Schmidt, 2015). Now, simply applying this logic to Eurasians and Africans (I am grouping East Asians and Europeans together since they were a single breeding population up until about 23,000-6,500ya), we can see one reason why that population has wider pelves than Africans.
When anatomically modern humans (AMH) left Africa between 50-100kya, human skeletal morphology was just like modern-day Africans’ today. When Man migrated into northerly climes, however, a wider pelvis was needed to retain heat in colder climes (Gruss and Schmidt, 2015). So, along with a wider pelvis evolving due to climatic demands on the body, as we migrated north the human brain expanded due to the climate of the area, along with expanding the pelvis to better thermoregulate (which a bigger brain also does in northerly climes). I did argue two months back (and added to Skoyles’ (1999) theory) that brain size increased for expertise capacity and not IQ since Arctic people needed more tools, as well as tools that were more complex, in comparison to peoples who evolved in a hotter climate. So selection then occurred for larger brains and pelvis due to the demand for thermoregulation and bigger brains—which then led to earlier births and more helpless babes, which higher levels of intelligence were then needed to care for them (Piantadosi and Kidd, 2016). The helplessness of infants predicts the intelligence of adults in the primate genera (Piantadosi and Kidd, 2016), so I will assume that this holds within primate species as well (I am not able to locate a citation that this doesn’t hold within the primate genera; if I am in error, please provide a citation). Since African children are born earlier and more mature than Eurasian children who are born slightly later and more helpless/less developed, this is one reason why Eurasians have higher levels of intelligence than Africans (which is independent of any direct effects of climate I may add!).
So since Eurasians needed a larger brains to make more tools in the Arctic/colder climes, their brains needed to expand in size for increased expertise capacity, which would then have further selected for wider pelves in Eurasian women. Climatic variation caused the wider hips/bigger brains in Eurasians, which then allowed the evolution of larger brains in comparison to those who remained in Africa.
Finally, the obstetric dilemma has been recently called into question; there is evidence that a wider pelvis does not increase locomotor costs in humans (Warrener et al, 2015), a treadmill tracked their gait, as well as the motion of their pelvis. This study is used as evidence that the obstetric dilemma is wrong—they argue that there is no trade-off between narrower hips in men and wider hips in women. However, as the authors point out, all subjects in the study walked/ran at the same speed. Let’s say that the speed was heightened; do you think the women/men with wider pelves would have had the same locomotor costs as the men/women with narrower pelves? The answer is, obviously, no.
The pelvis of all of the races of Man has evolved the way they are due to environmental/climatic demands. A wider pelvis is better for thermoregulation in colder climates, while a narrower pelvis/body is more efficient for heat loss (Gruss and Schmidt, 2015).
Thus, we can look at the evolution of brain size/pelvic size in a few ways: 1) The amount of tools/complexity of the tools in the area that led to a need for an increase in brain size for more ‘chunks’ (Gobet and Simon, 1998), which then—along with colder climates—selected for larger brains and a wider body/pelvis which made birthing babes with large heads/brains easier along with helping to conserve heat due to the wider body (Gruss and Schmidt, 2015); 2) Since people in higher altitudes needed a high amount of expertise to survive, further selection for bigger brains, wider pelves occurred because of this; 3) Africans have smaller pelves in comparison to Eurasians because they evolved in hotter climes and didn’t have the amount of tools that peoples in more northerly climes did—which also increased brain size; 4) putting this all together, we can say that because Africans live in hotter climates, they need narrow pelves in order to lose body heat; Eurasians, after they migrated into more northerly climes, needed a wider body/pelvis in order to retain heat. When Man migrated north, he needed the ability to become an expert in, say, tool-making and thus needed a bigger brain for more informational chunks (Simon and Gobet, 1998; Skoyles, 1999). Due to this, Eurasians have wider pelves since they needed larger brains for a higher expertise capacity (Skoyles, 1999).
When Man migrated north, he needed the ability to become an expert in, say, tool-making and thus needed a bigger brain for more informational chunks (Simon and Gobet, 1998; Skoyles, 1999). Due to this, Eurasians have wider pelves than Africans; so they can birth larger-brained children. The width of the female pelvis, too, was shaped by sexual selection (Lassek and Gaulin, 2009). Therefore, the evolution of the modern pelvis in human populations comes down to climatic variation, which, in turn, affects how large of a brain the babe is able to have. Climate constrains brain size in either ‘direction’, big or small. We don’t even need to look at the variation within modern Homo sapiens to see the pattern in pelvic size we do today; because the pelvic differences noted among Man definitely were in effect millions of years ago, with hominids in colder climates having wider pelves while hominids in warmer climates had narrower pelves.
Along with everything above, the evolution of the human pelvis has a few implications for the human races today. Some recent studies have shown that there is no obstetric dilemma at all, with birth complications being caused by babies with higher weights than in our ancestral past, due to environmental mismatches causing higher-weight babies (Warrener et al, 2015; Betti, 2017), which was also beneficial for the evolution of our large brains (Cunnane and Crawford, 2003) with the largest amount of cortical neurons in the animal kingdom. However, marked differences in locomotion would be seen in people who had wide pelves compared to narrow pelves; which is what we see in elite running competitions: the elite runners have narrower pelves. So wider pelves don’t impede normal bipedal walking, but it does impede being able to efficiently run, as evidenced in participants of elite sprinting and marathon competitions. Looking at champion athletes and studying their locomotion (along with other traits as I’ve covered here) you can see that those with narrower pelves win more competitions than those with wider pelves (and happen to have different muscle fiber competition, fat distribution/percent, and morphology).
Racial differences in the pelvis explain the reasons behind why a certain race dominates in certain elite competitions; it largely comes down to skeletal morphology. These skeletal differences have evolutionary underpinnings, with the same pelvic differences seen in hominins that evolved in colder/warmer climates in the past. These pelvic differences (along with body fat percentage/distribution, musculoskeletal morphology, muscle fiber type, lean mass percentage, lower Vo2 max, poorer running economy, a larger Q-angle [4.6 degrees greater than men], etc) are why women are less efficient runners. People with wider hips are more likely to have be endomorphic while people with narrower hips are more likely to be ecto and meso. Not surprisingly, people from northerly climes consistently win WSM competitions whereas East and West Africans dominate bodybuilding and sprinting/marathons due to having a narrower pelvis and other advantageous morphological traits that lead to success in the sport. Nevertheless, pelvic differences between the races largely come down to differences in climate, which was also seen in ancient hominins. These pelvic differences further lead to racial differences in elite sporting competition.
References
Betti, L. (2017). Human Variation in Pelvic Shape and the Effects of Climate and Past Population History. The Anatomical Record,300(4), 687-697. doi:10.1002/ar.23542
Cunnane, S. C., & Crawford, M. A. (2003). Survival of the fattest: fat babies were the key to evolution of the large human brain. Comparative Biochemistry and Physiology Part A: Molecular & Integrative Physiology,136(1), 17-26. doi:10.1016/s1095-6433(03)00048-5
Dr. John R. Skoyles (1999) HUMAN EVOLUTION EXPANDED BRAINS TO INCREASE EXPERTISE CAPACITY, NOT IQ. Psycoloquy: 10(002) brain expertise
Entine, J. (2000). Taboo: why Black athletes dominate sports and why we are afraid to talk about it. New York: PublicAffairs.
Gobet, F., & Simon, H. A. (1998). Expert Chess Memory: Revisiting the Chunking Hypothesis. Memory,6(3), 225-255. doi:10.1080/741942359
Gruss, L. T., & Schmitt, D. (2015). The evolution of the human pelvis: changing adaptations to bipedalism, obstetrics and thermoregulation. Philosophical Transactions of the Royal Society B: Biological Sciences,370(1663), 20140063-20140063. doi:10.1098/rstb.2014.0063
Hogervorst, T., Heinse W.B., & de Vos J., (2009) Evolution of the hip and pelvis. Acta Orthopaedica, 80:sup336, 1-39, DOI: 10.1080/17453690610046620
Lieberman, D. E., Raichlen, D. A., Pontzer, H., Bramble, D. M., & Cutright-Smith, E. (2006). The human gluteus maximus and its role in running. Journal of Experimental Biology,209(11), 2143-2155. doi:10.1242/jeb.02255
Lieberman, D. E. (2015). Human Locomotion and Heat Loss: An Evolutionary Perspective. Comprehensive Physiology, 99-117. doi:10.1002/cphy.c140011
Piantadosi, S. T., & Kidd, C. (2016). Extraordinary intelligence and the care of infants. Proceedings of the National Academy of Sciences,113(25), 6874-6879. doi:10.1073/pnas.1506752113
Rushton J P (1997). Race, Evolution, and Behavior. A Life History Perspective (Transaction, New Brunswick, London).
Handa, V. L., Lockhart, M. E., Fielding, J. R., Bradley, C. S., Brubakery, L., Cundiffy, G. W., … Richter, H. E. (2008). Racial Differences in Pelvic Anatomy by Magnetic Resonance Imaging. Obstetrics and Gynecology, 111(4), 914–920.
Warrener, A. G., Lewton, K. L., Pontzer, H., & Lieberman, D. E. (2015). A Wider Pelvis Does Not Increase Locomotor Cost in Humans, with Implications for the Evolution of Childbirth. PLoS ONE, 10(3), e0118903.
Weaver, T. D., & Hublin, J. (2009). Neandertal birth canal shape and the evolution of human childbirth. Proceedings of the National Academy of Sciences,106(20), 8151-8156. doi:10.1073/pnas.0812554106
Weaver, T. D. (2009). The meaning of Neandertal skeletal morphology. Proceedings of the National Academy of Sciences,106(38), 16028-16033. doi:10.1073/pnas.0903864106
Race, Testosterone, and Honor Culture
2300 words
Misinformation about testosterone and strength in regards to race is rampant in the HBD-o-sphere. One of the most oft-repeated phrases is that “Blacks have higher levels of testosterone than whites”, even after controlling for numerous confounds. However, the people who believe this literally only cite one singular study with 50 blacks and 50 whites. Looking at more robust data with higher ns shows a completely different story. Tonight I will, again, go through the race/testosterone conundrum (again).
Type I fibers fire first when heavy lifting. Whites have more type I fibers. Powerlifters and Olympic lifters have a greater amount type IIa fibers, with fewer type IIx fibers (like whites). This explains why blacks are hardly represented in powerlifting and strongman competitions.
Somatype, too, also plays a role. Whites are more endo than blacks who are more meso. Endomorphic individuals are stronger, on average, than mesomorphic and ectomorphic individuals.
Blacks have narrower hips and pelves. This morphological trait further explains why blacks dominate sports. Some people may attempt to pick out one variable that I speak about (fiber type, morphology, somatype, fat mass, etc) and attempt to disprove it, thinking that disproving that variable will discredit my whole argument. However, fiber typing is set by the second trimester, with no change in fiber type from age 6 to adulthood (Bell et al, 1980).
It is commonly believed that blacks have higher levels of testosterone than whites. However, this claim is literally based off of one study (Ross et al, 1986) when other studies have shown low to no difference in T levels (Richards et al, 1992; Gapstur et al, 2002; Rohrmann et al, 2007; Mazur, 2009; Lopez et al, 2013; Richard et al 2014). People who still push the “blacks-have-higher-T-card” in the face of this evidence are, clearly, ideologues who want to cushion their beliefs when presented with contradictory evidence (Nyhan and Reifler, 2010).
‘Honor Culture’ and testosterone
In all of my articles on this subject, I have stated—extensively—that testosterone is mediated by the environment. That is, certain social situations can increase testosterone. This is a viewpoint that I’ve emphatically stated. I came across a paper while back that talks about a sociological perspective (I have huge problems with social ‘science’, [more on that soon] but this study was very well done) in regards to the testosterone difference between blacks and whites.
Some people when they read this, however, may go immediately to the part of the paper that says what they want it to say without fully assessing the paper. In this section, I will explain the paper and how it confirms my assertions/arguments.
Mazur (2016) begins the paper talking about ‘honor culture‘, which is a culture where people avoid intentionally offending others while also maintaining a status for not backing down from a confrontation. This theory was proposed by Richard Nisbett in 1993 to explain why the South had higher rates of violence—particularly the Scotch-Irish.
However parsimonious the theory may sound, despite its outstanding explanatory power, it doesn’t hold while analyzing white male homicides in the South. It also doesn’t hold analyzing within-county homicide rates either, since apparently poverty better explains higher homicide rates.
But let’s assume it’s true for blacks. Let’s assume the contention to be true that there is an ‘honor culture’ that people take part in.
Young black men with no education had higher levels of testosterone than educated whites and blacks. Looking at this at face value—literally going right to the section of the paper that says that poor blacks had higher testosterone, nearly 100 ng/ml higher than the mean testosterone of whites. As Mazur (2016) notes, this contradicts his earlier 2009 study in which he found no difference in testosterone between the races.
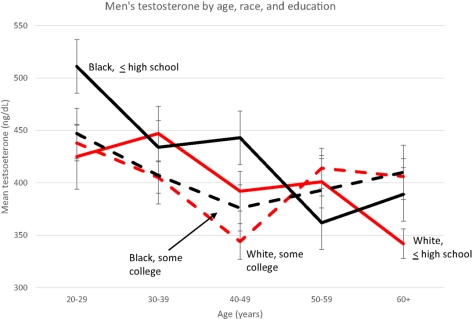
Note the low testosterone for both races at age 20-29—ranging from about 515 to 425—why such low testosterone levels for young men? Anyway, the cause for the higher levels is due to the type of honor culture that blacks participate in, according to Mazur (which is consistent with the data showing that testosterone rises during conflict/aggressive situations).
Mazur cites Elijah Anderson, saying that most youths have a “code of the streets” they take part in, which have to do with interpersonal communication such as “gait and verbal expressions” to deter aggressive behavior.
Testosterone is not a causal variable in regards to violent behavior. But it does rise during conflicts with others, watching a favorite sports team, asserting dominance, and even how you carry yourself (especially your posture). Since low-class blacks participate in these types of behaviors, then they would have higher levels of testosterone due to needing to “keep their status.”
When testosterone rises in these situations, it increases the response threat in mens’ brains, most notably showing increased activity in the amygdala. Further, dominant behavior and posture also increase testosterone levels. Putting this all together, since blacks with only a high school education have higher testosterone levels and are more likely to participate in honor culture compared to whites and blacks with higher educational achievement, then they would have higher testosterone levels than whites and blacks with a high school education who do not participate in honor culture.
Further, as contrary to what I have written in the past (and have since rescinded), there is no indication of higher testosterone levels in black women with low education. It seems this ‘honor culture’ effect on testosterone only holds for black men with only a high school education.
Mazur’s (2016) most significant finding was that black men aged 20-29 with only a high school education had 91 ng/ml higher testosterone than whites. Among older and/or educated men, testosterone did not vary. This indicates that since they have attained higher levels of educational success, there is no need to participate in ‘honor culture’.
This is yet further evidence for my assertion that environmental variables such as posture, dominance, and aggressive behavior raise testosterone levels.
The honor culture hypothesis is found to hold in Brazil in a comparative study of 160 inmates and non-inmates (De Souza et al, 2016). As Mazur (2016) notes, the honor culture hypothesis could explain the high murder rate for black Americans—the need to ‘keep their status’. It’s important to note that this increase in testosterone was not noticed in teenage or female blacks (because they don’t participate in honor culture).
There is a perfectly good environmental—not genetic—reason for this increase in testosterone in young blacks with only a high school education. Now that we know this, back to race and strength.
Mazur (2009) found that black men in the age range of 20-69, they averaged .39 ng/ml higher testosterone than whites, which is partly explained by lower marriage rates and low adiposity. White men are more likely to be obese than black men, since black men with more African ancestry are less likely to be obese. When controlling for BMI, blacks are found to have 2.5-4.9 percent more testosterone than whites (Gapstur et al, 2002, Rohrmann et al, 2007, Richard et al, 2014). There is little evidence for the assertion that blacks have higher levels of testosterone without environmental triggers.
Blacks between the age of 12 and 15 average lower levels of testosterone than whites. However, after the age of 15, “testosterone levels increase rapidly” with blacks having higher peak levels than whites (seen in table 2 below). After adjusting for the usual confounds (BMI, smoking, age, physical activity, and waist circumference), blacks still had higher levels of testosterone—which is attributed to higher levels of lean mass.
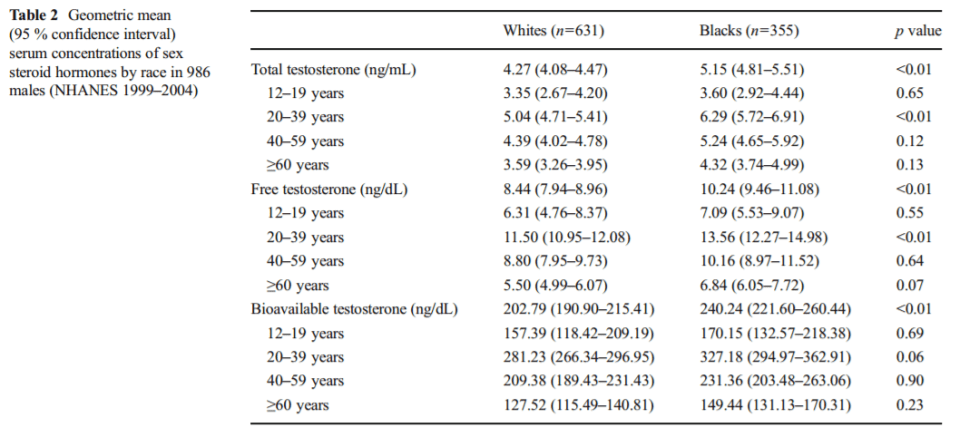
As seen above in table 2 from Hu et al (2014), the difference in total testosterone between blacks and whites aged 20-39 was 6.29 ng/ml and 5.04 ng/ml respectively, with free testosterone for whites being 11.50 and 13.56 for blacks and finally bioavailable testosterone for whites and blacks aged 20-39 was 281.23 and 327.18 ng/ml respectively. These small differences in testosterone cannot account for racial disparities in violence nor prostate cancer—since there is no relationship between prostate cancer and testosterone (Stattin et al, 2003; Michaud, Billups, and Partin, 2015).
In regards to Africans, the best studies I can find comparing some African countries with the West study salivary testosterone. However, there is a direct correlation between salivary testosterone and free serum testosterone (Wang et al, 1981; Johnson, Joplin, and Burrin, 1987). Of the studies I could find, Kenyan pastoralists called the Ariaal have lower levels of testosterone than Western men (Campbell, O’Rourke, and Lipson, 2003; Campbell, Gray, and Ellison, 2006) while men in Zimbabwe had levels “much lower” compared to Western populations (Lukas, Campbell, and Ellison, 2004). Lastly, among men aged 15 to 30, salivary testosterone levels in an American sample was 335 pmol//l compared to 286 pmol/l in men from the Congo (Elisson et al, 2002). Even certain African populations don’t have higher testosterone levels than Western peoples.
Conclusion
The meme that blacks have higher rates of testosterone in comparison to whites needs to be put to rest. This is only seen in blacks who participate in ‘honor culture’, which is an environmental variable. This is in contrast to people who believe that it is genetic in nature—environmental variables can and do drive hormones. Mazur (2016) is proof of that. Mazur (2016) also shows that the honor culture hypothesis doesn’t hold for teens or black males—so they don’t have elevated levels of testosterone. Certain studies of African populations, however, do not show higher levels of testosterone than Western populations.
Looking at the complete literature—rather than a select few studies— we can see that testosterone levels between white and black Americans are not as high as is commonly stated (Richards et al, 1992; Gapstur et al, 2002; Rohrmann et al, 2007; Mazur, 2009; Lopez et al, 2013; Hu et al, 2014; Richard et al, 2014). Further, even if blacks did have higher levels of testosterone than whites—across the board (sans honor culture), it still wouldn’t explain higher rates of black violence when compared to whites, nor would it explain higher prostate cancer rates (Stattin et al, 2003; Michaud, Billups, and Partin, 2015).
Only blacks with low educational achievement have higher levels of testosterone—which, even then is not enough to explain higher rates of violence or prostate cancer acquisition. Other factors explain the higher murder rate (i.e., honor culture, which increases testosterone, the environmental trigger matters first and foremost) and violent crime that blacks commit. But attempting to explain it with 30-year-old studies (Ross et al, 1986) and studies that show that environmental factors increase testosterone (Mazur, 2016) don’t lend credence to that hypothesis.
References
Bell, R. D., Macdougall, J. D., Billeter, R., & Howald, H. (1980). Muscle fiber types and morphometric analysis of skeletal muscle in six-year-old children. Medicine & Science in Sports & Exercise,12(1). doi:10.1249/00005768-198021000-00007
Campbell, B., O’rourke, M. T., & Lipson, S. F. (2003). Salivary testosterone and body composition among Ariaal males. American Journal of Human Biology,15(5), 697-708. doi:10.1002/ajhb.10203
Campbell, B. C., Gray, P. B., & Ellison, P. T. (2006). Age-related patterns of body composition and salivary testosterone among Ariaal men of Northern Kenya. Aging Clinical and Experimental Research,18(6), 470-476. doi:10.1007/bf03324846
De Souza, Souza, B. C., Bilsky, W., & Roazzi, A. (2016). The culture of honor as the best explanation for the high rates of criminal homicide in Pernambuco: A comparative study with 160 convicts and non-convicts. Anuario de Psicología Jurídica,26(1), 114-121. doi:10.1016/j.apj.2015.03.001
Ellison, P. T., Bribiescas, R. G., Bentley, G. R., Campbell, B. C., Lipson, S. F., Panter-Brick, C., & Hill, K. (2002). Population variation in age-related decline in male salivary testosterone. Human Reproduction,17(12), 3251-3253. doi:10.1093/humrep/17.12.3251
, , , , , . Serum androgen concentrations in young men: a longitudinal analysis of associations with age, obesity, and race—the CARDIA male hormone study. Cancer Epidemiol Biomarkers Prev 2002; 11: 1041–7
Hu, H., Odedina, F. T., Reams, R. R., Lissaker, C. T., & Xu, X. (2014). Racial Differences in Age-Related Variations of Testosterone Levels Among US Males: Potential Implications for Prostate Cancer and Personalized Medication. Journal of Racial and Ethnic Health Disparities,2(1), 69-76. doi:10.1007/s40615-014-0049-8
Johnson, S. G., Joplin, G. F., & Burrin, J. M. (1987). Direct assay for testosterone in saliva: Relationship with a direct serum free testosterone assay. Clinica Chimica Acta,163(3), 309-318. doi:10.1016/0009-8981(87)90249-x
Lopez, D. S., Peskoe, S. B., Joshu, C. E., Dobs, A., Feinleib, M., Kanarek, N., . . . Platz, E. A. (2013). Racial/ethnic differences in serum sex steroid hormone concentrations in US adolescent males. Cancer Causes & Control,24(4), 817-826. doi:10.1007/s10552-013-0154-8
Lukas, W. D., Campbell, B. C., & Ellison, P. T. (2004). Testosterone, aging, and body composition in men from Harare, Zimbabwe. American Journal of Human Biology,16(6), 704-712. doi:10.1002/ajhb.20083
Mazur, A. (2009). The age-testosterone relationship in black, white, and Mexican-American men, and reasons for ethnic differences. The Aging Male,12(2-3), 66-76. doi:10.1080/13685530903071802
Mazur, A. (2016). Testosterone Is High among Young Black Men with Little Education. Frontiers in Sociology,1. doi:10.3389/fsoc.2016.00001
Michaud, J. E., Billups, K. L., & Partin, A. W. (2015). Testosterone and prostate cancer: an evidence-based review of pathogenesis and oncologic risk. Therapeutic Advances in Urology,7(6), 378-387. doi:10.1177/1756287215597633
Nyhan, B., & Reifler, J. (2010). When Corrections Fail: The Persistence of Political Misperceptions. Political Behavior,32(2), 303-330. doi:10.1007/s11109-010-9112-2
Richard, A., Rohrmann, S., Zhang, L., Eichholzer, M., Basaria, S., Selvin, E., . . . Platz, E. A. (2014). Racial variation in sex steroid hormone concentration in black and white men: a meta-analysis. Andrology,2(3), 428-435. doi:10.1111/j.2047-2927.2014.00206.x
Richards, R. J., Svec, F., Bao, W., Srinivasan, S. R., & Berenson, G. S. (1992). Steroid hormones during puberty: racial (black-white) differences in androstenedione and estradiol–the Bogalusa Heart Study. The Journal of Clinical Endocrinology & Metabolism,75(2), 624-631. doi:10.1210/jcem.75.2.1639961
Rohrmann, S., Nelson, W. G., Rifai, N., Brown, T. R., Dobs, A., Kanarek, N., . . . Platz, E. A. (2007). Serum Estrogen, But Not Testosterone, Levels Differ between Black and White Men in a Nationally Representative Sample of Americans. The Journal of Clinical Endocrinology & Metabolism,92(7), 2519-2525. doi:10.1210/jc.2007-0028
Ross R, Bernstein L, Judd H, Hanisch R, Pike M, Henderson B. Serum testosterone levels in healthy young black and white men. J Natl Cancer Inst. 1986 Jan;76(1):45–48
Stattin, P., Lumme, S., Tenkanen, L., Alfthan, H., Jellum, E., Hallmans, G., . . . Hakama, M. (2003). High levels of circulating testosterone are not associated with increased prostate cancer risk: A pooled prospective study. International Journal of Cancer,108(3), 418-424. doi:10.1002/ijc.11572
Wang, C., Plymate, S., Nieschlag, E., & Paulsen, C. A. (1981). Salivary Testosterone in Men: Further Evidence of a Direct Correlation with Free Serum Testosterone. The Journal of Clinical Endocrinology & Metabolism,53(5), 1021-1024. doi:10.1210/jcem-53-5-1021
The Evolution of Human Skin Variation
4050 words
Human skin variation comes down to how much UV radiation a population is exposed to. Over time, this leads to changes in genetic expression. If that new genotype is advantageous in that environment, it will get selected for. To see how human skin variation evolved, we must first look to chimpanzees since they are our closest relative.
The evolution of black skin
Humans and chimps diverged around 6-12 mya. Since we share 99.8 percent of our genome with them, it’s safe to say that when we diverged, we had pale skin and a lot of fur on our bodies (Jablonski and Chaplin, 2000). After we lost the fur on our bodies, we were better able to thermoregulate, which then primed Erectus for running (Liberman, 2015). The advent of fur loss coincides with the appearance of sweat glands in Erectus, which would have been paramount for persistence hunting in the African savanna 1.9 mya, when a modern pelvis—and most likely a modern gluteus maximus—emerged in the fossil record (Lieberman et al, 2006). This sets the stage for one of the most important factors in regards to the ability to persistence hunt—mainly, the evolution of dark skin to protect against high amounts of UV radiation.
After Erectus lost his fur, the unforgiving UV radiation beamed down on him. Selection would have then occurred for darker skin, as darker skin protects against UV radiation. Dark skin in our genus also evolved between 1 and 2 mya. We know this since the melanocortin 1 receptor promoting black skin arose 1-2 mya, right around the time Erectus appeared and lost its fur (Lieberman, 2015).
However, other researchers reject Greaves’ explanation for skin cancer being a driver for skin color (Jablonksi and Chaplin, 2014). They cite Blum (1961) showing that skin cancer is acquired too late in life to have any kind of effect on reproductive success. Skin cancer rates in black Americans are low compared to white Americans in a survey from 1977-8 showing that 30 percent of blacks had basal cell carcinoma while 80 percent of whites did (Moon et al, 1987). This is some good evidence for Greaves’ hypothesis; that blacks have less of a rate of one type of skin cancer shows its adaptive benefits. Black skin evolved due to the need for protection from high levels of UVB radiation and skin cancers.
Highly melanized skin also protects against folate destruction (Jablonksi and Chaplin, 2000). As populations move away from high UV areas, the selective constraint to maintain high levels of folate by blocking high levels of UV is removed, whereas selection for less melanin prevails to allow enough radiation to synthesize vitamin D. Black skin is important near the equator to protect against folate deficiency. (Also see Nina Jablonski’s Ted Talk Skin color is an illusion.)
The evolution of white skin
The evolution of white skin, of course, is much debated as well. Theories range from sexual selection, to diet, to less UV radiation. All three have great explanatory power, and I believe that all of them did drive the evolution of white skin, but with different percentages.
The main driver of white skin is living in colder environments with fewer UV rays. The body needs to synthesize vitamin D, so the only way this would occur in areas with low UV rays.
White skin is a recent trait in humans, appearing only 8kya. A myriad of theories have been proposed to explain this, from sexual selection (Frost, 2007), which include better vitamin D synthesis to ensure more calcium for pregnancy and lactation (which would then benefit the intelligence of the babes) (Jablonski and Chaplin, 2000); others see light skin as the beginnings of more childlike traits such as smoother skin, a higher pitched voice and a more childlike face which would then facilitate less aggressiveness in men and more provisioning (Guthrie, 1970; from Frost, 2007); finally, van den Berghe and Frost (1986) proposed that selection for white skin involved unconscious selection by men for lighter-skinned women which is used “as a measure of hormonal status and thus childbearing potential” (Frost, 2007). The three aforementioned hypotheses have sexual selection for lighter skin as a proximate cause, but the ultimate cause is something completely different.
The hypothesis that white skin evolved to better facilitate vitamin D synthesis to ensure more calcium for pregnancy and lactation makes the most sense. Darker-skinned individuals have a myriad of health problems outside of their ancestral climate, one of which is higher rates of prostate cancer due to lack of vitamin D. If darker skin is a problem in cooler climates with fewer UV rays, then lighter skin, since it ensures better vitamin D synthesis, will be selected for. White skin ensures better and more vitamin D absorption in colder climates with fewer UV rays, therefore, the ultimate cause of the evolution of white skin is a lack of sunlight and therefore fewer UV rays. This is because white skin absorbs more UV rays which is better vitamin D synthesis.
Peter Frost believes that Europeans became white 11,000 years ago. However, as shown above, white skin evolved around 8kya. Further, contrary to popular belief, Europeans did not gain the alleles for white skin from Neanderthals (Beleza et al, 2012). European populations did not lose their dark skin immediately upon entering Europe—and Neanderthal interbreeding didn’t immediately confer the advantageous white skin alleles. There was interbreeding between AMH and Neanderthals (Sankararaman et al, 2014). So if interbreeding with Neanderthals didn’t infer white skin to proto-Europeans, then what did?
A few alleles spreading into Europe that only reached fixation a few thousand years ago. White skin is a relatively recent trait in Man (Beleza et al, 2012). People assume that white skin has been around for a long time, and that Europeans 40,000 ya are the ancestors of Europeans alive today. That, however, is not true. Modern-day European genetic history began about 6,500 ya. That is when the modern-day European phenotype arose—along with white skin.
Furthermore, Eurasians were still a single breeding population 40 kya, and only diverged recently, about 25,000 to 40,000 ya (Tateno et al, 2014). The alleles that code for light skin evolved after the Eurasian divergence. Polymorphisms in the genes ASIP and OCA2 may code for dark and light skin all throughout the world, whereas SLC24A5, MATP, and TYR have a predominant role in the evolution of light skin in Europeans but not East Asians, which suggests recent convergent evolution of a lighter pigmentation phenotype in European and East Asian populations (Norton et al, 2006). Since SLC24A5, MATP, and TYR are absent in East Asian populations, then that means that East Asians evolved light skin through completely different mechanisms than Europeans. So after the divergence of East Asians and Europeans from a single breeding population 25-40kya, there was convergent evolution for light pigmentation in both populations with the same selection pressure (low UV).
Some populations, such as Arctic peoples, don’t have the skin color one would predict they should have based on their ancestral environment. However, their diets are high in shellfish which is high in vitamin D, which means they can afford to remain darker-skinned in low UV areas. UV rays reflect off of the snow and ice in the summer and their dark skin protects them from UV light.
Black-white differences in UV absorption
If white skin evolved to better synthesize vitamin D with fewer (and less intense) UV rays, then those with blacker skin would need to spend a longer time in UV light to synthesize the same amount of vitamin D. Skin pigmentation, however, is negatively correlated with vitamin D synthesis (Libon, Cavalier, and Nikkels, 2013). Black skin is less capable of vitamin D synthesis. Furthermore, blacks’ skin color leads to an evolutionary environmental mismatch. Black skin in low UV areas is correlated with rickets (Holick, 2006), higher rates of prostate cancer due to lower levels of vitamin D (Gupta et al, 2009; vitamin D supplements may also keep low-grade prostate cancer at bay).
Libon, Cavalier, and Nikkels, (2013) looked at a few different phototypes (skin colors) of black and white subjects. The phototypes they looked at were II (n=19), III (n=1), and VI (n-11; whites and blacks respectively). Phototypes are shown in the image below.
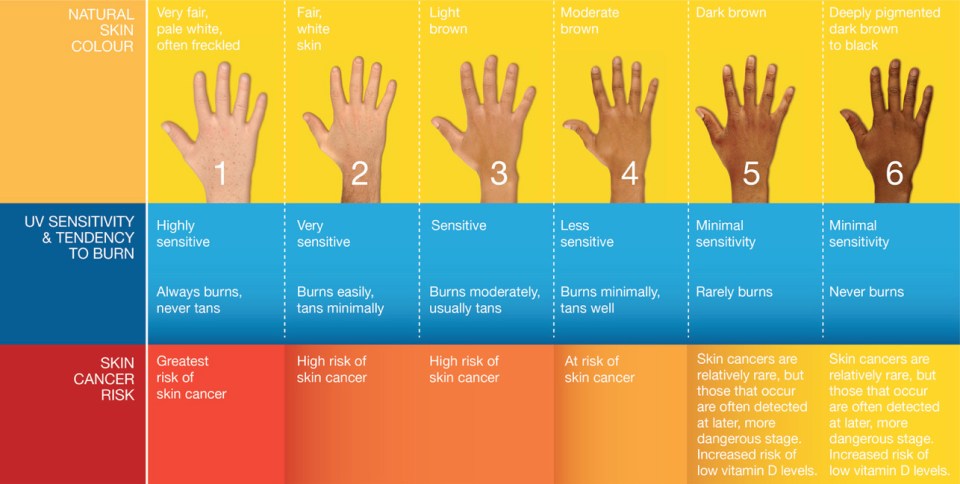

To avoid the influence of solar UVB exposure, this study was conducted in February. On day 0, both the black and white subjects were vitamin D deficient. The median levels of vitamin D in the white subjects was 11.9 ng/ml whereas for the black subjects it was 8.6 ng/ml—a non-statistically significant difference. On day two, however, concentrations of vitamin D in the blood rose from 11.9 to 13.3 ng/ml—a statistically significant difference. For the black cohort, however, there was no statistically significant difference in vitamin D levels. On day 6, levels in the white subjects rose from 11.6 to 14.3 ng/ml whereas for the black subjects it was 8.6 to 9.57 ng/ml. At the end of day 6, there was a statistically significant difference in circulating vitamin D levels between the white and black subjects (14.3 ng/ml compared to 9.57 ng/ml).
Different phototypes absorb different amounts of UV rays and, therefore, peoples with different skin color absorb different levels of vitamin D. Lighter-skinned people absorb more UV rays than darker-skinned people, showing that white skin’s primary cause is to synthesize vitamin D.
UVB exposure increases vitamin D production in white skin, but not in black skin. Pigmented skin, on the other hand, hinders the transformation of 7-dehydrocholesterol to vitamin D. This is why blacks have higher rates of prostate cancer—they are outside of their ancestral environment and what comes with being outside of one’s ancestral environment are evolutionary mismatches. We have now spread throughout the world, and people with certain skin colors may not be adapted for their current environment. This is what we see with black Americans as well as white Americans who spend too much time in climes that are not ancestral to them. Nevertheless, different-colored skin does synthesize vitamin D differently, and knowledge of this will increase the quality of life for everyone.
Even the great Darwin wrote about differences in human skin color. He didn’t touch human evolution in On the Origin of Species (Darwin, 1859), but he did in his book Descent of Man (Darwin, 1871). Darwin talks about the effects of climate on skin color and hair, writing:
It was formerly thought that the colour of the skin and the character of the hair were determined by light or heat; and although it can hardly be denied that some effect is thus produced, almost all observers now agree that the effect has been very small, even after exposure during many ages. (Darwin, 1871: 115-116)
Darwin, of course, championed sexual selection as the cause for human skin variation (Darwin, 1871: 241-250). Jared Diamond has the same view, believing that natural selection couldn’t account for hair loss, black skin and white skin weren’t products of natural selection, but female mate preference and sexual selection (Greaves, 2014).
Parental selection for white skin
Judith Rich Harris, author of the book The Nurture Assumption: Why Kids Turn Out the Way They Do (Harris, 2009), posits another hypothesis for the evolution of light skin for those living in northern latitudes—parental selection. This hypothesis may be controversial to some, as it states that dark skin is not beautiful and that white skin is.
Harris posits that selection for lighter skin was driven by sexual selection, but states that parental selection for lighter skin further helped the fixation of the alleles for white skin in northern populations. Neanderthals were a furry population, as they had no clothes, so, logic dictates that if they didn’t have clothes then they must have had some sort of protection against the cold Ice Age climate, therefore they must have had fur.
Harris states that since lighter skin is seen as more beautiful than darker skin, then if a woman birthed a darker/furrier babe than the mother would have committed infanticide. Women who birth at younger ages are more likely to commit infanticide, as they still have about twenty years to birth a babe. On the other hand, infanticide rates for mothers decrease as she gets older—because it’s harder to have children the older you get.
Harris states that Erectus may have been furry up until 2 mya, however, as I’ve shown, Erectus was furless and had the ability to thermoregulate—something that a hairy hominin was not able to do (Lieberman, 2015).
There is a preference for lighter-skinned females all throughout the world, in Africa (Coetzee et al, 2012); China and India (Naidoo et al, 2016; Dixson et al, 2007); and Latin America and the Philipines (Kiang and Takeuchi, 2009). Light skin is seen as attractive all throughout the world. Thus, since light skin allows better synthesize of vitamin D in colder climes with fewer UV rays, then there would have been a myriad of selective pressures to push that along—parental selection for lighter-skinned babes being one of them. This isn’t talked about often, but infanticide and rape have both driven our evolution (more on both in the future).
Harris’ parental selection hypothesis is plausible, and she does use the right dates for fur loss which coincides with the endurance running of Erectus and how he was able to thermoregulate body heat due to lack of fur and more sweat glands. This is when black skin began to evolve. So with migration into more northerly climes, lighter-skinned people would have more of an advantage than darker-skinned people. Infanticide is practiced all over the world, and is caused—partly—by a mother’s unconscious preferences.
Skin color and attractiveness
Lighter skin is seen as attractive all throughout the world. College-aged black women find lighter skin more attractive (Stephens and Thomas, 2012). It is no surprise that due to this, a lot of black women lighten their skin with chemicals.
In a sample of black men, lighter-skinned blacks were more likely to perceive discrimination than their darker-skinned counterparts (Uzogara et al, 2014). Further, in appraising skin color’s effect on in-group discrimination, medium-skinned black men perceived less discrimination than lighter- and darker-skinned black men. Lastly—as is the case with most studies—this effect was particularly pronounced for those in lower SES brackets. Speaking of SES, lighter-skinned blacks with higher income had lower blood pressure than darker-skinned blacks with higher income (Sweet et al, 2007). The authors conclude that a variety of psychosocial stress due to discrimination must be part of the reason why darker-skinned blacks with a high SES have worse blood pressure—but I think there is something else at work here. Darker skin on its own is associated with high blood pressure (Mosley et al, 2000). I don’t deny that (perceived) discrimination can and does heighten blood pressure—but the first thing that needs to be looked at is skin color.
Lighter-skinned women are seen as more attractive (Stephen et al, 2009). This is because it signals fertility, femininity, and youth. One more important thing it signals is the ability to carry a healthy child to term since lighter skin in women is associated with better vitamin D synthesis which is important for a growing babe.
Skin color and intelligence
There is a high negative correlation between skin color and intelligence, about –.92 (Templer and Arikawa, 2006). They used the data from Lynn and Vanhanen’s 2002 book IQ and the Wealth of Nations and found that there was an extremely strong negative correlation between skin color and IQ. However, data wasn’t collected for all countries tested and for half of the countries the IQs were ‘estimated’ from other surrounding countries’ IQs.
Jensen (2006) states that the main limitation in the study design of Arikawa and Templer (2006) is that “correlations obtained from this type of analysis are completely non-informative regarding any causal or functional connection between individual differences in skin pigmentation and individual differences in IQ, nor are they informative regarding the causal basis of the correlation, e.g., simple genetic association due to cross-assortative mating for skin color and IQ versus a pleiotropic correlation in which both of the phenotypically distinct but correlated traits are manifested by one and the same gene.”
Lynn (2002) purported to find a correlation of .14 in a representative sample of American blacks (n=430), concluding that the proportion of European genes in African Americans dictates how intelligent that individual black is. However, Hill (2002) showed that when controlling for childhood environmental factors such as SES, the correlation disappears and therefore, a genetic causality cannot be inferred from the data that Lynn (2002) used.
Since Lynn found a .14 correlation between skin color and IQ in black Americans, that means that only .0196 percent of the variation in IQ within black American adults can be explained by skin color. This is hardly anything to look at and keep in mind when thinking about racial differences in IQ.
However, other people have different ideas. Others may say that since animal studies find that lighter animals are less sexually active, are less aggressive, have a larger body mass, and greater stress resistance. So since this is seen in over 40 species of vertebrate, some fish species, and over 30 bird species (Rushton and Templer, 2012) that means that it should be a good predictor for human populations. Except it isn’t.
we know the genetic architecture of pigmentation. that is, we know all the genes (~10, usually less than 6 in pairwise between population comparisons). skin color varies via a small number of large effect trait loci. in contrast, I.Q. varies by a huge number of small effect loci. so logically the correlation is obviously just a correlation. to give you an example, SLC45A2 explains 25-40% of the variance between africans and europeans.
long story short: it’s stupid to keep repeating the correlation between skin color and I.Q. as if it’s a novel genetic story. it’s not. i hope don’t have to keep repeating this for too many years.
Finally, variation in skin color between human populations are primarily due to mutations on the genes MC1R, TYR, MATP (Graf, Hodgson, and Daal, 2005), and SLC24A5 (also see Lopez and Alonso, 2014 for a review of genes that account for skin color) so human populations aren’t “expected to consistently exhibit the associations between melanin-based coloration and the physiological and behavioural traits reported in our study” (Ducrest, Keller, and Roulin, 2008). Talking about just correlations is useless until causality is established (if it ever is).
Conclusion
The evolution of human skin variation is complex and is driven by more than one variable, but some are stronger than others. The evolution of black skin evolved—in part—due to skin cancer after we lost our fur. White skin evolved due to sexual selection (proximate cause) and to better absorb UV rays for vitamin D synthesis in colder climes (the true need for light skin in cold climates). Eurasians split around 40kya, and after this split both evolved light skin pigmentation independently. As I’ve shown, the alleles that code for skin color between blacks and whites don’t account for differences in aggression, nor do they account for differences in IQ. The genes that control skin color (about a dozen) pale in comparison to the genes that control intelligence (thousands of genes with small effects). Some other hypotheses for the evolution of white skin are on par with being as controversial as the hypothesis that skin color and intelligence co-evolved—mainly that mothers would kill darker-skinned babies because they weren’t seen as beautiful as lighter-skinned babies.
The evolution of human skin variation is extremely interesting with many competing hypotheses, however, to draw wild conclusions based on just correlations in regards to human skin color and intelligence and aggression, you’re going to need more evidence than just correlations.
References
Bang KM, Halder RM, White JE, Sampson CC, Wilson J. 1987. Skin cancer in black Americans: A review of 126 cases. J Natl Med Assoc 79:51–58
Beleza, S., Santos, A. M., Mcevoy, B., Alves, I., Martinho, C., Cameron, E., . . . Rocha, J. (2012). The Timing of Pigmentation Lightening in Europeans. Molecular Biology and Evolution,30(1), 24-35. doi:10.1093/molbev/mss207
Blum, H. F. (1961). Does the Melanin Pigment of Human Skin Have Adaptive Value?: An Essay in Human Ecology and the Evolution of Race. The Quarterly Review of Biology,36(1), 50-63. doi:10.1086/403275
Coetzee V, Faerber SJ, Greeff JM, Lefevre CE, Re DE, et al. (2012) African perceptions of female attractiveness. PLOS ONE 7: e48116.
Darwin, C. (1859). On the origin of species by means of natural selection, or, the preservation of favoured races in the struggle for life. London: J. Murray.
Darwin, C. (1871). The descent of man, and selection in relation to sex. London: John Murray, Albemarle Street.
Dixson, B. J., Dixson, A. F., Li, B., & Anderson, M. (2006). Studies of human physique and sexual attractiveness: Sexual preferences of men and women in China. American Journal of Human Biology,19(1), 88-95. doi:10.1002/ajhb.20584
Ducrest, A., Keller, L., & Roulin, A. (2008). Pleiotropy in the melanocortin system, coloration and behavioural syndromes. Trends in Ecology & Evolution,23(9), 502-510. doi:10.1016/j.tree.2008.06.001
Frost, P. (2007). Human skin-color sexual dimorphism: A test of the sexual selection hypothesis. American Journal of Physical Anthropology,133(1), 779-780. doi:10.1002/ajpa.20555
Graf, J., Hodgson, R., & Daal, A. V. (2005). Single nucleotide polymorphisms in theMATP gene are associated with normal human pigmentation variation. Human Mutation,25(3), 278-284. doi:10.1002/humu.20143
Greaves, M. (2014). Was skin cancer a selective force for black pigmentation in early hominin evolution? Proceedings of the Royal Society B: Biological Sciences,281(1781), 20132955-20132955. doi:10.1098/rspb.2013.2955
Gupta, D., Lammersfeld, C. A., Trukova, K., & Lis, C. G. (2009). Vitamin D and prostate cancer risk: a review of the epidemiological literature. Prostate Cancer and Prostatic Diseases,12(3), 215-226. doi:10.1038/pcan.2009.7
Guthrie RD. 1970. Evolution of human threat display organs. Evol Biol 4:257–302.
Harris, J. R. (2006). Parental selection: A third selection process in the evolution of human hairlessness and skin color. Medical Hypotheses,66(6), 1053-1059. doi:10.1016/j.mehy.2006.01.027
Harris, J. R. (2009). The nurture assumption: why children turn out the way they do. New York: Free Press.
Hill, Mark E. 2002. Skin color and intelligence in African Americans: A reanalysis of Lynn’s data. Population and Environment 24, no. 2:209–14
Holick, M. F. (2006). Resurrection of vitamin D deficiency and rickets. Journal of Clinical Investigation,116(8), 2062-2072. doi:10.1172/jci29449
Jablonski, N. G., & Chaplin, G. (2000). The evolution of human skin coloration. Journal of Human Evolution,39(1), 57-106. doi:10.1006/jhev.2000.0403
Jablonski, N. G., & Chaplin, G. (2014). Skin cancer was not a potent selective force in the evolution of protective pigmentation in early hominins. Proceedings of the Royal Society B: Biological Sciences,281(1789), 20140517-20140517. doi:10.1098/rspb.2014.0517
Jensen, A. R. (2006). Comments on correlations of IQ with skin color and geographic–demographic variables. Intelligence,34(2), 128-131. doi:10.1016/j.intell.2005.04.003
Kiang, L., & Takeuchi, D. T. (2009). Phenotypic Bias and Ethnic Identity in Filipino Americans. Social Science Quarterly,90(2), 428-445. doi:10.1111/j.1540-6237.2009.00625.x
Libon, F., Cavalier, E., & Nikkels, A. (2013). Skin Color Is Relevant to Vitamin D Synthesis. Dermatology,227(3), 250-254. doi:10.1159/000354750
Lieberman, D. E. (2015). Human Locomotion and Heat Loss: An Evolutionary Perspective. Comprehensive Physiology, 99-117. doi:10.1002/cphy.c140011
Lieberman, D. E., Raichlen, D. A., Pontzer, H., Bramble, D. M., & Cutright-Smith, E. (2006). The human gluteus maximus and its role in running. Journal of Experimental Biology,209(11), 2143-2155. doi:10.1242/jeb.02255
López, S., & Alonso, S. (2014). Evolution of Skin Pigmentation Differences in Humans. ELS. doi:10.1002/9780470015902.a0021001.pub2
Lynn, R. (2002). Skin color and intelligence in African Americans. Population and Environment, 23, 365–375.
Mosley, J. D., Appel, L. J., Ashour, Z., Coresh, J., Whelton, P. K., & Ibrahim, M. M. (2000). Relationship Between Skin Color and Blood Pressure in Egyptian Adults : Results From the National Hypertension Project. Hypertension,36(2), 296-302. doi:10.1161/01.hyp.36.2.296
Naidoo, L.; Khoza, N.; Dlova, N.C. A fairer face, a fairer tomorrow? A review of skin lighteners. Cosmetics 2016, 3, 33.
Norton, H. L., Kittles, R. A., Parra, E., Mckeigue, P., Mao, X., Cheng, K., . . . Shriver, M. D. (2006). Genetic Evidence for the Convergent Evolution of Light Skin in Europeans and East Asians. Molecular Biology and Evolution,24(3), 710-722. doi:10.1093/molbev/msl203
Rushton, J. P., & Templer, D. I. (2012). Do pigmentation and the melanocortin system modulate aggression and sexuality in humans as they do in other animals? Personality and Individual Differences,53(1), 4-8. doi:10.1016/j.paid.2012.02.015
Sankararaman, S., Mallick, S., Dannemann, M., Prüfer, K., Kelso, J., Pääbo, S., . . . Reich, D. (2014). The genomic landscape of Neanderthal ancestry in present-day humans. Nature,507(7492), 354-357. doi:10.1038/nature12961
Stephen, I. D., Smith, M. J., Stirrat, M. R., & Perrett, D. I. (2009). Facial Skin Coloration Affects Perceived Health of Human Faces. International Journal of Primatology,30(6), 845-857. doi:10.1007/s10764-009-9380-z
Stephens, D., & Thomas, T. L. (2012). The Influence of Skin Color on Heterosexual Black College Women’s Dating Beliefs. Journal of Feminist Family Therapy,24(4), 291-315. doi:10.1080/08952833.2012.710815
Sweet, E., Mcdade, T. W., Kiefe, C. I., & Liu, K. (2007). Relationships Between Skin Color, Income, and Blood Pressure Among African Americans in the CARDIA Study. American Journal of Public Health,97(12), 2253-2259. doi:10.2105/ajph.2006.088799
Tateno, Y., Komiyama, T., Katoh, T., Munkhbat, B., Oka, A., Haida, Y., . . . Inoko, H. (2014). Divergence of East Asians and Europeans Estimated Using Male- and Female-Specific Genetic Markers. Genome Biology and Evolution,6(3), 466-473. doi:10.1093/gbe/evu027
Templer, D. I., & Arikawa, H. (2006). Temperature, skin color, per capita income, and IQ: An international perspective. Intelligence,34(2), 121-139. doi:10.1016/j.intell.2005.04.002
Uzogara, E. E., Lee, H., Abdou, C. M., & Jackson, J. S. (2014). A comparison of skin tone discrimination among African American men: 1995 and 2003. Psychology of Men & Masculinity, 15(2), 201–212. http://doi.org/10.1037/a0033479
van den Berghe PL, Frost P. 1986. Skin color preference, sexual dimorphism and sexual selection: a case of gene-culture coevolution? Ethn Racial Stud 9:87–113.
The “N” Word
1300 words
Numerous academics have been looked at as pariahs for uttering this word. This word has a pretty long history offending people. The word I’m talking about is natural. This “N” word—especially today—is extremely divisive in today’s society. If you say that something is ‘natural‘, are you taking away any accomplishments that one has done, all because it’s ‘natural‘?
Take what I’ve been writing about for the past three weeks: athletics. If you say that one is a “natural” at athletic competition, are you taking away the hard work it took for that specific athlete to accomplish his goal? No way. You’re acknowledging that that specific individual has something special that sets him apart from the average person. That’s not to say that hard work, determination, and confidence don’t matter; on the contrary. They DO matter. However, like I said with the Kalenjin Kenyan distance runners (who do have anatomical/physiologic advantages in regards to sprinting): you can take someone with elite genetics who has done elite training and put him up against someone who has subpar genetics (in terms of the athletic event) with elite training—the same training as the athlete with elite genetics—and the athlete with elite genetics/muscle fibers/physiology will constantly blow away the individual who is less genetically gifted.
People readily admit that certain races excel at certain physical activities whereas other races don’t fare as well. As I’ve extensively covered (and provided more than enough evidence/arguments for), the races differ in the number of muscle fibers which cause higher rates of obesity in blacks; this causes strength differences which then correlate with mortality. Finally, somatype is extremely important when speaking about athletics. Blacks have a mesomorphic somatype, which, along with their fiber typing and physiologic differences on average compared to whites, cause blacks to dominate most sporting events. However, when you say that certain races are “naturally more intelligent than others“, people all of a sudden have a bone to pick.
This “N” word when it comes to athletics is perfectly fine to use in our vocabulary, yet when we begin talking about intelligence differences—between races and individuals—all of a sudden we think that everyone is the same and that all brains are made the same. We believe that, although humans evolved genetically isolated for thousands of years and have incurred anatomic/physiologic differences, that one organ—the brain—is somehow exempt from the forces of natural selection. I can think of no traits that WON’T get selected for/against, and so I can think of no reason why the brain wouldn’t be under different selective pressures in Siberia/Northern Europe/the Americas/Africa/PNG/Australia.
However, as far as I can tell, we have not found any alleles that differ between populations. It was proposed in 2005 that the genes ASPM and Microcephalin influenced brain growth (Evans et al, 2005; Mekel-Brobov et al, 2005). However, two years later, Rushton, Vernon and Ann Bons (2007) showed that there was no evidence that Microcephalin and ASPM were associated with general mental ability (GMA), head circumference or altruism. Peter Frost cites Woodley et al, (2014) showing that the correlation between microcephalin and IQ is .79, whereas the correlation with ASPM and IQ was .254. Woodley et al (2014) also show there is a correlation between Disability Adjusted Life Years (DALY) and Microcephalin. The reasoning is that Microcephalin may improve the body’s immune response to viral infections, enabling humans to live in larger societies and thus get selected for higher IQ. Since the allele seems to give better disease resistance, then, over time, selection for higher intelligence can be selected for since fewer people are dying from disease due to increased resistance.
Nevertheless, the debate is still out on this allele. However, the data does look good in that we may have found certain polymorphisms that differ between populations which may explain some racial differences in intelligence. (For more information on IQ alleles, see Race and IQ: the Case for Genes).
Now, we are beginning to have some good evidence pile up showing that there are population differences in these alleles, and that they do predict intelligence. Racial differences in intelligence aren’t accepted by mainstream science and the public at large (obviously) like physiologic/anatomic differences are between human populations. Populations are split for thousands of years. They evolve different anatomy/physiology based on the environment. So, then, why wouldn’t psychological differences appear between the races of Man, when other, physical changes occurred from the OoA migration? It literally makes no sense.
People readily admit that athleticism is largely “natural“, yet when someone says that differences in intelligence are largely due to genes they get shouted down and called a ‘racist’, as if that adds anything to the dialogue. People readily admit that individuals/races are “naturally” leaner/stronger/faster/have quicker reflexes. But if one just even hints at thinking about “natural” differences between populations when it comes to general mental ability, they will be shouted down and their careers will be ruined.
Why? Why are people so scared of the “N” word? Because people want to believe that what they do or do not accomplish comes down to them as an individual and only them. They don’t want to think about the complex interaction between genes x environment and how that shapes an individual’s life path. They only think about environment, and not any possible genetic factors. Certain people—mostly social science majors—deny that evolution had ANY impact on human behavior. The “N” word, especially in today’s society, is a completely divisive word. State that you hold hereditarian views (in terms of mental ability) in regards to differences between populations and athletic events and no one will bat an eye.
“Didn’t you see Usain Bolt blow away the competition and set a new world record in the 100m dash at 9.58 seconds?!”
“He’s naturally good, he was born a gifted athlete.”
No one will bat an eye if you say this. This is where the tables will be flipped if you say:
“Don’t you know that differences in intelligence are largely genetic in nature and no matter how much you ‘train the brain’ you’ll stay at that intelligence level?”
“Man, that’s racist. That shouldn’t be looked at. We are all the same and equal. Except when it comes to certain athletic events, then we are not equal and some populations have natural predispositions that help them win. Evolution stopped at the neck 100kya; the only parts of the body under selective pressure over the past 100kya is below the neck!”
People who say this need to explain exactly what shields the brain from selection pressures. Man originated in Africa, the descendants of the soon-to-be coalesced races spent tens of thousands of years in differing environments. You need to do different things to survive in different environments. Just as the races differ physically, they differ mentally as well. Evolution did not stop at the neck. Significant changes in the brain have occurred in the past 10,000 years. There was a trade-off with agriculture, in that it was responsible for the population explosion which was responsible for mutations that affect intelligence and thus get selected for.
The “N” word is not a scary word. It is, in fact, it’s just common sense. People need to realize that by accepting genetic explanations for black domination in sports, that they would then, logically, have to accept racial differences in intelligence. It makes no sense to accept evolutionary theories (even if you don’t know it) in regards to athletics and not accept the same evolutionary theories for racial differences in the brain. There are real differences between populations, in both anatomy/physiology and our mental faculties and brain organization. If you accept one, you have to accept the other.
Racial Differences in Somatype
1750 words
One’s somatype is, really, the first thing they notice. Somatypes are broken down into three categories: ectomorph (skinny build), endomorph (rounder, fatter build) and mesomorph (taller, more muscular build). Like numerous other traits, different races and ethnies fall somewhere in between these three soma categories. Africans are meso, while Europeans are endo, while East Asians are more endo than Europeans. Differences in somatype, too, lead to the expected racial differences in sports due to differing anatomy and fat mass.
History of somatyping
The somatype classification was developed by psychiatrist William Sheldon in the 1940s, while releasing a book in 1954 titled Atlas of Men: Somatotyping the Adult Male At All Ages. He theorized that one’s somatype could predict their behavior, intelligence, and where they place socially. Using nude posture photos from his Ivy League students, he grouped people into three categories based on body measurements and ratios—mesomorph, endomorph, and ectomorph. Clearly, his theory is not backed by modern psychology, but I’m not really interested in that. I’m interested in the somatyping.
Somatypes
The three somatypes are endomorph, mesomorph, and ectomorph. Each type has different leverages and body fat distribution. Endomorphs are rounder, with short limbs, a large trunk, carry more fat in the abdomen and lower body, large chest, wide hips, and has hardly any muscular definition, yet gain strength easily. Ectomorphs, on the other hand, are taller, lankier with longer limbs, a narrow chest, thin body, short trunk and has little muscle.
There are further subdivisions within the three main types, mesomorphic-endomorph (meso-dominant), mesomorph-endomorph (both types are equal with less ectomorphy), ectomorphic-mesomorph, endomorphic-mesomorph, endomorph-ectomorph, and ectomorphic-endomorph. This can be denoted as “7-1-1”, which would indicate pure endomorph, “1-7-1” would indicate pure mesomorph and “1-1-7” would be a pure ectomorph. Further breakdowns can be made such as “1.6-2.7-6.4”, indicating the somatype is ecto-dominant. On the scale, 1 is extremely low while 7 is extremely high. The races, however, fall along racial lines as well.
Racial differences in somatype
West Africans and their descendants are the most mesomorphic. They also have the highest amount of type II muscle fibers which is a leading cause of their success in sporting events which call for short bursts of speed. Due to having longer limbs, they have a longer stride and can generate more speed. West Africans also have the narrowest hips out of all of the races (Rushton, 1997: 163) which further leads to their domination in sprinting competitions and events that take quick bursts of speed and power. However much success their morphology lends them in these types of competitions, their somatype hampers them when it comes to swimming. The first black American qualified for the Olympic swimming team in the year 2000. This is due to a narrower chest cavity and denser, heavier bones.
East Africans are most ectomorphic which you can see by their longer limbs and skinnier body. They have an average BMI of 21.6, one of the lowest in the world. Their low BMI, ectomorphic somatype and abundance of slow twitch muscle fibers are why they dominate in distance running events. Many explanations have been proposed to explain why East Africans (specifically Kenyans and Ethiopians) dominate distance running. The main factor is their somatype (ectomorphic) (Wilbur and Pitsiladis, 2012). The authors, however, downplay other, in my opinion, more important physiologic characteristics such as muscle fiber typing, and differences in physiology. Of course their somatype matters for why they dominate, but other important physiologic characteristics do matter. They clearly evolved together so you cannot separate them.
Europeans are more endo than East Africans and West Africans but less so than East Asians. Europeans have a strong upper body, broad shoulders, longer and thicker trunk and shorter extremities along with 41 percent slow twitch fibers compared to blacks’ 33 percent slow twitch fibers. This is why Europeans dominate power sports such as powerlifting and the World’s Strongest Man. Eighty to 100 percent of the differences in total variation in height, weight, and BMI between East Asians and Europeans are associated with genetic differences (Hur et al, 2008). If the variation between East Asians and Europeans on height, weight and BMI are largely attributed to genetic factors, then the same, I assume, should be true for Africans and Europeans/East Asians.
East Asians are the most endomorphic race and have lighter skeletons and more body fat. They have short arms and legs with a large trunk, which is a benefit when it comes to certain types of lifting movements (such as Olympic lifting, where East Asians shine) but hampers them when it comes to sprinting and distance running (although they have higher rates of type I fibers). East Asians also have more body fat at a lower BMI which is further evidence for the endomorphic somatype. This is also known as ‘TOFI’, ‘Thin on the Outside, Fat on the Inside’. Chinese and Thai children had a higher waist circumference and higher trunk fat deposits than Malay and Lebanese children (Liu et al, 2011). This is a classic description of the endomorphic individual.
Human hands and feet are also affected by climate. Climatic variation played a role in shaping the racial somatic differences we see today. The differences seen in hands and feet “might be due to the presence of evolutionary constraints on the foot to maintain efficient bipedal locomotion” (Betti et al, 2015).
Black-white differences in somatype
Fifty percent of the variability in lean mass is due to genetic factors (Arden and Specter, 1997) with the heritability of stature 85 percent in a meta-analysis (Peeters et al, 2009). Racial differences in somatype are also seen at a young age (Malina, 1969). Blacks had better muscular development and less fat-free mass at an early age. Vickery et al (1988) argued that since blacks have thinner skin folds that caliper measurements testing differences in body fat would be skewed. Malina (1969) also reports the same. Note that Malina’s paper was written in 1969, literally right before it got pushed on the American populace that fat was bad and carbohydrates were good.
Looking at the two tables cited by Malina (1969) on somatype we can see the difference between blacks and whites.
| Data from Malina, (1969: 438) | n | Mesomorph | Ectomorph | Endomorph |
| Blacks | 65 | 5.14 | 2.99 | 2.92 |
| Whites | 199 | 4.29 | 2.89 | 3.86 |
| Data from Malina (1969: 438) | Blacks | Whites |
| Thin-build body type | 8.93 | 5.90 |
| Submedium fatty development | 48.31 | 29.39 |
| Medium fleshiness | 33.69 | 43.63 |
| Fat and very fat categories | 9.09 | 21.06 |
Since this data was collected literally before we went down the wrong path and wrongly demonized fat and (wrongly) championed carbohydrates, this is an outstanding look at somatype/fat mass before the obesity epidemic. There is a clear trend, with blacks being more likely to have lower levels of fat-free body mass while also more likely to be mesomorphic. This has a ton of implications for racial differences in sports.
Somatype is predicated on lean mass, stature, bone density and fat-free body mass. Since racial differences appear in somatype at an early age, there is a great chance that the differences in somatype are genetic in nature.
College (American) football players are more likely to be endo-mesomorphs while high-school football players were more likely to be mesomorphs (Bale et al, 1994). This partly explains black over representation in football. Further, basketball, handball, and soccer players in Nigeria were taller, heavier, and had lower percent body fat than other athletic groups (Mazur, Toriola, and Igobokwe, 1985). Somatic differences have a lot to do with domination in sports competition.
Somatic differences are also seen in boxing. Elite boxers are more likely to have a mesomorphic somatype compared to non-athletes. Higher weight divisions were also more likely to be mesomorphic and endomorphic than the lower weight divisions which skewed ectomorphic (Noh et al, 2014). Blacks do well in boxing since they have a more mesomorphic somatype. Due to their higher levels of type II fibers, they can be quicker and throw more forceful punches which translates to boxing success.
Conclusion
Racial differences in somatype are another key to the puzzle to figure out why the races differ in elite sporting competition. The races evolved in different geographic locations which then led to differences in somatype. West African sports dominance is explained by their somatype, muscle fiber type, and physiology. The same can be said for Europeans in strength sports/powerlifting sports, and East Asians with ping-pong and some strength sports (though, due to lower muscle mass they are the least athletic of the races). I am not, of course, denying the impact of determination to succeed or training of any kind. What one must realize, however, is that one with the right genetic makeup/somatype and elite training will, way more often than not, outperform an individual with the wrong genetic makeup/somatype and elite training. These inherent differences between races explain the disparities in elite sporting competitions.
References
Arden, N. K., & Spector, T. D. (1997). Genetic Influences on Muscle Strength, Lean Body Mass, and Bone Mineral Density: A Twin Study. Journal of Bone and Mineral Research,12(12), 2076-2081. doi:10.1359/jbmr.1997.12.12.2076
Bale P, Colley E, Mayhew JL, et al. Anthropometric and somatotype variables related to strength in American football players. J Sports Med Phys Fitness 1994;34:383–9
Betti, L., Lycett, S. J., Cramon-Taubadel, N. V., & Pearson, O. M. (2015). Are human hands and feet affected by climate? A test of Allen’s rule. American Journal of Physical Anthropology,158(1), 132-140. doi:10.1002/ajpa.22774
Hur, Y., Kaprio, J., Iacono, W. G., Boomsma, D. I., Mcgue, M., Silventoinen, K., . . . Mitchell, K. (2008). Genetic influences on the difference in variability of height, weight and body mass index between Caucasian and East Asian adolescent twins. International Journal of Obesity,32(10), 1455-1467. doi:10.1038/ijo.2008.144
Liu, A., Byrne, N. M., Kagawa, M., Ma, G., Kijboonchoo, K., Nasreddine, L., . . . Hills, A. P. (2011). Ethnic differences in body fat distribution among Asian pre-pubertal children: A cross-sectional multicenter study. BMC Public Health,11(1). doi:10.1186/1471-2458-11-500
Malina, R. M. (1969). Growth and Physical Performance of American Negro and White Children: A Comparative Survey of Differences in Body Size, Proportions and Composition, Skeletal Maturation, and Various Motor Performances. Clinical Pediatrics,8(8), 476-483. doi:10.1177/000992286900800812
Mathur, D. N., Toriola, A. L., & Igbokwe, N. U. (1985). Somatotypes of Nigerian athletes of several sports. British Journal of Sports Medicine,19(4), 219-220. doi:10.1136/bjsm.19.4.219
Noh, J., Kim, J., Kim, M., Lee, J., Lee, L., Park, B., . . . Kim, J. (2014). Somatotype Analysis of Elite Boxing Athletes Compared with Nonathletes for Sports Physiotherapy. Journal of Physical Therapy Science,26(8), 1231-1235. doi:10.1589/jpts.26.1231
Peeters, M., Thomis, M., Beunen, G., & Malina, R. (2009). Genetics and Sports: An Overview of the Pre-Molecular Biology Era. Genetics and Sports Medicine and Sport Science, 28-42. doi:10.1159/000235695
Rushton J P (1997). Race, Evolution, and Behavior. A Life History Perspective (Transaction, New Brunswick, London).
Vickery SR, Cureton KJ, Collins MA. Prediction of body density from skinfolds in black and white young men. Hum Biol 1988;60:135–49.
Wilber, R. L., & Pitsiladis, Y. P. (2012). Kenyan and Ethiopian Distance Runners: What Makes Them so Good? International Journal of Sports Physiology and Performance,7(2), 92-102. doi:10.1123/ijspp.7.2.92
