
Home » Posts tagged 'ethnicity'
Tag Archives: ethnicity
Guns, Germs, and Steel: A Refutation
Of course the allegations of “racism” arise, as usual when in discussions of racial differences in intelligence and level of civilizational achievement. Rushton also says:
Racial differences in brain size and IQ map very closely to the same cultural histories Diamond explains. Although Diamond dismisses such research as "loathsome", he fails to tell his readers what, if anything, might be scientifically wrong with any of it. One hundred years of research has
established that East Asians and Europeans average higher IQs than do Africans. East Asians, measured in North America and in Pacific Rim
countries, typically average IQs in the range of 101 to 111. Caucasoid populations in North America, Europe, and Australasia typically average
IQs from 85 to 115 with an overall mean of 100. African populations living south of the Sahara, in North America, in the Caribbean, and in Britain
typically have mean IQs from 70 to 90.Racial differences in brain size and IQ map very closely to the same cultural histories Diamond explains. Although Diamond dismisses such research as
"loathsome", he fails to tell his readers what, if anything, might be scientifically wrong with any of it. One hundred years of research has established that East Asians and Europeans average higher IQs than do Africans. East Asians, measured in North America and in Pacific Rim
countries, typically average IQs in the range of 101 to 111.  Caucasoid populations in North America, Europe, and Australasia typically average IQs from 85 to 115 with an overall mean of 100. African populations living south of the Sahara, in North America, in the Caribbean, and in Britain typically have mean IQs from 70 to 90.
Ethnic Differences in Sleep, Obesity, and Metabolic Syndromes
2300 words
Ethnic differences in the prevalence of obesity occur, majorly in part due to differences in the rates of metabolic syndrome (which is actually a few variables including high blood pressure, high blood sugar which leads to insulin resistance, excess visceral fat around the waist which is the ‘skinny fat‘ phenomenon, and abnormal blood pressure levels) and obesity. Ethnic differences in these variables do, in part, show how the three ethnies differ in rates of obesity. I will discuss the differences between each ethny in regards to metabolic syndrome and sleep and how it leads to the differences in ethnic obesity rates.
Sleep Differences
There is a ‘missing hour of sleep‘ when comparing blacks and whites. On average, blacks get 6.05 hours of sleep while whites get 6.85 hours of sleep. Of course, the same old racism argument comes up, which, if one ‘percieves’ discrimination, I wouldn’t doubt that it would have an effect on sleep due to a rise in cortisol, which affects sleep due to the raised levels making you restless and not able to fall asleep. Insulin levels then rise due to the rise in cortisol, which is the cause of obesity.
Some studies may try to say that racism and other forms of discrimination are a factor, without even thinking of genetic factors. Another study that Frost cites says that duration of deep sleep and duration of stage 2 (light sleep) is correlated correlated in African Americans with perceived discrimination. The authors defined ‘perceived discrimination’ as the extent to which one believes that their ethnic group have been discriminated against by society. Still even when controlling for discrimination, there were still marked differences between blacks and whites and how long they slept.
Frost then talks about how sleep patterns are heritable and cites studies done on Africans in Africa. One study found that there was an hour sleep difference between Ghanaians and Norwegians on the week days and between a quarter to half hour less on weekends. He shows another study showing that Nigerian college students sleep 6.2 hours a day while getting 70-minute naps in the afternoon.
Frost concludes that the African sleep patterns is normal on Africa. Africans are more active during the cooler times of the day and sleep during the bitter periods. Frost says those who evolved in more northerly climes are particularly adapted to a certain sleep pattern with the same holding true for Africans.
However, these sleep patterns in first world countries have negative effects on metabolism and rates of obesity.
Here are some more studies showing that blacks sleep less than whites:
The sleep of African Americans: a comparative review: The researchers found that blacks take longer to fall asleep than whites, report poorer sleep quality, have more light and less deep sleep, and nap more often and longer. This is a huge recipe for risk factors for obesity, and it shows in their demographics.
Unfair Treatment is associated with Poor Sleep in African American and Caucasian Adults: Pittsburgh SleepSCORE Project: This is one of the studies spoken about above that show that discrimination leads to less sleep. Though, it holds for both black and white adults. The researchers conclude:
Taken together, the confluence of perceived unfair treatment as a chronic stressor and poor sleep and the interplay between the two may have critical roles in long-term health problems.
African Genetic Ancestry is Associated with Sleep Depth in Older African Americans: The researchers hypothesized that “racial differences in sleep phenotypes would show an association with objectively measured individual genetic ancestry in AAs.” They conclude that the slow wave sleep may have genetic underpinnings.
Mexican Americans sleep less than do Mexican immigrants. US-born Mexicans are 40 percent more likely to be short sleepers. This is attenuated by environmental factors such as smoking and stress, which shorten the duration of sleep (smoking decreases the Body Set Weight, whereas cortisol along with insulin in tandem increase it).
Also, in this study by Roane et al (2014) looked at the link between sleep disturbances and stress in Mexican Americans (average age 55) and non-‘Hispanic’ whites (average age 66). Mexicans reported higher levels of sleep disturbance (25 percent) compared to whites (17 percent). They conclude that disturbed sleep was positively correlated with depression.
So both blacks and Mexicans sleep less than whites. These differences in sleep between these three ethnies also affect the prevalence of obesity in these populations.
Obesity and Sleep
It’s long been known that poor sleep habits make people fat. This is due to the effects of insulin and cortisol. Increased insulin comes before increased cortisol–increased insulin is the cause for obesity. Sleeping less is linked to obesity. Since, as described above, the three ethnies differ in sleep patterns, the same also holds true for obesity rates (Ogden at al, 2014). The trends are as follows: 67.3% for whites, 75.6% for blacks, and 77.9% for Hispanics. Though, sleep is only one factor involved with obesity.
Getting adequate sleep is extremely important. Not doing so can lead to a myriad of negative health implications:
Sleep is an important modulator of neuroendocrine function and glucose metabolism and sleep loss has been shown to result in metabolic and endocrine alterations, including decreased glucose tolerance, decreased insulin sensitivity, increased evening concentrations of cortisol, increased levels of ghrelin, decreased levels of leptin, and increased hunger and appetite. Recent epidemiological and laboratory evidence confirm previous findings of an association between sleep loss and increased risk of obesity.
So a lack of sleep leads to an increase in ghrelin levels, decreased levels of leptin (the same effects as caloric restriction over time), increased appetite and hunger, increased evening cortisol (which insulin spikes then follow), decreased insulin sensitivity (the cortisol brings it back up and most people are insulin resistant independent of diet), decreased glucose tolerance, etc. We can see that these ethnic differences in sleep, which are partly genetic in nature, can and would have great effects on metabolism, contributing to the ethnic differences in obesity rates.
And from Harvard:
For example, in the Nurses’ Health Study, researchers followed roughly 60,000 women for 16 years, asking them about their weight, sleep habits, diet, and other aspects of their lifestyle. (2) At the start of the study, all of the women were healthy, and none were obese; 16 years later,women who slept 5 hours or less per night had a 15 percent higher risk of becoming obese, compared to women who slept 7 hours per night. Short sleepers also had 30 percent higher risk of gaining 30 pounds over the course of the study, compared to women who got 7 hours of sleep per night.
Damn!! This, pretty much, mirrors the black-white difference. I’d love to see a racial breakdown of this cohort and will keep an eye out for one, but in the meantime, those who were short sleepers had a 30 percent higher risk of gaining 30 pounds over the course of the study in comparison to women who got 7 hours of sleep per night. Blacks are the most likely group to be overweight and obese in the US, and this data from the Nurses Health Study (which tons of data can be drawn from this study) shows one reason why, however the driver is cortisol > insulin > processed carbs > increased insulin > insulin resistance > increased insulin > vicious cycle > obesity. These differences in sleep almost perfectly mirror the ethnic differences in obesity.
There are several possible ways that sleep deprivation could increase the chances of becoming obese. (1) Sleep-deprived people may be too tired to exercise, decreasing the “calories burned” side of the weight-change equation. Or people who don’t get enough sleep may take in more calories than those who do, simply because they are awake longer and have more opportunities to eat; lack of sleep also disrupts the balance of key hormones that control appetite, so sleep-deprived people may be hungrier than those who get enough rest each night.
Ah the old ‘exercise to increase the Calories Out part of the equation’. however, Calories Out does not stay constant. This also rebuts the ‘Eat Less and Move More’ CICO (Calories In/Calories Out) model of obesity, showing that because it doesn’t take insulin into account, it’s doomed to fail.
Speaking of insulin, it’s about time I focused on metabolic syndrome.
Metabolic Syndrome
As I discussed in a previous post, Race, Obesity, Poverty, and IQ, metabolic differences exist between race/ethnicity. ‘Hispanics’ metabolize carbohydrates differently, blacks have a lower fiber intake (increased fiber protects against obesity, another correlate) while whites have a more high fat diet. Contrary to popular belief, dietary fat doesn’t make you fat as it’s the macro that spikes your insulin the least.
Diaz et al (2005) showed that minority populations are more likely to be affected by diabetes mellitus which may be due to less healthy diets and/or genetic factors. Using the National Health and Nutrition Survey for 1999-2000, they analyzed overweight, healthy adults, calculating dietary intake variables and insulin sensitivity by ethnicity. They characterized insulin resistance with fasted insulin, as those who are more likely to become insulin resistant have higher fasted insulin levels (levels taken after waking, with the subject being told not to eat the night before as to get a better reading of fasted insulin levels). Non-‘Hispanic’ whites had higher energy and fat intake while ‘Hispanics’ had higher carb intake with blacks having lower fiber intake. Blacks and ‘Hispanics’ were more likely to have lower insulin sensitivity. However, ‘Hispanics’ were more likely to have lower insulin sensitivity even after controlling for diet, showing that metabolic differences exist between ethnicities that affect carbohydrate metabolism which leads to higher rates of diabetes in those populations.
In ‘Hispanics’, several loci were discovered that play a role in hepatic (relating to the liver) fat content. Along with showing that ‘Hispanics’ have lower insulin (which due to low insulin, blood glucose builds up in the blood stream leading to diabetes) and showing that they metabolize glucose in the liver differently due to differing loci leading to more cases of fatty liver, this shows how and why ‘Hispanics’ have higher rates of Type II Diabetes Mellitus (TIIDM).
Since TIIDM affects Mexican Americans more, better measures to address their differences in carbohydrate metabolism need to be taken. Racial and ethnic differences in TIIDM are as follows:
7.6% of non-Hispanic whites
9.0% of Asian Americans
12.8% of Hispanics
13.2% of non-Hispanic blacks
15.9% of American Indians/Alaskan Natives
Whites eat a higher fat diet, which means a decrease in carbs. Asians eat white rice which spikes blood glucose eliciting a high insulin response leading to TIIDM, ‘Hispanics’, non-‘Hispanic’ blacks, and Indians and Alaskan Natives (I wish they separated Indians and Alaskan Natives as I’m almost positive that Alaskan natives have a lower rate) all eat high carb, low fat, low protein diets. Carbohydrates are a main staple, and since they spike insulin the most, they are the cause for obesity and TIIDM rates in these populations.
Turning my attention over to metabolic syndrome and blacks and whites, we can see that black women with PCOS have an increased risk for cardiovascular disease and metabolic syndrome in comparison to white women with PCOS. The researchers say that after controlling for age and body mass index (BMI) “black women with PCOS had a significantly increased prevalence of low high-density lipoprotein and high glucose. The general CVD risk was significantly increased in black adults with PCOS.” Though, a longitudinal study needs to be carried out to assess the independent impact of race and PCOS with CVD (Cardiovascular Disease).
Blacks have a higher chance to be diagnosed with metabolic syndrome since they are also at increased risk to have elevated blood pressure (hypertension), become obese, and be diabetic. This is due to their diet, which is due to their low IQ (obesity is correlated with intelligence), and different metabolism in comparison to whites.
There are also metabolic differences between race and sex. Fat oxidation is lower in black than white men and in African American men/women and white men/women, they have a lower metabolic rate!!! 24-hour energy expenditure is lower in black women in comparison to white women, whereas physical activity energy expenditure (PAEE) is the same as whites. Contrasted with women, black men had higher PAEE than white men. The authors conclude:
In conclusion, this comparative study of 24-h energy metabolism in African Americans and whites with use of a respiratory chamber not only confirms the previous findings from ventilated-hood studies of a lower resting metabolic rate, but also suggests a lower 24EE in African American women than in white women. Although only marginal ethnic differences in metabolic rate were found in men, African American men seem to have a lower rate of fat oxidation than do white men. The underlying mechanisms for these sex differences and the significance of these findings with respect to the development and maintenance of obesity remains to be investigated in longitudinal studies.
Metabolic Syndrome and Obesity
Are Australoids and Pacific Islanders Negroid? A Reply to PumpkinPerson
1600 words
I’ve been in a few discussion with PumpkinPerson on phenotype and if the similar phenotype found in Australoids and Pacific Islanders meant they were Negroid. However, just because two *dissimilar groups* look *phenotypically similar*, that doesn’t mean that they are *genotypically similar*. Afrocentrists have also latched on to this ridiculous theory, saying that blacks are ‘all over the world, displaced by whites yada yada yada’. Today, I’ll show that just because those two groups look similar to Africans doesn’t mean that they are similar on the genotype.
PP wrote an article last week, The importance of leaving Africa, which I will be quoting from for the remainder of this article.
The root of this debate is not so much genuine scientific disagreement, but ethnic genetic interests. The black Afrocentrists believe it’s good for black people to be seen as part of this larger, global black community, thus dispelling the claim that blacks only left Africa in chains. For leaving Africa was one of the milestones that separates humans from our closest living relatives (chimpanzees), so the claim that blacks never left Africa is seen as racist indeed.
I agree here that Ethnic Genetic Interests is the main driver of the dispute.
But if the mere leaving of Africa did indeed screen for IQ, why do the Australoids score even lower on IQ tests than sub-Saharan Africans do, and have somewhat smaller brains
Because the environment is similar it would select for similar phenotypes, but just because the environment is extremely similar doesn’t mean that no genetic change occurred in the 70 ky that Australoids left Africa in.
By contrast, the non-black HBDers think it elevates their racial status to promote the idea that their ancestors did something that blacks couldn’t accomplish: leaving Africa.
Well, as I’ve covered here last year (time flys), those who left Africa had specific alleles, the DRD7 and DRD4 alleles, which are absent from SSA populations. This ‘wanderlust’, due to the DRD7 allele, is the *cause* of the migration OoA. It has nothing to do with being more intelligent than those who stayed, it has to do with the genetic mutation that arose from a common ancestor around the time of the OoA migration. The cause of the migration does come down to genetic differences in the founder population (s), but not intelligence differences.
Two notes on the DRD4 allele: populations with a history of migration have a higher chance of having the allele in comparison to sedentary populations. And: a correlation of .85 was found between km traveled and the rate of DRDR4 allele frequency distributions. These alleles are more prevalent in South America, which is not surprising since they had to travel the furthest.
PP then starts talking about why Australoids have lower IQs, saying:
With agriculture/civilization, the dark caucasoids traveled the World, spreading their high IQ mutation to every corner of the globe except those that are most isolated. So the mean genetic IQ of the entire World increased by 13 points, with the exception of places that were too hard to get to, such as Australia and Papua New Guineas, the Congo rain forest, the Southern tip of Africa, and the Americas. Since most of sub-Saharan Africa got the genes, they suddenly leaped from having lower IQs than the Austaloids, to being smarter (only the bushmen and pygmies, who like the Australoids, were too isolated to get the genes, remained behind the Australoids).
This is a great hypothesis. It makes a lot of sense. The ‘Dark Caucasoids’ as PP calls them, better known as Anatolian/Neolithic Farmers could have had a higher chance for more high IQ mutations due to the fact that they could farm and thus have a higher population giving more of a chance for higher IQs.
The downfall for the dark caucasoids was spreading these genes to whites and East Asians. Because of cold winters, East Asians and whites were smarter than pre-mutation dark caucasoids, and now with these mutations, they were smarter once again.
I’m confused here. What we call whites today did not exist that far back in the past. Europeans are an amalgamation of four different ancient populations, basically are an amalgamation of ‘Dark Caucasoids’. Is he also saying that the Neolithic Farmers were more intelligent than East Asians?
Eurasians didn’t become a distinct breeding group until the end of the last Glacial Maximum. This is why there is ‘genetic similarity’ to modern-day Europeans with some old, 10k year plus peoples in the Americas. Because the two groups didn’t split into distinct populations, they show a similar genotype. This is what proponents of the Solutrean Hypothesis need to get through their heads. (I recently got into a nice discussion over at The Alternative Hypothesis, scroll down for comments. I’m going to make a more comprehensive post on the SH in the near future as I have come across even better data on it.)
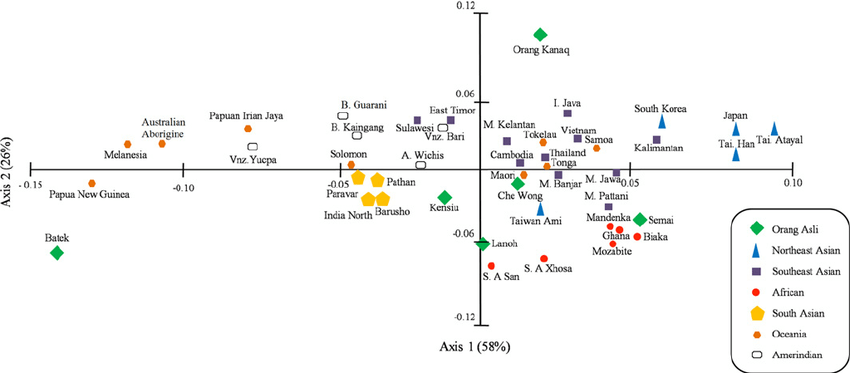
We can see from this PCA graph (from Zainel Abidin et al) that Australoids don’t even cluster in the vicinity of Africans. They are on the complete other side of the graph, showing how great of a genetic distance there is between these two populations. You can see the other Oceanic peoples (the orange dots, who Afrocentrists and others say are Negroid, Abos, Papuans, Melanesians, etc) are also clustered away from Africans. PCA graphs show that the three populations are not genetically similar and that phenotype, sometimes, isn’t enough to show who belongs to what racial grouping. PCA analysis refutes peoples ‘feelz’ on what they believe with their eyes. Even with this data, their ‘feelz’ still overrides the truth and they still believe lies.
While on this subject of similar phenotype not meaning one population is racially the same as another, people use this same fallacious reasoning for ‘white-looking’ peoples in the ME.
Quoting Razib Khan:
The final issue is that a lot of the phenotypes that we racially code are recent. This probably explains why groups like the Kalash and Nuristanis can look more like Europeans than South Asians, but they’re genetically more like South Asians.
What does any of this have to do with non-scientific things? I don’t really know. My interest in population structure is intellectual, not personal. But a certain type of person should probably stop talking about how white people have been in Europe for 40,000 years. First, the ancestors of modern Europeans 40,000 years ago were almost all residing outside of Europe. An assertion that holds until 15,000 years ago. And most would still be resident outside of Europe 8,000 years ago as depending on how you count/calculate. *** And, perhaps more importantly, the typical phenotype of Northern Europeans probably really coalesced only around ~5,000 years ago. ***
How can there be such phenotypic similarity in two populations separated by thousands of miles?
Easy. The Kalash and other ME ‘white-looking’ populations have ancient Siberian ancestry. As shown in my linked article, modern-day Europeans have a great deal of Siberian ancestry, mostly from the true Aryans, the Yamnaya peoples.
And in the comments Razib was asked:
“Could I bother you to list the top three theories/positions that you see falling into this unsupportable category?”
To which he responded:
“that phylogeny and phenotype track closely. just because you can’t tell the physical difference between two pops (e.g., solomon islanders and sub-saharan africans) they must be phylogenetically close. this is not the case.”
Pretty much seals the deal.
Just because populations look similar on the outside doesn’t mean they are genetically similar. As shown from Razib’s post, the phenotypes that we code are relatively recent, which is why there are some populations separated by thousands of miles yet look extremely similar.
Bonus:
This was said in the comments:
I can’t really tell about the genetics since I don’t have the scientific background, but my impression is a lot of those white identity guys have an extremely mythologised view of the past. This seems to be true even of the smarter ones; e.g. I recently read a bit of Richard Spencer’s twitter account (out of interest in the alt right phenomenon) and he throws out such totally retarded comments as “Europe has always been unified, even before Christianity” (totally ignoring what is known about the ancient Greeks’ intimate links to the Near East, the Greeks’ and Romans’ unflattering view of the northern barbarians, the emergence of Latin Christendom in the middle ages and the fairly late rise of the concept of Europe etc.) or “Europe is a nation”. There seems to be little awareness of the complexities of historical change because everything is reduced to some supposedly unchanging racial essence reaching back into the mists of prehistoric times. Now I’m pretty far right and “racist” myself, but a lot of this really seems pretty stupid…like myth-making for identity politics.
i knew the pre-WN richard spencer (we lost touch after his ideological changes ~2010). he’s smart. i have a hard time believing he doesn’t know the latest research, which was evening starting to be evident back then. so i think it’s myth-making.
p.s. a friend of mine sent me a link to a richard spencer interview with kevin macdonald last year i think, pointing to a specific segment of the podcast talking about ancient genetics. kevin was telling richard how europeans 40,000 years ago were white, and those are the ancestors of europeans. that’s wrong.
Europeans 40kya were not white those in the area at that time are *not* the ancestors of today’s Europeans.
Both Afrocentrists and Nordicists need to keep up with the new information that’s constantly coming out. Because what they say in regards to genetics and/or anything else is mostly wrong.
Japan’s Population Decline and r/K Selection Theory
Edit, 7/18/17: r/K selection theory has been rebutted.
r/K Selection Theory: A Response to Rushton
E.O. Wilson on Rushton’s r/K Theory and More on Endemic Disease
r/K Selection Theory: A Response to Anonymous Conservative
r/K Selection Theory: A Response to Truth-Justice
r/K theory doesn’t apply to humans and if it did, Mongoloids would be r and Africans would be K. Cold with is an agent of r selection while endemic disease is an agent of K selection. Rushton used a debunked “continuum” for the basis for his theory and completely changed r and K. However it’s wrong. Rushton was wrong. Anonymous Conservative is wrong. Anyone who uses those two in reference to r/K is wrong by proxy since r/K is a debunked paradigm.
Japan has had a population crisis for a few years. Japan’s fertility rate was 1.4 in 2014. To have enough children to keep the population stable, the Total Fertility Rate (TFR) needs to be 2.1. As a country industrializes and becomes more prosperous, the TFR drops as higher IQ follows better nutrition. As a nation industrializes and becomes more complex, the attention of the populace shifts from one of having children and a family to one of success and intellectualism. As this occurs, the birth rate drops because the more intelligent a population is, the more likely it is for them to pursue higher education or monetary achievement. Clearly, the main reason Japan has concerns with their TFR is due to their high intelligence.
The Japan Times reported yesterday that almost half of single young men and women were virgins. A survey of Japanese men and women aged 18-34 found that 70 percent of unmarried men and 60 percent of unmarried women were not in a relationship. Also discovered, 42 percent of the men and 42.4 percent of the women admitted to being virgins. The survey was taken before in 2010, with 36.2 percent of men and 38.7 percent of women admitting to being virgins.
These surveys have been carried out every 5 years since 1987. Then, the rate of men who said they had no partner was 48.6 percent and for women it was 39.5 percent. The survey, which was conducted last June and accounted for 8,754 single people and 6,598 married couples across Japan, also found that 90 percent of the respondents wanted to get married “sometime in the future”, but for some people, this turns out to be a mistake. Moreover, 30 percent of the 2,760 men and 26 percent of the 2,570 women polled said they were not currently looking for a relationship. The increase in singles was most noted in the 20s, when women are the most fertile. The Prime Minister of Japan, Shinzo Abe also said he wants to increase the birthrate from 1.4 to 1.8 by 2025.
Lastly, the study found that the number of children for couples marries for 15 to 19 years was 1.94, a record low. This study did not ask questions about same-sex partners, but what we are concerned about is the TFR and how it’s driven by evolution, so this is a non-factor.
Japan’s population is dramatically shrinking. In 2010, they had a population of 128 million but by their 2015 census, they had a population of 127 million. This is due to the increase in virgins and an aging population. Why is this happening?
This is, of course, driven by r/K Selection Theory. Rushton thought of r/K Selection Theory, also known as Differential K theory, in 1985 with a paper titled Differential K Theory: The Sociobiology of Individual and Group Differences. Organisms can be r-selected, K-selected or somewhere in between. Humans as a species are K-selected, but some human races and ethnies are more K-selected than others.
Africans are r-selected, meaning that they have many children while not investing too much time in their offspring. They evolved to be r-selected to offset the high mortality rate due to the harshness of Sub-Saharan Africa. Due to this, black girls have an earlier menarche (period) so they can reproduce more to a) offset the high mortality rate and b) have a chance to reproduce more due to the high mortality rate. This is driven by disease, malnutrition, and parasitic load, which also drop IQ and contribute to the high birth rate since lower IQ populations have more children.
Caucasians are in the middle of r and K, and have fewer children and put more energy into caring for each one. This goes back to evolving in the Ice Age where cooperation and altruism were needed. More attention to children was needed for Eurasians evolving back then due to the harsh conditions of the Ice Age. So, a higher IQ evolved, and along with the higher IQ came a bigger brain. The bigger brains of Eurasians led to children being born earlier, and a bigger brain allowed for better care for the children along with numerous other positive variables to help survive in the harsh weather. Moreover, genes from Neanderthals are responsible for a 1 percent decrease in historic fitness (biological fitness) in Eurasian populations.
Orientals (Japanese, Chinese, Koreans) are further K than Caucasians are. This is reflected in brain size, where more K-selected populations have bigger brains, thus they can think further into the future and maximize care for their children. The opposite holds true for blacks. This is reflected in modern-day, first-world life where blacks have too many children to care for on their own accord and whites and Orientals have fewer children and put more investment into their children .
It’s not only Japan that’s having this problem with birthrates. It’s all of the West and East Asia. Higher IQ societies do have a longer life expectancy, while lower IQ societies have a lower one. Then, as described above, the lower IQ populations have more children to offset the mortality rate.
Japan’s birthrate concerns are due largely in part to genetic factors. This is currently occurring in all high IQ populations. Those populations have a large elderly population, with the young demographic quickly shrinking. Seeing this gradient throughout the world with IQ and fertility rates, we can make some general conclusions:
- Low IQ populations have more children while high IQ populations have less children.
- High IQ populations are more likely to have a large subset of virgins, as seen with this article. Lower IQ populations lose their virginity earlier.
This can be seen with the CLASH (CLimate, Aggression and Self-control in Humans) model (Van Lange, Rinderu, and Bushmen 2016). According the the CIA World Fact book 2014, in countries closer to the equator, the average age of first birth for a female was 20 years of age (the countries were the Gaza strip, Liberia, Bangladesh, Kenya, Mali, Tanzania, Uganda and various other middle African countries). Conversely, for countries further away from the equator, the average age of first birth was 28 years of age (Japan, Canada, and most European countries). Those populations that evolved in warmer climates where the changes in season are minimal with unpredictable harshness tend to enact faster life history strategies than those in colder climates.
Moreover, a slower life history strategy (K-selection), under a predictable environment would be better to enhance inclusive fitness. There is a growing body of evidence that predictable environments promote K-selection “in terms of lower mortality, morbidity, delayed reproduction, and a higher contribution towards one’s social capital.” This can be seen with the trends in Western and East Asian countries.
The trend that Japan is facing can be reversed with incentives for reproduction. However, the more intelligent a society is, the fewer children it will have due to evolutionary pressures. Is there a happy medium between IQ and fertility rates, where the population isn’t too dumb and the fertility rates aren’t too low? I’ll explore that in the future.
Black Women and Testosterone
1350 words
(Note: Testosterone differences between the rates are negligible, not high enough to account for differences in prostate cancer mortality. Black males have 2.5 to 4.9 times higher testosterone than white males (see Richard et al, 2014) and my article on the cause for the difference in prostate cancer mortality. The difference in testosterone between the races is not too high, as is commonly believed. Old studies with small ns get cited, when bigger, more robust analyses show the opposite, with a smaller difference. A difference that cannot be attributed to racial differences in prostate cancer.)
(Note 2, 6/23/17: This post is getting a ton of traffic so I need to clarify some things.
Here is a quote from Mazur (2016):
The pattern [high testosterone] is not seen among teenage boys or among females.
…
There is no indication of inordinately high T among young black women with low education.
I cringed pretty hard reading the comments below; I was just like PumpkinPerson arguing something that is not true. However, I am more then capable of admitting that I am wrong with suffcient evidence. Read the most recent posts on testosterone on this blog for more information. End Edit)
The ENA Theory: On Testosterone and Aggressive Behavior by Race/Ethnicity
Why Testosterone Does Not Cause Crime
Testosterone and Aggressive Behavior
Race, Testosterone, and Prostate Cancer
Race, Testosterone, and Honor Culture
It is known that blacks have the highest levels of testosterone out of the major races of humanity. However, what’s not known is that black women have higher rates than white women. The same evolutionary factors that make it possible for black men to have high testosterone make it possible for women as well.
Most people don’t know this, but vitamin D isn’t really a vitamin; it’s a steroid hormone. Higher levels of testosterone occur due to increased exposure to the sun. Of course, the Middle East gets more sunlight than does Europe, so their levels of testosterone will be higher due to increased vitamin D, which in turn increases testosterone, causing more acts of aggression. Vitamin D supplementation could possibly (we know it does) raise testosterone levels. Of course, this is the case, seeing as vitamin D comes from the sun, and the more sun you get, the more Vitamin D you get, which increases testosterone levels. Those populations closer to the equator get more vitamin D from the sun’s rays, and thusly have higher levels of testosterone, on average.
Black women are more androgynous (personal observation, you can’t tell if they’re a man or woman from further away), and are more prone to get in to shouting matches/fights with other men or women. This is the high testosterone at work. Those with higher levels of test are more aggressive and have a more manly look as a result.
Moreover, the higher natural levels of testosterone found in black women are directly responsible for the reason why black men have higher levels of testosterone. Since circulating hormones matter for a woman’s child invitro, it would stand to reason that since black babes are in a woman with higher natural levels of testosterone, that this would pass on to the babe. This is exactly what is observed. One study showed that black women had 50 percent higher testosterone than white women in early pregnancy!! Ross, the head researcher of the study, speculates that “this increased hormonal exposure in utero might reset the so-called “gonadostat feed-back loop,” which regulates testosterone secretion, to a higher level.” With what we know about hormones and babes in the womb, this is a viable hypothesis.
Finally, Satoshi Kanazawa noted in this study that black women were not seen as attractive as women from other races. He says women, on average, are more attractive than men: EXCEPT BLACK WOMEN. The data shows black women as not being statistically different from the average, and far less attractive than whites, Asians, and Native American women.
The cause is higher testosterone. Kanazawa says that the cause for this is due to the mean BMI of black women being 28.5 among black women and 26.1 among non-black women. Though he says that’s not the reason why black women are less physically attractive. Black women have lower levels of intellect net of BMI. Even the racial differences in intelligence don’t account for these differences. Black women are STILL less physically attractive, net of BMI and intelligence. Kanazawa says: “Net of intelligence, black men are significantly more physically attractive than nonblack men.”
Why is that? To be blunt, black women look more like men than women due to their higher levels of testosterone. The amount of crying all throughout the Internet after Kanazawa published his paper says it all: Racist!! Sexist!! Except, they couldn’t respond to the data so of course, as is usually the case with racial/sex differences, bury it, forget about it and proclaim the one who said these uncomfortable truths is a “racist”. Kanazawa ends up concluding that testosterone differences are the only cause for these differences. With blacks having the highest testosterone out of all the races, black women obviously have higher rates of testosterone than white women. Those women with higher levels of testosterone have more masculine features, therefore making them less attractive.
My personal answer as to why black women are less attractive is due to testosterone obviously. But, we as humans can subconsciously detect things such as this. Since high levels of testosterone are correlated with numerous variables that then become masculinzied in black women, this is one very huge reason in my opinion.
Lewis (2010) says in his study Who is the fairest of them all? Race, attractiveness and skin color sexual dimorphism:
Previous research has suggested that perceived attractiveness and personality are affected by the race such that White faces are more attractive but less masculine than Black faces. Such studies, however, have been based on very small stimulus sets. The current study investigated perceived attractiveness and personality for 600 Black, White and mixed-race faces. Many of the investigated personality traits were correlated with race when rated by White participants. Attractiveness specifically was greater for Black male faces than White male faces and among mixed-race faces. Blackness correlated with increased attractiveness. A reverse pattern was found for female faces with Whiteness being associated with attractiveness. The results are discussed in terms of the sexual dimorphism demonstrated in skin color.
Race, Obesity, Poverty, and IQ
2100 words
America has a current and ongoing obesity epidemic. Some ethnicities are more likely to be obese or overweight than others due to lower intelligence which means a lack of ability to delay gratification, lack of ability to think into the future, lower funds which translates to eating more refined carbohydrates which means more blood glucose spikes which then leads to obesity as I will show. Insulin has a causal relationship with obesity so those who lack funds to buy healthier food then turn to refined foods high in carbohydrates as they are cheaper and more abundant in low-income neighborhoods.
Adult obesity rate by State (top 5) is: 1) Louisiana (36.2 percent), 2) Alabama (35.6), West Virginia (35.6), and Mississippi (35.6), and 5) Kentucky (34.6) with the 5 least obese States being 51) Colorado (20.2), 49) Hawaii (20.7), 48) Montana (23.6), 47) California (23.2), and 46) Massachusetts (24.3). Notice how the States with higher rates of obesity are in the South and the States with the lower rates are in the North, give or take. The average IQ for these States as follows: Lousiana: 95.3, Alabama: 95.7, West Virginia 98.7, Mississippi 94.2 (lowest IQ State in the country, largest black population at 37 percent), and Kentucky at 99.4. The average IQ for those States is 96.66. The average IQs for the States with the lowest obesity rates are: Colorado 101.6, Hawaii 95.6, Montana 103.4, California 95.5, and Massachusets 104.3 (highest IQ State). The average for these States being 100.08. So there is a 4 point IQ difference between the top 5 States with the highest and lowest percentage of obese people, which goes with the North/South gradient of higher IQ people living in the North and lower IQ people living in the South. Back in 2014, a California real estate group took 500,000 Tweets using a computer algorithm and estimated intelligence based on spelling, grammar, and word choice and found a difference in State by State intelligence. Notice how the further North you go the higher the average intelligence is, which is then correlated with the obesity levels in that State.
With poverty rates by State, we can see how the States in the South have less intelligent people in them which then correlates to the amount of obesity in the State. Though, there are some anomalies. West Virginia and Kentucky have a super majority of whites. This is easily explained by the fact that less intelligent whites live in those States, and since both the poverty rates and obesity rates are high, it follows that the State will be less intelligent than States that have more intelligent people and less obesity.
It is known that intelligence is correlated with obesity at around -.25 (Kanazawa, 2014). The negative correlation between intelligence and obesity means that they are inversely related so, on average, one with higher intelligence has less of a chance of being obese than one with lower intelligence. The States with the lowest IQ people having those with the highest BMIs corroborates this. In America, obesity rates by ethnicity are as follows: 67.3% for whites, 75.6% for blacks, and 77.9% for ‘Hispanics’.
Now that we know the average intelligence rates by State, the percentage of obese by State and the demographics by State, we can get into why obesity rates correlate with intelligence and race.
Diaz et al (2005) showed that minority populations are more likely to be affected by diabetes mellitus which may be due to less healthy diets and/or genetic factors. Using the National Health and Nutrition Survey for 1999-2000, they analyzed overweight, healthy adults, calculating dietary intake variables and insulin sensitivity by ethnicity. They characterized insulin resistance with fasted insulin, as those who are more likely to become insulin resistant have higher fasted insulin levels (levels taken after waking, with the subject being told not to eat the night before as to get a better reading of fasted insulin levels). Non-‘Hispanic’ whites had higher energy and fat intake while ‘Hispanics’ had higher carb intake with blacks having lower fiber intake. Blacks and ‘Hispanics’ were more likely to have lower insulin sensitivity. However, ‘Hispanics’ were more likely to have lower insulin sensitivity even after controlling for diet, showing that metabolic differences exist between ethnicities that affect carbohydrate metabolism which leads to higher rates of diabetes in those populations.
Drewnowski and Specter (2004) showed that 1) the highest rates of obesity are found in populations with the lowest incomes and education (correlated with IQ), 2) an inverse relationship between energy density and energy cost, 3) sweets and fats have higher energy density and are more palatable (food scientists work feverishly in labs to find out different combinations of foods to make them more palatable so we will eat more of them), and 4) poverty and food insecurity are associated with lower food expenditures, lower fruit and vegetable intake, and lower-quality diet. All of these data points show that those who are poor are more likely to be obese due to more energy-dense food being cheaper and fats and sugars being more palatable.
Now that I’ve shown the relationship between race and IQ by state, obesity rates by state, insulin sensitivity by race, and that those in poverty are more likely to be obese, I can now talk about the actual CAUSE of obesity: insulin.
The conventional wisdom is that if you consume more kcal than you expend, you will gain weight, whereas if you consume less than your daily needs you will lose weight. This has been unchallenged for 50 years. Also known as Calories In and Calories Out (CICO), this mantra “eat less and move more!!!” has been bleated over and over with horrendous results. The CICO model only concerns itself with calories and not insulin which is a causal factor in obesity.
In this study, participants in the basal insulin group which received the lowest average insulin dose gained the least average amount of weight at 4.2 pounds. Those on prandial insulin gained the most weight at 12.5 pounds. The intermediate group gained 10.3 pounds. More insulin, more weight gain. Moderate insulin, moderate weight gain. Low insulin, low weight gain.
Researchers compared a standard dose of insulin to tightly control blood sugars in type 1 diabetic patients. At the end of the 6 years, the study proved that intensive control of blood sugars resulted in fewer complications for those patients.
Though, in the high dose group, they gained on average 9.8 pounds more than those in the standard group.
More than 30 percent experienced major weight gain! Prior to the study, both groups were equal in weight. But the only difference was the amount of insulin administered. Were the ones given high levels of insulin all of a sudden more lazy? Were those who gained weight suddenly lacking in willpower? Were they lazier before the study? We’re they more gluttonous? No, no, and no!!
(source)
Finally, Henry et al (1993) took Type II diabetics and started them off with no insulin. They went from 0 units of insulin a day to 100 units at 6 months. As higher rates of insulin were administered, weight rose in the subjects. Insulin was given, people gained weight. A direct causal relationship (see figure above). However, what’s interesting about this study is that the researchers measured the amount of kcal ingested, the number of kcal ingested was reduced to 300 per day. Even as they took in less kcal, they gained 20 pounds! What’s going on here? Well, insulin is being administered and if you know anything about insulin it’s one of the hormones in the body that tells the body to either store fat or not burn it for energy. So what is occurring is the body is ramping down its metabolism in order for the subject to store more fat due to the exogenous insulin administered. Their TDEE dropped to about 1400 kcal, while they should have been losing weight on 1700 kcal! The CICO model predicts they should have lost weight, however, adaptive thermogenesis, better known as metabolic slow down, occurred which dropped the TDEE in order for the body to gain fat, as insulin directly causes obesity by signaling the body to store fat, so the body drops its metabolism in an attempt to do so.
Putting this all together, blacks and ‘Hispanics’ are more likely to be in poverty, have lower intelligence, and have higher rates of obesity and diabetes. Furthermore, blacks are more likely to have metabolic diseases (adaptive thermogenesis aka metabolic slowdown is a metabolic disease) which are related with obesity due to their muscle fiber typing which leads to lower maximal aerobic capacity (less blood and oxygen get around the body). Type II skeletal muscle fibers’ metabolic profile contributes to lower average aerobic capacity in blacks. It also is related to cardiometabolic diseases, in my opinion because they don’t have the muscle fiber typing to run long distances, thus increasing their aerobic capacity and VO2 max.
Due to the diets they consume, which, due to being in poverty and having lower intelligence, they consume more carbohydrates than whites, which jacks their blood glucose levels up and the body then releases insulin to drive the levels glucose in the body down. As insulin levels are spiked, the body becomes insulin resistant due to the low-quality diet. Over time, even a change in diet won’t fix the insulin resistance in the body. This is because since the body is insulin resistant it created more insulin which causes insulin resistance, a vicious cycle.
Poverty, intelligence and race both correlate with obesity, with the main factor being lower intelligence. Since those with lower IQs have a lack of foresight into the future, as well as a lower ability to delay gratification which also correlates with obesity, they cannot resist low-quality, high-carb food the same way one with a higher IQ can. This is seen with the Diaz et al study I linked, showing that whites have higher levels of fat intake, which means lower levels of carbohydrate intake in comparison to blacks and ‘Hispanics’. As I’ve shown, those in poverty (code word for low intelligence) ingest more refined carbohydrates, they have higher levels of obesity due to the constant spiking of their insulin, as I have shown with the 3 aforementioned studies. Since blacks and ‘Hispanics’ have lower levels of intelligence, they have lower levels of income which they then can only afford cheap, refined carbs. This leads to insulin being constantly spiked, and with how Americans eat nowadays (6 times a day, 3 meals and snacks in between), insulin is being spiked constantly with it only dipping down as the body goes into the fasted state while sleeping. This is why these populations are more likely to be obese, because they spike their insulin more. The main factor here, of course, is intelligence.
Another non-CICO cause for obesity is exposure to BPA in the womb. Researchers carried out BPA testing in three differing subjects: 375 babies invitro, (3rd trimester) children aged 3 (n=408) and aged 5 (n=518) (Hoepner, et al, 2016). They measured the children’s bodies as well as measuring body fat levels with bioelectrical impedance scales.Prenatal urinary BPA was positively associated with waist circumference as well as fat mass index, which was sex-specific. When analyzed separately, it was found that there were no associated outcomes in body fat for boys (however it does have an effect on testosterone), but there was for girls (this has to do with early onset puberty as well). They found that after controlling for SES and other environmental factors there was a positive correlation with fat mass index – a measure of body fat mass adjusted for height, body fat percentage and waist circumference. The researchers say that since there was no correlation between BPA and increased obesity, that prenatal exposure to BPA indicates greater vulnerability in that period. The sample was of blacks and Dominicans from New York City. Whites drink less bottled water, which has higher levels of BPA. Blacks and ‘Hispanics’ consume more, and thus have higher levels of obesity.
In conclusion, blacks and ‘Hispanics’ are more likely to be in poverty, have lower intelligence, higher rates of obesity and lower incomes. Due to lower incomes, cheap, refined carbohydrates is what they can afford in bulk as that’s mostly what’s around poor neighborhoods. Ingesting refined carbohydrates more often consistently jacks up blood glucose which the body then releases insulin to lower the levels. Over time, insulin resistance occurs, which then leads to obesity. As I’ve shown, there is a direct causal relationship between the amount of insulin administered and weight gain. With the aforementioned factors with these two populations, we can see how the hormonal theory of obesity fits in perfectly with what we know about these ethnic groups and the obesity rates within them. Since people in poverty gravitate more towards cheap and refined carbohydrates, they’re constantly spiking their insulin which, over time, leads to insulin resistance and obesity.
Muscle Fiber Typing and Race: Redux
I recently blogged on Muscle Fiber Typing, HBD, and Sports. I showed that differences in which race wins at what competition comes down to ancestry, which then correlates with muscle fiber typing. I came across this paper, Black and White race differences in aerobic capacity, muscle fiber type, and their influence on metabolic processes, today which, of course, proved my point on muscle fiber typing.
The authors say that obesity is a known risk factor of cardiometabolic disease (though Blüher 2012 says that up to 30 percent of obese patients are metabolically healthy with insulin sensitivity on the same level as thin individuals) and that cardio can reduce excess adipose tissue (this isn’t true either), maintains weight (maybe) and reduces the risk of obesity (it doesn’t) and cardiometabolic disease (this is true). The two major determinants of aerobic capacity are muscle fiber typing and “the capacity of the cardiorespiratory system to deliver nutrient-rich content to the muscle”. As I said in my previous article on muscle fiber typing, depending on which fibers an individual has determines whether or not they are predisposed to being good at endurance sports (Type I fibers) or being good at explosive sports (Type II fibers). Recent research has shown that blacks fiber typing predisposes them to a lower overall VO2 max.
VO2 max comes down to a strong oxygen support system and the capacity to contract a large number of muscle fibers at once, both of which are largely genetic. Lactic acid makes us tired, the best way to train is to minimize lactic acid production and maximize lactic acid removal during exercise. High-Intensity Interval Training, or HIIT, achieves this. The more O2 consumed during exercise, the less of a reliance there will be on the anaerobic breakdown of CHO to lactic acid.
Along with inadequate exercise, these variables place blacks at an increased risk for obesity as well as other negative metabolic factors in comparison to other races/ethnic groups. The author’s purpose of the review was to show how skeletal muscle fiber typing contributes to obesity in non-“Hispanic” black populations.
The review indicates that the metabolic properties of Type II fibers (reduced oxidative capacity, capillary density, which is a physiological measure that takes a cross-section of muscle and counts the number of blood vessels within. The measurement can be considered an indicator of physical health and is also related to the ability to do strenuous activity) are related to various cardiometabolic diseases.
Since non-“Hispanic” blacks have more Type II fibers on average, they have a lower maximal aerobic capacity. Combined with low Resting Energy Expidenture (REE) and reduced hemoglobin concentration (hemoglobin is a protein in the red blood cells that shuttles oxygen to your tissues and organs and transports carbon dioxide from your organs and tissues back to your lungs), non-“Hispanic” blacks may be predisposed (they are when you look at what the differing skeletal muscle fibers do in the body and if you have a basic understanding of physiology) to a lower maximal aerobic capacity, which contributes to obesity and metabolic disease in the non-“Hispanic” black population.
I have written on ethnicity and obesity last year. In the two racial groups that were tested, American non-“Hispanic” whites and American non-“Hispanic” blacks, what the researchers say holds true.
On the other hand, Kenyans have an average BMI of 21.5. Since we know that a high VO2 max and low BMI are correlated, this is why Kenyans succeed in distance running (along with VO2 max training, which only enhances the genetic effects that are already there).
Moreover, I wrote an article on how Black American Men with More African Ancestry Less Likely to Be Obese. How do we reconcile this with the data I have just written about?
Simple. The population in the study I’m discussing in this article must have had more non-African ancestry than the population that was gathered showing that black American men with more African ancestry are less likely to be obese. The researchers in that study looked at 3,314 genetic markers. They then tested whether sex modifies the association of West African genetic ancestry and body mass index, waist circumference, and waist to hip ratio. Also, they adjusted for income and education as well as examined associations of ancestry with the phenotypes of males and females separately. They conclude that their results suggest that a combination of male gender and West African ancestry is correlated with protection against central obesity and suggests that a portion of the difference in obesity (13.2 percent difference) may be due, in part to genetic factors. The study also suggests that there are specific genetic and physiologic differences in African and European Americans (take that, race-denialists =^) ).
Since both black men and women in America share the same environment, some genetic factors are at play in the differences in obesity rates between the two sexes with more African ancestry for black American men being the main reason.
Finally, I wrote an article on BPA consumption and obesity. The sample was on blacks and Dominicans (they’re black as well) in NYC. It was discovered that babes who were exposed to BPA more in childhood and in the womb had higher chances of being obese. This goes with what the authors of the study I’m citing in this article say. There are numerous environmental factors that pertain to obesity that’s not kcal in/out (which the First Law of Thermodynamics is irrelevant to human physiology). BPA consumption is one of them (as well as a cause for the current and ongoing cucking of Europe). Whites at all age groups drink more tap water. Blacks and ‘Hispanics’ were pretty much even in consumption of bottled water. Bottled water has BPA in the plastic, and since they drink more bottled water, they run the risk of their children being more prone to obesity due to the negative effects of BPA in the human body.
In sum, blacks are more likely to be faster due to their fiber typing, but are also more likely to be obese (in this sample, anyway which I assume was a mix of men and women. I will update this article when I find and read the full paper). They also run a higher risk of having related diseases, most notably due to a lower REE (showing they don’t walk around as much, since too much sitting increases mortality EVEN WITH EXERCISE. So if you have a desk job and don’t do any other physical activity and enjoy living, do more LISS, low-intensity steady-state cardio). These factors also, in part, explain why blacks have higher rates of hypertension (with Sickle Cell Anemia being another cause since when the blood is sickle-shaped, they crowd in the blood vessels causing blockage in the veins which leads to strokes and other diseases). The more the genetic factors that predispose people to obesity are understood (let’s be real here, there ARE genetic correlates with obesity), the better we can help those who suffer from the condition.
Myopia, IQ, and Race
1200 words
We’ve all heard of the nerd stereotype. One of the main ones is that nerds wear glasses. However, as most of my readers may know, stereotypes are based on fact more often than not. From the black criminal and sprinter, to the hyper-intelligent East Asian, to the intelligent and creative Europeans, we see that these so-called ‘stereotypes’ arise because stereotypes are actually average traits. Therefore, this ‘nerd stereotype’ that they always wear glasses is based on averages, so there must be a genetic component behind it. In this article I will talk about the genetics of myopia, reasons why researchers believe it arises, and racial differences in the prevalence of myopia.
Myopia, better known as nearsightedness, has a pleiotropic relationship with intelligence. Pleiotropy is the single gene or set of genes controlling multiple, possibly unrelated, phenotypic traits. So if the two traits are correlated, then there is a good chance that if one wears glasses they may have higher average intelligence.
Rosner and Belkin (1987) found that the prevalence of myopia was higher in more intelligent and educated groups. They found a strong association between the rate of myopia, years of schooling and intelligence level. Schooling and intelligence weigh equally with myopia, showing that those who are myopic tend to stay in school longer and are more intelligent than average.
Saw et al (2004) show that there may be similar genes associated with eye growth or size (myopia) and neocortical size (*possibly* correlated with IQ, we know it is). This is exactly what Cohn, Cohn, and Jensen found in 1987; that there was a pleiotropic relationship between IQ and myopia. One set of genes controls one or multiple phenotypic traits. They also say that nonverbal IQ is correlated with myopia in the Singaporean cohort independent of near work from the children (such as reading). Nonverbal IQ may be an independent risk factor of myopia independent of books read per week. They conclude that more research needs to be taken out to untangle the cause and effect of the myopia/intelligence/reading relationship.
Mirashi et al (2014) show in a sample of 4600 myopia-inflicted Germans between the ages of 35 and 74 that about 53 percent of the sample had graduated from college compared to 24 percent of the sample who didn’t go to school past high school. They, too, conclude that higher levels of myopia are associated with higher educational achievement and post-school professional achievement and that those who were myopic had higher levels of educational achievement than those in the sample who weren’t myopic.
More recently, Verma and Verma (2015) state that there is evidence that both genetic and environmental factors play a role in the prevalence of myopia. Moreover, Czepida, Lodykowska, and Czepita (2008) come to the same conclusion; that children with myopia have higher IQs and was verified in other countries (the USA, the Czech Republic, Denmark, Israel, New Zealand).
The correlation between myopia and IQ is between .2 and .25 (Jensen, 1998 b; 149). Jensen writes on page 150:
. . .the degree of myopia was measured as a continuous variable (refraction error) by means of optical techniques in a group of sixty adolescents selected only for high IQs (Raven matrices) and their less gifted full siblings, who averaged fourteen IQ points lower, a difference equivalent to 0.92o. The high-IQ subjects differed significantly from their lower-IQ siblings in myopia by an average of 0.39a on the measure of refraction error.1161 In other words, since there is a within-families correlation between myopia and IQ, the relationship is intrinsic. However, it is hard to think of any directly functional relationship between myopia and IQ. The data are most consistent with there being a pleiotropic relationship. The causal pathway through which the genetic factor that causes myopia also to some extent elevates g (or vice versa) is unknown. Because the within-family relationship of myopia and IQ was found with Raven’s matrices, which in factor analyses is found to have nearly all of its common factor variance on g ,n it leaves virtually no doubt that the IQ score in this case represents g almost exclusively. (emphasis his)
Therefore, as noted earlier, we would see a slight variation in the general population between those with high IQs and those who wear glasses and are myopic.
Jensen also talks about race and myopia. He says that Asians have the highest rates of myopia, while blacks have the lowest rate and whites have a rate slightly higher than blacks.
In a tribute to Arthur Jensen, edited by Helmuth Nyborg, it states that East Asians have the highest rates of myopia, with blacks having the lowest rate and whites being intermediate (Rushton’s Rule of Three). Ashkenazi Jews have a rate of myopia two times higher than that of gentiles, on par with East Asians. These are yet other biological correlates with the g factor that also lend credence to the hereditarian hypothesis.
Certain types of visual disturbances affect some races more frequently. Asian-Americans, for example, are more likely to be near-sighted than Caucasians or African-Americans. African-Americans have the lowest incidence of near-sightedness, but are more prone to cataracts and some other eye diseases. Eye problems, including the need to wear glasses, also can run in families.
Of course, if myopia is a pleiotropic trait (there is good evidence that there is), and wearing glasses runs in families as well as high intelligence, it can be safely hypothesized that the two indeed do have a relationship with each other. The biological correlates show enough that these traits, too, follow Rushton’s Rule.
Finally, Au, Tay and Kim (1993) present data that shows the prevalence and severity of myopia is associated with higher education. They also report on data that Rosner and Belkin reported the prevalence of myopia in males with and IQ of 80 or less was 8 percent while the rate increased up to 27.3 among those with an IQ of 128 or higher. Reported separately, it was concluded that the myopia rates in the cohort of 110,236 young Singaporean males correlated with race (Au, Tay, and Lim, 1993). The myopia rate for the Chinese was 48.5 (IQ 105), for Eurasians it was 34.7, for Indians it was 30.4 (IQ 82), and for Malays it was 24.5 (IQ 92). It’s worth noting that India’s IQ is depressed by disease and bad nutrition, and if this were to be ratified their IQ would be around 94. So this, again, shows the biological correlate with IQ and myopia as it’s showing on the Indians’ genotype.
The association between myopia and intelligence isn’t definite yet, however with more studies looking into the relationship between these variables I believe it will be concrete that those who are more myopic tend to have higher IQs due to the pleiotropic nature of IQ and myopia. Since reading is heritable, those with higher IQs as children tend to read more as adults, and the racial gradient is noticed in children, it’s pretty safe to say that myopia and IQ are linked pleiotropically and give more credence to the hereditarian hypothesis. Most studies find a statisically positive correlation between myopia and intelligence. Along with the racial disparities in myopia as well as intelligence, it’s pretty safe to say that the relationship is genetic and pleiotropic in nature since the races also differ in these variables.
Muscle Fiber Typing, HBD, and Sports
1850 words
With the Olympics currently happening, I figured I’d talk about muscle fiber typing and how it plays a factor in who wins what competition. First I’ll go through both fiber typings and what they mean for each sport. Then I will go through some of the most well-known sports and show how and why certain races dominate in different sports.
Muscle fiber typing
There are two types of muscle fibers: Type I fibers (slow twitch) and Type II fibers (fast twitch). Each fiber fires off through different pathways, whether they be anaerobic or aerobic. The body uses two types of energy systems, aerobic or anaerobic, which then generate Adenosine Triphosphate, better known as ATP, which causes the muscles to contract. Depending on the type of fibers an individual has dictates which pathway muscles use to contract which then, ultimately, dictate if there is high muscular endurance or if the fibers will fire off faster for more speed.
Type I fibers lead to more strength and muscular endurance as they are slow to fire off, while Type II fibers fire quicker and tire faster. Slow twitch fibers use oxygen more efficiently, while fast twitch fibers do not burn oxygen to create energy. Slow twitch muscles delay firing which is why the endurance is so high in individuals with these fibers whereas for those with fast twitch fibers have their muscles fire more explosively. Slow twitch fibers don’t tire as easily while fast twitch fibers tire quickly. This is why West African blacks and their descendants dominate in sprinting and other competitions where fast twitch muscle fibers dominate in comparison to slow twitch.
Usain Bolt, who just won the 100m dash the other day, has fast twitch fibers (Type II) due to a gene called ACTN3 which is associated with elite athletic performance. West African blacks and their descendants have this gene. For example, 70 percent of Jamaicans have the ACTN3 gene, and this gene is why Usain Bolt is the world’s fastest man.
Though at the same time, West Africans and their descendants suffer in competitions where muscular endurance is needed (swimming is one of them). Caucasians Asians and East Africans have more slow twitch fibers (Type I fibers) which allows them to dominate in competitions where endurance is needed (weightlifting, Strong Man, distance running, swimming).
There are physiological differences found in the winners of these competitions, and like most things, there is a racial basis to them.
Sports
As noted above, West Africans and their descendants dominate competitions in which their muscle fibers are best put to use (sprinting, football, basketball, etc) while they suffer in competitions in which Caucasians and Asians dominate in which muscular endurance is needed (weightlifting, powerlifting, distance running).
World’s Strongest Man
Muscle fiber typings play a major part in the winners of these competitions as does limb length. Generally, the winners of the World’s Strongest Man (WSM) are more stocky and have shorter limbs which translates into more power generated since the distance is shorter.
A white man has won the WSM competition every year since its inception. It’s always a Northern or Easter European who wins these competitions. The Russians and Slavs are known for their crazy squat programs, and muscle fiber typing is the reason why. They are able to generate more power than those with fast twitch fibers which translates into domination in strength-based competitions.
The same thing is noticed in powerlifting. Caucasians and Asians dominate. I’ve seen some incredibly strong East Asian powerlifters, and the reason is they are shorter and stockier with shorter limbs. More power is able to be generated with the shorter distance and Type II fibers which allow these populations to excel in these types of competitions.
I hypothesize that just like West Africans and their descendants consistently win sprinting competitions due to their genes and fiber typing, this is the same reason why Europeans consistently win WSM. Though, PumpkinPerson thinks differently about this.
PP believes that since Africans have higher testosterone, then they, therefore, should dominate in these types of competitions. His reasoning is based on Rushton’s Rule of Three, which all though it holds well for a wide variety of variables, it doesn’t hold with more complex traits such as muscle fiber typing.
PP cites a study stating that blacks out benched whites in the beginning and end of the study. However, it seems this is anomalous. The researchers say this is the only study looking at this, and from what I can tell, they didn’t ask about dietary and or exercise habits. They also say that blacks were heavier in BMI at the onset, but not in the follow-up.
I’d like to see another study like this before any conclusions are drawn. Because what I see in actual powerlifting competitions from people who go above and beyond their genetic potential when everyone is using, Caucasians (whites, MENA people) and East Asians are consistently always stronger than blacks. From what we see from actual competitions, Caucasians and Asians dominate these competitions. Africans are really nowhere to be found. In fact, Kenya is the only sub-Saharan African country to place in the top 3 in the WSM, which strengthens my theory on muscle fiber typing and strength-based competitions since they have slow twitch fibers.
PP then writes another article saying that from 1938 to 1953 the WSM was a black man named John Henry Davis. He was known as the WSM from those years, but as we know, exceptions don’t prove rules.
Mark Henry is a better example. Genetic freak of nature. World record total in squat, bench and deadlift; he was a squatting 600 pounds as a freshman; as a teenager, he had the 8th best total regardless of age group.
He’s a genetic freak of nature. He’s way stronger than the guy you cited. Mark Henry is one of the strongest people to ever live. He is a freak of nature. I can’t emphasize that enough.
Sprinting
West Africans and their descendants excel at sports where their muscle fiber typing is put to good use. The ACTN3 gene, as noted above, has a lot to do with their success in these competitions but it doesn’t tell the whole story. Sprinters have long limbs, which allow them to cover a greater distance with each stride in comparison to another with shorter limbs. Sprinters also have lower levels of body fat which translates to more speed. Where these lower levels of body fat make have them suffer in swimming competitions since fat floats, this helps in sprinting competitions due to less fat mass.
Swimming
For those of you who are keeping up with the Olympics, you may have heard of Robel Kiros Habte. He finished with the worst time out of the 59 contestants and was only there due to an invitation extended to him by the International Swimming Federation who chooses people from countries that are underrepresented in the Games. This invitation shows that even the ‘best’ in their country is nowhere near good enough versus the best in the world.
But on the other hand, for the first time in history, swimmer Simone Manuel became the first black American to win gold in the 100m freestyle. There’s a first time for everything and exceptions don’t disprove rules.
Of course, Michael Phelps speaks for himself, with his 23rd gold medal win which broke a record that was standing for 2168 years.
Bodybuilding
Blacks dominate in American bodybuilding. This is due to them having lower fat-free body (FFB) and being more mesomorphic on average.
The winner of Mr. Olympia for the five years in a row is Phil Heath (who will win a sixth title next month during the Olympia). Blacks have consistently been in the top running in the IFBB (International Federation of Bodybuilding). This is due to their muscle insertions and lower average fat-free body that allows a high percentage of blacks to compete. Moreover, I’d say that genetically speaking, blacks have a better chance to win over whites since they have a more sculpted physique naturally, which comes down to evolutionary selection
Some people may say that the above sports are tainted due to performance enhancing drug (PED) use. Though what they fail to realize is that drugs take you above and beyond your genetic limit. These people are already genetic freaks of nature and taking drugs just makes them that much better. You can’t take someone with garbage genetics, have him shoot up for years and bust his ass in the gym to be Mr. Olympia. Just like you can’t take someone with garbage genetics and the wrong proportions, inject them with PEDs and expect them to do well in powerlifting and Strongman competitions. The genetic potential is already there in these athletes and PEDs take them above and beyond what is naturally possible.
Strength and Mortality
Finally, to round this up, there is a correlation between strength and mortality. With a sample of 8762 men between the ages of 20 and 80, it was found that muscular strength was inversely and independently associated with death from all causes and cancer in men even after adjusting for cardiorespiratory fitness and other possible confounders. From the discussion of the paper:
The analysis on the combined effects of muscular strength and cardiorespiratory fitness with all cause mortality showed that the age adjusted death rate in men with high levels of both muscular strength and cardiorespiratory fitness was 60% lower (P<0.001) than the death rate in the group of unfit men with the lowest levels of muscular strength. These results highlight the importance of having at least moderate levels of both muscular strength and cardiorespiratory fitness to reduce risk of death from all causes and cancer in this population of men.
The point of bringing this paper up is that Caucasians and Asians are stronger than blacks, and also live longer. This is just like the correlation between IQ and life expectancy. Since men with higher levels of strength live longer than men with lower levels of strength, this strengthens my hypothesis for strength-based competitions and the racial mix of the competitions. Caucasians and East Asians, who have higher IQs than blacks, are also stronger than them on average, which also correlates with life expectancy.
(For more information see Steve Sailer’s post on West African and East Africans in sprinting and distance running as well as Razib Khan’s post on West Africans and their domination of sprinting competitions.)
Conclusion
HBD is evident in all of our lives. Though many of us don’t bring it up, it’s evident in the sports we watch to everyday life. The reason why there are racial disparities in the upper echelons of professional sports has to do with muscle fiber typing as well as those who are genetically predisposed to do well in these competitions. West Africans dominate in sprinting competitions and others where they are able to use their longer limbs and fast twitch fibers whereas Caucasians and Asians dominate in strength sports due to their limb length and slow twitch fibers. Professional sports proves what is evident in our everyday lives and, subconsciously at least, the average person sees this.
Dysgenic Fertility and America’s Obesity Crisis
1050 words
The dysgenic trend currently occurring in America has implications for obesity as well. Since intelligence is negatively correlated with obesity, as America’s average IQ decreases, the rates of obesity in our country will increase. This is due to the high correlation between intelligence and obesity. As we continue to allow unfettered immigration into America, the average IQ of the country will decrease, while the amount of people that are overweight and obese will increase.
The ethnic differences in obesity rates lead more credence to what I am saying. As the demographics shift, more people will be overweight or obese due to having a lower IQ. Whites, too, are experiencing this dysgenic effect, as intelligent people of all ethnicities are not reproducing. As more and more genetically less fit individuals continue to have a higher rate of reproduction in comparison to intelligent individuals, this crisis will continue to persist.
Those with lower intelligence have less of an ability to delay gratification, which has a strong genetic component. As more people breed who cannot delay their gratification, the rates of obesity will increase in the country. Of course, the lack of ability to delay gratification comes with a lowered IQ. This is what we see in regards to sex. Those with higher IQs lose their virginities at a later age in comparison to those with lower IQs. Along with the data from Kanazawa that shows that more intelligent people have a lower BMI than those with lower intelligence, this study gives more credence to the theory that those with higher levels of intelligence can better delay their gratification.
JayMan says that there is evidence for an increased genetic load for those with lower IQs, which we can then reason that this also leads to a higher prevalence for obesity in low IQ populations. JayMan then says that many of the genes found to influence obesity seem to operate in the brain and that they have a pleiotropic effect, meaning that multiple genes affect one or more traits. With the increased genetic load comes with an increased chance to have a lower IQ and become obese, as these two things correlate with the lack of ability to delay gratification.
Of course, these problems persist due to modern medicine. With the advent of better medicine, it allowed us to beat diseases that formerly would have been devastating to the population at large. This led to an increase of alleles with negative effects in the population that continue to pass down through the generations. Along with these advances in medical technology, welfare and other government-funded programs also enable those that are less genetically fit. Since intelligence is correlated with ability to care for offspring, as well as r- and K-selected traits, those with lower intelligence exhibit more r-selected traits. This is why America is facing a dysgenic fertility crisis. Welfare props up those with less intelligence, giving them more incentives to breed. They then breed more low IQ children who then will live off of the government. This vicious cycle then continues unfettered due to how America’s dysgenic welfare structure is implemented.
Before the advent of modern technology, those who were less genetically fit didn’t survive to pass on their genes. But, in the modern day with all of our superior technology, this allows the less intelligent to breed when in the past they would have been selected out of the gene pool due to being less biologically fit.
Another variable that is involved with the dysgenic fertility of America is Mexican immigration. With the influx of illegal (and legal) peoples from the South of the Border, this is having both dysgenic effect on both the average intelligence of our country along with the average BMI. The average BMI for the average American male is 28.6. In the 1950s, 10 percent of American adults were obese compared to 35 percent of American adults today. Now, this has to do with ability to access food, as well as the effect of the media on children has a huge effect on obesity, due in part to not getting a full nights sleep, as that is correlated with obesity. However, an increase in genetic load, which also comes with a decrease in intelligence, has a lot to do with this as well. The increase in the BMI of the average American has to do with immigration as well. The rates of obesity for different ethnicities in America are as follows: 67.3% for whites, 75.6% for blacks, and 77.9% for ‘Hispanics’. So of course, with more immigration from the South of the Border, the average IQ for America is decreasing while obesity rates are increasing, due mostly to this illegal immigration.
Height and intelligence are both correlated. Ever since the advent of the industrial revolution, we have had an excess surplus of food. As Gina Kolata says in her book Rethinking Thin, an increase in obesity is inevitable. She says this since the increase in genetic height and IQ has occurred, so the increase in obesity follows with it. We need to influence those with higher IQs to have more children. Further, we also need to restrict immigration to only high-skilled immigrants (only when necessary) to reverse this trend that has been occurring since the 1960s. Though, with higher levels of intelligence one can forgo their urges and live a healthier lifestyle due to having higher cognition which leads to a better ability to delay gratification than one with lower intelligence.
Those with higher IQs make better choices on what to eat than those with lower IQs. This is shown in the BMIs of the intelligent and non-intelligent population. As more and more people with lower genotypic IQ come into the country, the quality of life will decrease as will the average intelligence of the country. In turn, the BMI of the average American will increase along with the decrease of our country’s average intelligence. To ameliorate this, we need to have extremely stringent criteria on who we allow into the country. An IQ test, to start, would be a good idea. As those with higher intelligence have less of a genetic load and have less of a chance of becoming obese than one with a lower IQ, the current dysgenic effect that this unfettered immigration is having on America can be lessened.

2650 words
I first heard of Guns, Germs, and Steel (GGS) a few years ago while in a discussion about racial differences and their causes. The person linked me to the Wikipedia page on GGS. I then looked into it and it seemed to be an OK hypothesis. However, after reading the book myself and then reading critiques he got on it, it’s clear that Jared Diamond was attempting to pick and choose what to put into the book to come to the conclusions he already has come to. There are some interesting tidbits in the books, my favorite being only 14 beasts of burden have been tamed for human use out of 148 large wild creatures that can be tamed. Other than that, he spins facts and data from hereditarians to suit his own agenda.
Jared Diamond started wondering about the reasons for human inequalities after his New Guinean friend, Yali, asked Diamond why Westerners had so much more “cargo” (material possessions) than the New Guineans. Diamond then set forth to find out why human inequality existed. Diamond attempts to say that immediate environment and only environment is the cause of racial inequalities. However, what Diamond fails to say is that genetic isolation over thousands of years is the cause of racial differences in intelligence, muscle fiber typings, crime differences, age of first period, sleep, obesity and metabolic differences, racial/sex differences in testosterone, differences in climate which, over tens of thousands of years cause distinct phenotypic/genotypic differences, child rearing and age of first birth, slow and fast life history (r/K selection), etc. He also fails to bring up brain size differences between races/ethnicities. All of these factors are responsible for racial/ethnic inequalities.
Diamond’s main thesis in GGS is that human inequalities all boil down to amount of resources in the land and how they are able to be used with the geography of the area. He never brings up brain size as it pertains to modern-day humans, EXCEPT in regards to New Guineans and how they are more intelligent than Europeans: (Diamond, 1997: 20, 36, 38, 40, 159, 198, 260):
This is laughable. To say that a tropical people, pretty much isolated from the rest of the world is more intelligent than Europeans is not true at all. Just as Robert Sternberg’s Triarchic Theory of Intelligence fails to explain away racial/ethnic differences in intelligence, so does Diamond’s. Jared Diamond clearly, by his own admission, wants to prove that these differences between humans only come down to immediate environment and are not genetic in nature. The fact that Diamond says that New Guineans are “probably superior to Westerners” … “escaping the devastating developmental damages under which most children in industrialized societies now grow up” shows how biased he is with this whole entire book. IQ tests are great predictors of g, general intelligence, and Westerners clearly are superior in terms of intelligence in comparison to New Guineans. Yea, you can’t build a shelter like they can and you look stupid to them because you can’t do what they can in their society. Duh, of course. The fact that he uses that as any type of evidence or revelation that New Guineans are smarter than Westerners is a wrong and 100 percent ideologically driven statement.
Rushton had some nice words for Diamond on brain size, intelligence: