
By Afrosapiens, 2851 words
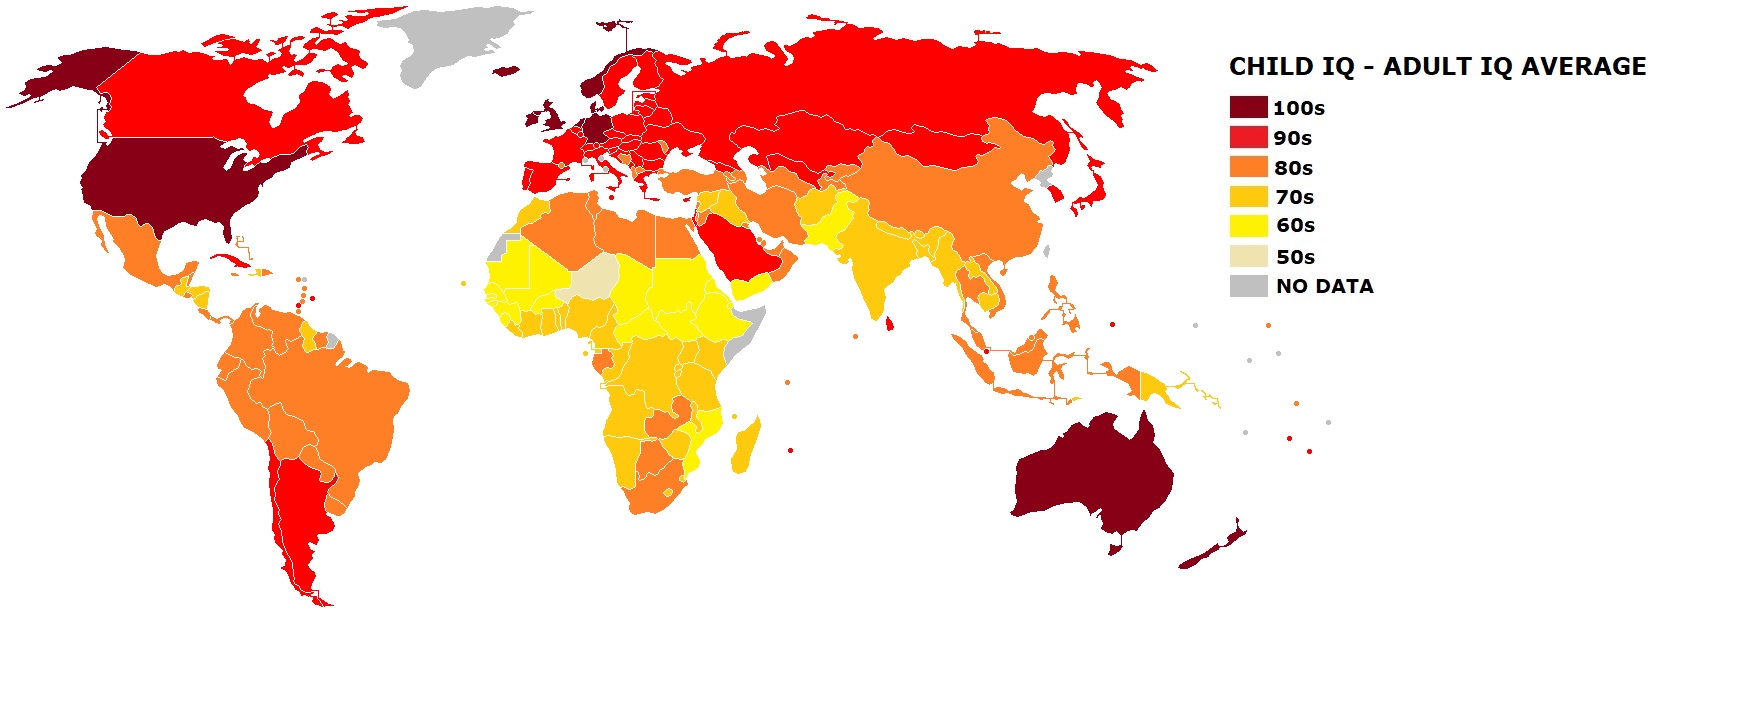
One of the leading theories to explain differences in cognitive test performance between time and place is that intelligence as measured by such tests is affected by exposure to formal schooling and the cognitive demands of a high-technology society (D. Marks, JR. Flynn). One of the strongest evidence for such an effect of schooling on IQ comes from a reform in the Norwegian school system in which an expansion of compulsory schooling was associated with a 3.7 points increase in IQ per additional year of education between pre-reform and post-reform cohorts. In order to test this relationship between years of schooling and commonly reported national IQ averages, I used data from the United Nation’s Development Program to estimate the average IQ of each country’s adult and school-age population. Adult IQs were estimated from mean years of schooling completed by adults aged 25 and older whereas School-population IQs were estimated based on the expected years of schooling that a student is supposed to complete if the enrollment ratios from primary through tertiary education remain constant. All variables were reported in year 2015. Great Britain was chosen as the reference country and assigned a default value of 100 on both variables. For each country, a difference of one year in completed or expected schooling added or removed 3.7 IQ points. Adult IQ and School-age population IQ were averaged to estimate the most probable mean IQ that would be found by randomly reviewing literature without controlling for the age or the health and socio-economic profile of the sampled individuals.
Results
| Country | Main ancestry | School age-Adult IQ average | School age IQ | Adult IQ |
| Australia | West-European | 107 | 115 | 100 |
| Denmark | West-European | 104 | 111 | 98 |
| New Zealand | West-European | 104 | 111 | 97 |
| Iceland | West-European | 103 | 110 | 96 |
| Ireland | West-European | 102 | 109 | 96 |
| Norway | West-European | 101 | 105 | 98 |
| Germany | West-European | 101 | 103 | 100 |
| Netherlands | West-European | 101 | 107 | 95 |
| United States | West-European | 100 | 101 | 100 |
| United Kingdom | West-European | 100 | 100 | 100 |
| Switzerland | West-European | 100 | 99 | 100 |
| Canada | West-European | 100 | 100 | 99 |
| Slovenia | East-European | 100 | 104 | 96 |
| Lithuania | East-European | 99 | 101 | 98 |
| Czech Republic | East-European | 99 | 102 | 96 |
| Estonia | East-European | 99 | 101 | 97 |
| South Korea | North-East Asian | 99 | 101 | 96 |
| Israel | West and Central Asian, North African | 99 | 99 | 98 |
| Sweden | West-European | 98 | 99 | 96 |
| Poland | East-European | 98 | 100 | 95 |
| Finland | East-European | 97 | 103 | 92 |
| France | West-European | 97 | 100 | 94 |
| Japan | North-East Asian | 97 | 96 | 97 |
| Latvia | East-European | 96 | 99 | 94 |
| Belarus | East-European | 96 | 98 | 95 |
| Greece | East-European | 96 | 103 | 90 |
| Hungary | East-European | 96 | 97 | 95 |
| Spain | West-European | 96 | 105 | 87 |
| Hong Kong | North-East Asian | 96 | 98 | 94 |
| Austria | West-European | 96 | 99 | 93 |
| Italy | West-European | 96 | 100 | 91 |
| Slovakia | East-European | 96 | 95 | 96 |
| Argentina | West-European | 95 | 104 | 87 |
| Singapore | North-East Asian | 95 | 97 | 94 |
| Liechtenstein | West-European | 95 | 94 | 97 |
| Russia | East-European | 95 | 95 | 95 |
| Kazakhstan | West and Central Asian, North African | 95 | 95 | 94 |
| Ukraine | East-European | 94 | 96 | 93 |
| Palau | South-East Asian and Polynesian | 94 | 93 | 96 |
| Croatia | East-European | 94 | 96 | 92 |
| Montenegro | East-European | 94 | 96 | 93 |
| Chile | West-European | 94 | 100 | 87 |
| Georgia | West and Central Asian, North African | 94 | 91 | 96 |
| Cyprus | East-European | 93 | 93 | 94 |
| Luxembourg | West-European | 93 | 91 | 95 |
| Malta | West-European | 93 | 94 | 93 |
| Bulgaria | East-European | 93 | 95 | 91 |
| Barbados | Black African | 93 | 96 | 90 |
| Fiji | South-East Asian and Polynesian
South Asian |
93 | 96 | 90 |
| Cuba | West-European | 93 | 91 | 94 |
| Saudi Arabia | West and Central Asian, North African | 93 | 99 | 86 |
| Portugal | West-European | 92 | 101 | 84 |
| Romania | East-European | 92 | 94 | 91 |
| Tonga | South-East Asian and Polynesian | 92 | 93 | 92 |
| Serbia | East-European | 92 | 93 | 91 |
| Belgium | West-European | 91 | 90 | 93 |
| Sri Lanka | South Asian | 91 | 91 | 91 |
| Mongolia | North-East Asian | 91 | 91 | 87 |
| Grenada | Black African | 90 | 98 | 83 |
| Mauritius | South Asian | 90 | 96 | 84 |
| Uzbekistan | West and Central Asian, North African | 90 | 85 | 95 |
| Uruguay | West-European | 90 | 97 | 83 |
| Armenia | West and Central Asian, North African | 90 | 87 | 93 |
| Brunei | South-East Asian and Polynesian | 89 | 95 | 84 |
| Azerbaijan | West and Central Asian, North African | 89 | 87 | 92 |
| Bahrain | West and Central Asian, North African | 89 | 93 | 86 |
| Andorra | West-European | 89 | 90 | 89 |
| Kyrgyzstan | West and Central Asian, North African | 89 | 88 | 91 |
| Albania | East-European | 89 | 92 | 86 |
| Moldova | East-European | 89 | 83 | 95 |
| Venezuela | West-European | 89 | 93 | 86 |
| Trinidad and Tobago | Black African
South Asian |
89 | 87 | 91 |
| Bahamas | Black African | 89 | 87 | 91 |
| Iran | West and Central Asian, North African | 89 | 94 | 83 |
| Seychelles | Black African
South Asian West-European |
89 | 92 | 86 |
| Belize | Black African
Native American |
88 | 87 | 90 |
| South Africa | Black African | 88 | 88 | 89 |
| Malaysia | South-East Asian and Polynesian | 88 | 88 | 88 |
| Bosnia | East-European | 88 | 92 | 84 |
| Samoa | South-East Asian and Polynesian | 88 | 87 | 89 |
| Jordan | West and Central Asian, North African | 88 | 88 | 88 |
| Qatar | West and Central Asian, North African | 88 | 89 | 87 |
| Brazil | West-European | 88 | 96 | 79 |
| Costa Rica | West-European | 88 | 92 | 83 |
| Panama | Native American | 88 | 88 | 87 |
| United Arab Emirates | West and Central Asian, North African | 87 | 89 | 86 |
| Turkey | West and Central Asian, North African | 87 | 94 | 80 |
| Peru | Native American | 87 | 89 | 84 |
| Saint Lucia | Black African | 87 | 88 | 85 |
| Jamaica | Black African | 87 | 87 | 86 |
| Macedonia | East-European | 86 | 87 | 86 |
| Ecuador | Native American | 86 | 91 | 82 |
| Algeria | West and Central Asian, North African | 86 | 93 | 82 |
| Saint-Kitts and Nevis | Black African | 86 | 90 | 82 |
| Bolivia | Native American | 86 | 91 | 81 |
| Mexico | West-European | 86 | 89 | 83 |
| Saint Vincent and the Grenadines | Black African | 86 | 89 | 83 |
| Lebanon | West and Central Asian, North African | 86 | 89 | 83 |
| Oman | West and Central Asian, North African | 86 | 90 | 81 |
| Botswana | Black African | 86 | 86 | 85 |
| Palestine | West and Central Asian, North African | 85 | 87 | 84 |
| Tajikistan | West and Central Asian, North African | 85 | 82 | 89 |
| Tunisia | West and Central Asian, North African | 85 | 94 | 77 |
| Thailand | South-East Asian and Polynesian | 85 | 90 | 80 |
| Micronesia | South-East Asian and Polynesian | 85 | 83 | 87 |
| Colombia | West-European | 84 | 90 | 79 |
| China | North-East Asian | 84 | 90 | 79 |
| Philippines | South-East Asian and Polynesian | 84 | 83 | 85 |
| Suriname | South-East Asian and Polynesian
Black African South Asian |
84 | 87 | 82 |
| Dominican Republic | Black African | 84 | 89 | 79 |
| Indonesia | South-East Asian and Polynesian | 84 | 87 | 80 |
| Dominica | Black African | 84 | 87 | 80 |
| Gabon | Black African | 84 | 86 | 81 |
| Libya | West and Central Asian, North African | 84 | 89 | 79 |
| Turkmenistan | West and Central Asian, North African | 84 | 80 | 87 |
| Kuwait | West and Central Asian, North African | 83 | 89 | 78 |
| Vietnam | South-East Asian and Polynesian | 83 | 86 | 80 |
| Paraguay | Native American | 83 | 85 | 81 |
| Egypt | West and Central Asian, North African | 82 | 88 | 77 |
| Kiribati | Melanesian | 82 | 84 | 80 |
| El Salvador | Native American | 81 | 89 | 75 |
| Zambia | Black African | 80 | 86 | 76 |
| Maldives | South Asian | 80 | 87 | 74 |
| Guyana | Black African
South Asian |
79 | 78 | 82 |
| Namibia | Black African | 79 | 83 | 76 |
| Ghana | Black African | 79 | 82 | 76 |
| Cabo Verde | Black African | 79 | 90 | 69 |
| Nicaragua | Native American | 79 | 83 | 75 |
| Swaziland | Black African | 79 | 82 | 76 |
| India | South Asian | 79 | 83 | 74 |
| Zimbabwe | Black African | 79 | 79 | 79 |
| Vanuatu | Melanesian | 78 | 80 | 76 |
| Honduras | Native American | 77 | 81 | 74 |
| Congo | Black African | 77 | 81 | 74 |
| Kenya | Black African | 77 | 81 | 74 |
| Sao Tome and Principe | Black African | 77 | 84 | 70 |
| Morocco | West and Central Asian, North African | 77 | 84 | 69 |
| Guatemala | Native American | 77 | 79 | 74 |
| Timor-Leste | Melanesian | 76 | 86 | 67 |
| Lesotho | Black African | 76 | 79 | 73 |
| Togo | Black African | 76 | 84 | 68 |
| Iraq | West and Central Asian, North African | 76 | 77 | 75 |
| Cameroon | Black African | 76 | 78 | 73 |
| Angola | Black African | 76 | 82 | 69 |
| Madagascar | South-East Asian and Polynesian
Black African |
76 | 78 | 73 |
| Nepal | South Asian | 75 | 85 | 66 |
| Laos | South-East Asian and Polynesian | 75 | 80 | 70 |
| Nigeria | Black African | 75 | 77 | 73 |
| Comoros | Black African | 75 | 81 | 69 |
| DR Congo | Black African | 75 | 76 | 73 |
| Uganda | Black African | 74 | 77 | 72 |
| Bhutan | South Asian | 74 | 86 | 62 |
| Cambodia | South-East Asian and Polynesian | 74 | 80 | 68 |
| Bangladesh | South Asian | 74 | 77 | 70 |
| Malawi | Black African | 73 | 80 | 67 |
| Solomon Islands | Melanesian | 73 | 75 | 70 |
| Equatorial Guinea | Black African | 72 | 74 | 71 |
| Tanzania | Black African | 72 | 73 | 72 |
| Rwanda | Black African | 72 | 80 | 65 |
| Haiti | Black African | 72 | 73 | 70 |
| Liberia | Black African | 72 | 76 | 67 |
| Benin | Black African | 72 | 79 | 64 |
| Papua New Guinea | Melanesian | 72 | 76 | 67 |
| Syria | West and Central Asian, North African | 71 | 73 | 70 |
| Cote d’Ivoire | Black African | 71 | 73 | 69 |
| Myanmar | South-East Asian and Polynesian | 71 | 73 | 68 |
| Afghanistan | West and Central Asian, North African | 70 | 77 | 64 |
| Burundi | Black African | 70 | 79 | 62 |
| Pakistan | South Asian | 70 | 70 | 70 |
| Mauritania | West and Central Asian, North African
Black African |
69 | 71 | 67 |
| Sierra Leone | Black African | 69 | 75 | 63 |
| Mozambique | Black African | 69 | 73 | 64 |
| Senegal | Black African | 68 | 75 | 61 |
| Gambia | Black African | 68 | 73 | 63 |
| Guinea-Bissau | Black African | 68 | 74 | 62 |
| Yemen | West and Central Asian, North African | 67 | 73 | 62 |
| Guinea | Black African | 66 | 72 | 60 |
| Central African Republic | Black African | 66 | 66 | 66 |
| Ethiopia | North-East African | 66 | 71 | 60 |
| Mali | Black African | 65 | 71 | 59 |
| Sudan | North-East African | 65 | 66 | 64 |
| Djibouti | Black African | 64 | 63 | 66 |
| South Sudan | Black African | 63 | 58 | 69 |
| Chad | Black African | 63 | 67 | 59 |
| Burkina-Faso | Black African | 62 | 68 | 56 |
| Eritrea | Northeast-African | 62 | 58 | 65 |
| Niger | Black African | 58 | 60 |
57 |
The values were rounded to the nearest unit.
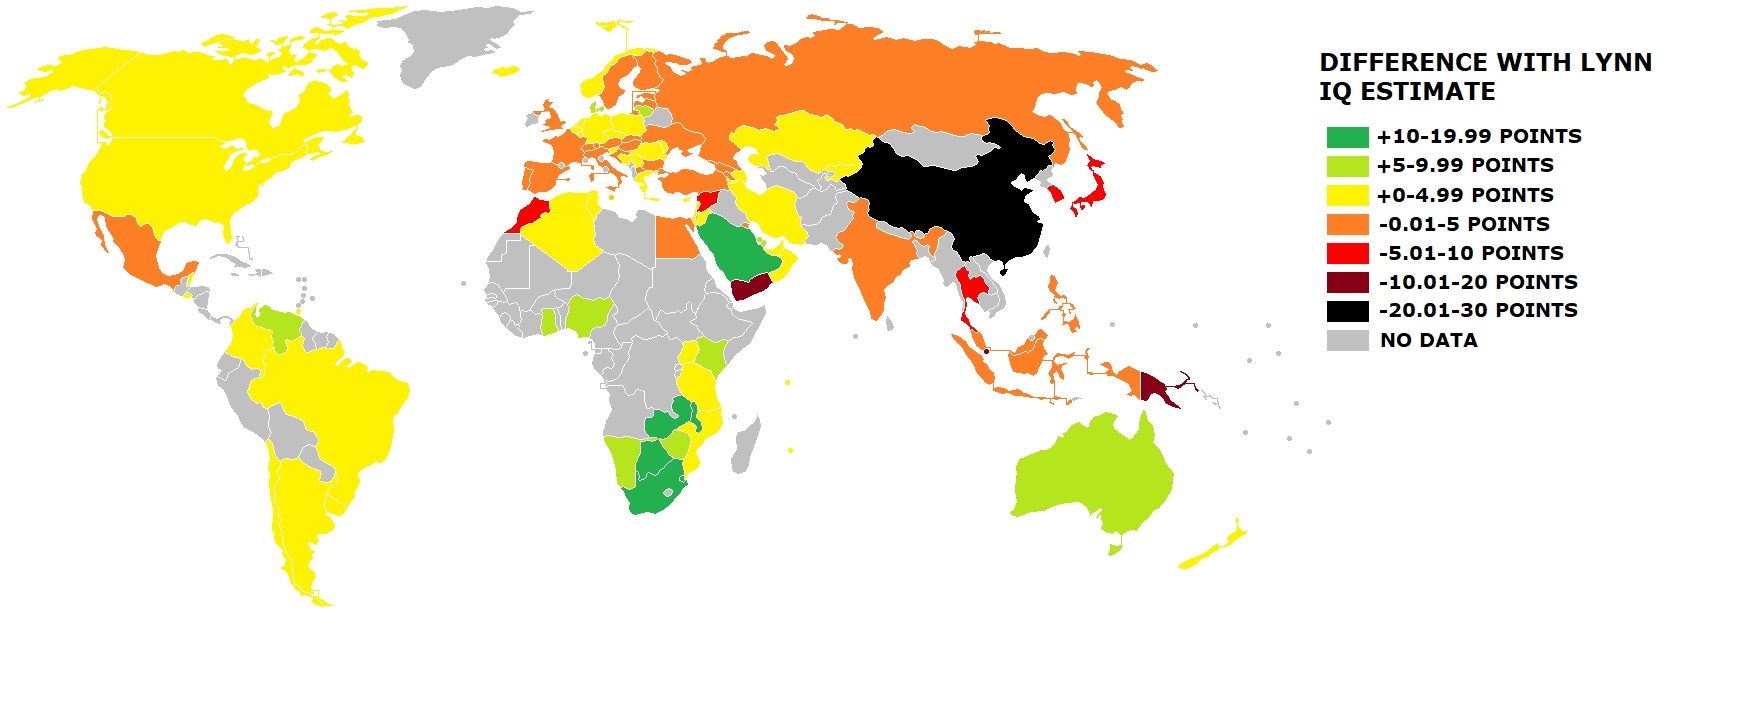
In comparison to the mean national IQs mainly reported by Richard Lynn, 65 countries differed by less than 5 IQ points using the present methodology. It can be said that such small differences validate Lynn’s estimates since it is unlikely that years of education have the same cognitive value in every country and likewise, averaging adult IQ and school-age population IQ without controlling for a country’s age structure somewhat weaken the representativeness of my findings. Differences larger than 5 points were found for 30 countries, and in these cases, I suspect it is due to Lynn manipulating the data to fit racial patterns, Sub-Saharan African countries have been systematically under-estimated and East-Asian ones have been systematically over-estimated by Lynn, also, Some nations in Europe, the Middle-East, South-Asia and Latin America seem to have their scores manipulated in order to appear closer to what they would be based on their racial composition.
Such inconsistencies result in incoherences between the reported IQs and the educational and socio-economic outcomes (regardless of which variable influences the other) of the affected countries and support the accusations of racially-motivated fraud in Richard Lynn’s data collection. In the same way, estimating the mean IQs of countries for which direct data is missing by averaging the figures of neighboring countries of similar ethno-racial composition is unwarranted as race does not seem to play a role in a country’s cognitive performance.
In spite of all the deserved criticism that Lynn’s data met, it can be said that most of the commonly cited mean IQs out of Africa and East-Asia are reliable and that a strong relationship between human capital and human development exists whether we measure it by IQ or years of education. The causes of international variation in school quality and enrollment are well-known and come down to school and student characteristics. Schools in developing countries face numerous challenges: lack of basic amenities such as electricity, potable water, air-conditioning and heating, like of educational supplies (school rarely have enough textbooks and rely on chalk and blackboards), high student to teacher ratios (primary school classes with more than 50 students are common low-income countries), chronic teacher absenteeism (teachers usually have a business on the side), obsolete pedagogy, outdated or irrelevant curricula, multilingualism, exam-corruption, low public funding, misguided policies, gender and ethnic discrimination. Pupils are held back by poor health and nutrition resulting in developmental delays, tuition fees and supplies that poor families can’t afford, war, population displacement, absent educational resources at home, low parental education, lack of transportation, child labor, excessive use of grade repetition, mismatch between school curricula and daily life demands and many other factors. Differences in human capital have large implication in terms of workforce qualification and social behavior, which contribute for a large part to a country’s socio-economic development. The present findings provide evidence for large international inequalities in inter-generational change in educational outcomes which are probably the driving cause of the Flynn effect.
Intergenerational change in cognitive performance.
Estimating IQs from the current school enrollment rates and the mean educational attainment of adults provide insights regarding intergenerational differences in cognitive performance. We can see from these figures that the countries that developed the fastest show large intergenerational differences in education/IQ favoring the younger cohorts, these countries are concentrated in South America, Southern Europe, West Africa, the Middle-East and Oceania, Ethiopia and China also show trends that are in line with their recent economic success. On the other hand, many ex-USSR countries, as well as Japan, Cuba, South Africa, Zimbabwe and the Philippines have been stagnant or even declining relative to the United Kingdom and this is also reflect in their poor socio-economic performance in the last decades. War-torn South Sudan and the Central African Republic experience alarming declines in their educational performance that expose them to grave humanitarian crises in the future. Although there is a clear relationship between socio-economic progress and gains in cognitive performance, a country’s ability to capitalize on its intellectual potential remains highly dependent on its leadership and the odds of the world-market, that’s why theories claiming that IQ is the main driver of global inequalities are not tenable in the light of the current evidence.
Update 09/07/2017 – Detailed comparison with Lynn’s Data
To test the predictive power of my estimates in comparison to Lynn’s, I decided to focus only on the world’s 20 most populous countries. The reason for that is that these countries are home to 70% of the world’s population and the law of large numbers says that they are likely more representative of whatever they could represent. On the other hand, the 100+ other countries are home to only 30% of humanity. They are a source of statistical noise due to extreme outlying values and differences in regional political fragmentation that would hide or weaken general trends better evidenced by considering large countries.
Data:

Correlations and averages:
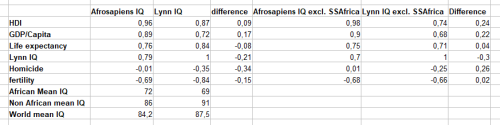
Noticing an abnormal 22 points gap between Sub-Saharan African IQs and the world average on Lynn data, Suspecting that extremely low values would flaw the correlations, I tested if my estimates and Lynn’s would retain the same predictive power with the African IQs excluded. My assumption was that a strong causal relationship would leave the correlations unchanged no matter which countries were included whereas any change in predictive power resulting from excluding some countries would cast doubt on the accuracy of the reported data.
IQ-HDI correlation:
Similarly to my previous calculation including all the countries for which data were available, I found a 0.96 correlation between my estimates and HDI, Lynn’s estimates correlation with HDI was higher (+0.06) than with the worldwide data, but still largely inferior to mine. Removing African countries, the predictive power of my estimates remained the same (+02) whereas Lynn’s significantly decreased (-0.13) and left a predictive gap of 0.24 favoring my estimates. However, given the fact that my estimates are based on variables that are included in the calculation of HDI, such a high predictive power as to be met with caution.
IQ-GDP per capita correlation:
My previous calculation from the worldwide data yielded a correlation coefficient of 0.65 between my IQ estimates and GDP/capita and 0.60 for Lynn’s. Among the 20 most populated countries, the correlation rose by 0.24 points to 0.89 with my estimates and by 0.12 points to 0.72 with Lynn’s. Excluding Sub-Saharan African countries did not affect the predictive power of my estimates (+0.01) and further weakened Lynn’s by 0.04 points, resulting in a 0.22 gap in predictive power favoring my estimates again. This correlation of 0.89 between my IQ estimates and GDP per capita within the world’s population top 20 countries likely is the highest correlate of IQ ever reported in the psychological science and gives strong support to the relationship between schooling, economic development and cognitive ability.
IQ-Life expectancy correlation:
Compared with the worldwide database, the correlation between my IQ estimates and life expectancy was down 0.04 points within the world’s top 20 to 0.76, Lynn’s went up by o.o5 points to 0.84. However, removing Sub-Saharan Africa left the predictive power of my estimates unchanged whereas Lynn’s fell by 0.13 points to 0.71. My estimates again predicted life expectancy better by a small 0.4 points this time.
IQ-Homicide correlation:
Not estimated previously, my data finds an non-existent relationship between IQ and homicide rate (-0.01) and excluding Sub-Saharan Africa confirmed a null relationship between homicide rates and IQ in the rest of the world. Lynn’s estimates showed a low negative correlation between IQ and homicide (-0.35) and the exclusion of African countries further lowered the correlation (-0.25). Lynn’s estimates had a better predictive power which still remained in the range of low statistical significance.
IQ-Fertility correlation:
Adding a new variable, I found a negative correlation of -0.69 between my IQ estimates and Fertility, the correlation remained the same (-0.68) with the African countries excluded. The correlation between Lynn’s IQs and fertility was stronger (-0.84), but removing African data decreased it by 0.18 points to 0.66. My estimates ended up with a slightly stronger predictive power (+0.02).
General patterns:
In addition to having a stronger and globally consistent predictive power, my estimates reveal how Richard Lynn manipulates the data to fit desired racial patterns.
As expected from the 0.96 correlation between my IQ data and HDI, the ranking of countries by cognitive ability shows a perfect gradient from high to low development status. Moreover, the highest gap between two following countries is the 6 points separating Russia and Iran, showing a marked difference between the developed and the developing world.
Ranking countries by Lynn-estimated IQs results in a whole other pattern in which a country’s dominant ancestry seems to be the only variable that matters. East-Asians are on top, followed by Western Europeans, then Eastern-Europeans, South-East Asians, fair skinned Middle-Easterners (Turkey and Iran) and Latin Americans, Austronesians (Indonesia and the Philippines), South Asians and Arabs, and finally Sub-Saharan Africans far below, with a huge 10 points gap (the largest between two following countries in his dataset) separating Bangladesh from Nigeria.
The manipulation is quite apparent, Lynn largely over-estimated China (+22), Japan (+7) to make East-Asians cluster on top, thus protecting himself from accusations of nordicism and giving support to the inter-cultural validity of the IQs that he cherry-picked. The western European and Russian data remained mostly unchanged. Vietnam (+11) and Thailand (+5) were given a bonus for their genetic proximity to North-East Asia that is supposed to make them score in the low 90s despite their lack of development. Little changes were brought to the scores of the Latin American, Middle-Eastern and Austronesian countries usually scoring in the mid-80s. Major fraud (+14 in Pakistan, +7 in Bangladesh) was done to lift up South-Asian countries out of the 70s range and excluding Sub-Saharan Africa as the only region scoring 70 or below and downgrading Nigeria (-4) and the DR. Congo (-7) in the process.
By pointing this out, I’m warning honest researchers and laymen about the dangers of relying on data resulting from undisclosed, unsystematic and un-replicable methodology. And although my estimates do not result from any actual IQ measurement beyond the relationship between IQ and schooling evidenced in Norwegian cohorts, my method uses a single, universal conversion factor applied to representative official data collected by professional demographers whereas Lynn’s and the likes’ cherry-picking of samples is only the hobby of a dozen scholars and pseudo-scholars. This is how I found out strong, consistent and meaningful correlations between IQ and various development variables.
Although they are likely more representative of the worldwide distribution of cognitive ability, my estimates still provide evidence that a large part (the largest part, actually) of the world’s population scoring below one standard deviation on Western-normed IQ tests, which is the case for 11 of the world’s 20 most populated countries. Although this may sound alarming, with Pakistan and Ethiopia scoring in the range of mental disability (70 and 66 respectively), I think this effect comes from using Western populations as a reference for standardization.
In fact, another picture emerges when we compare countries with the world’s average, replacing the eurocentric British Greenwich IQ of 100 by an universal IQ of 84 and thus giving a more accurate idea of what is normal cognitive ability by the standards of humanity. In this sample, China, the Philippines and Indonesia are representative of the top of the bell curve whereas Ethiopia, the United States and Germany are the only outliers left with respective Universal IQs of 81.6, 115.6 and 116.6. For this reason, I recommend the use of Chinese or South-East Asian normalization samples in international IQ comparisons.
