
2200 words
IQ-ists like to talk about the correlation between “IQ” tests and scholastic achievement tests like the SAT (Scholastic Assessment Test) and how this is one piece of evidence for the ‘validity’ of IQ—the same kinds of score distributions noted on the SAT are also noted in the ‘standard IQ tests.’ However, a confusion rests with the IQ-ists. They, circularly, point to the fact that there is a high correlation between “IQ tests” and the SAT. But what they fail to realize—and what I rarely see discussed—is the process of item selection and removal has a strong impact on scores. Such score differences are, indeed, built-in to the SAT, just as they are for IQ.
The SAT was created in 1924 by eugenicist Carl Brigham—one of the psychologists who also worked on the Army Alpha tests. When he created the test, it was called the Scholastic Aptitude Test. Harvard then used the test as an admissions test and then other Ivy League schools used it as a scholarship test. The SAT was developed directly off of the first IQ tests—so they are intricately linked. First, I will talk about gender differences; second I will talk about race differences. Then I will discuss how and why these differences persist.
Gender differences in the SAT
Differences in IQ were built-out of the test (like with Terman’s Stanford-Binet test), but for the SAT, items and subtests were directly chosen BECAUSE they showed a gap in knowledge between the two groups. Men have always scored higher on the SAT than women since the test’s inception which was due to men’s higher math scores while this was partially off-set by women’s higher verbal scores. However, the ETS then changed the test in the late 80s, stating that there was then “a better balance for the scores between the sexes” (quoted in Rosser, 1989: 38)—which was an eleven-point score advantage for men. They had added more verbal items that favored men, but they did not add more math items which favored women. BUT, interestingly, girls have higher GPAs than boys.
For example, of all of the SAT math questions, the one that produced the largest gender gap was a question in which the win-loss record of a basketball team needed to be computed, which is noted by Rosser (1989: 40-41) in tables 2 and 3:
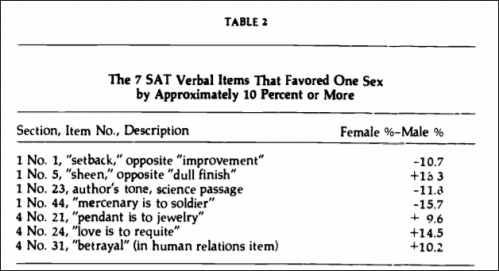
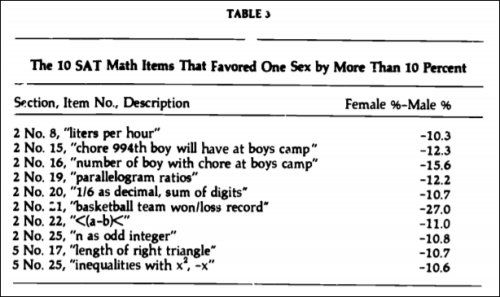
Interestingly, Rosser (1989: 19) reports that in one county in Maryland, where boys and girls took the same advanced math courses, girls outscored boys academically, but they had SAT-M scores 37-47 points lower than boys. The kinds of items that go onto a test are tried-out on a sample of children, and then the kinds of distributions the constructors want is what they get. For example, by adding/subtracting certain questions and subtests, they can get what they want to see. Rosser (1989) notes that “if the 10 most “pro-boy” items were replaced with items similar to the 10 most “pro-girl” items, boys nationally would outscore girls by about 29 points thus eliminating more than a third of the existing gender gap” (pg 23). Further, for the 1986 SAT, if the ten items that favored boys the most were removed and were replaced by items that favored girls more, then girls would outscore boys by 4 points. In virtue of what was the current test the ‘right’ one, and what justifies the assumptions of the ETS? But in Rosser’s (1989) analysis, “Hispanic” women showed the largest gap while African-American women had the lowest gap when compared with men of their own ‘race.’ See some examples from the Appendixes on some of the items which showed the most extreme sex differences (pg 156-161):
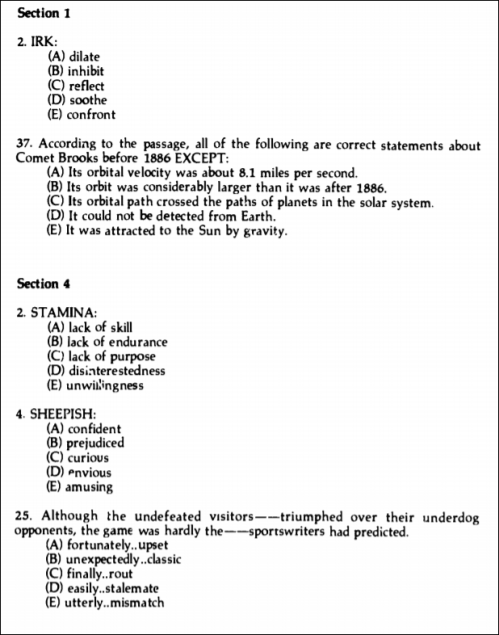
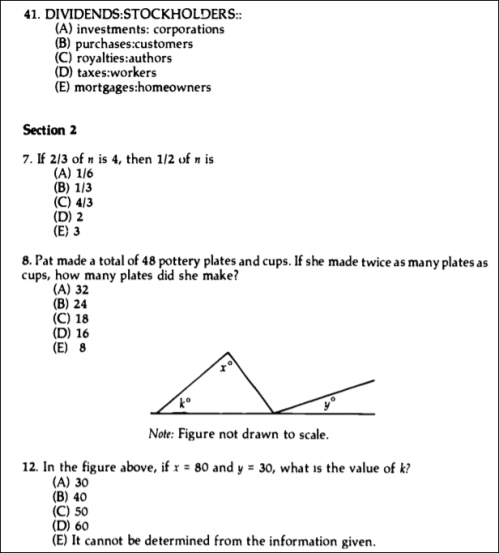
Looking at types of questions such as these—and understanding how the SAT has evolved regarding gender differences since its inception since the mid-1920s—will understand how and why boys and girls score differently. For, if different assumptions were had on the ‘nature’ of ‘cognitive’ differences between boys and girls, more questions favoring girls would be added and then, we would be having a whole different kind of conversation right now.
When it comes to math, though, Niederle and Vesterlund (2010: 140) conclude:
… that competitive pressure may cause gender differences in test scores that exaggerate the underlying gender differences in math skills.
Women are, furthermore, less likely to guess (that is, less likely to risk-take) compared to men. This then translates to the testing environment where a guess is penalized while leaving it blank is not.
The new SAT has disadvantaged female testers; the AEI has stated that such differences have persisted for 50 years. Yes, SAT-M score differences are there, but, as noted above, when children were taught in the same advanced maths classroom, girls outperformed boys but they ended up scoring lower on the SAT-M section than boys—and looking at the SAT-M questions points us to why this paradox occurs. And, to top it all off, the SAT “underpredicts first-year college performance for women and overpredicts for men — thus violating one of the testers’ own, specially designed standard of validity” (Mensh and Mensh, 1991: 71).
Race and the SAT
Now, we turn to race and the SAT. Kidder and Rosner (2002) studied 100000 SAT test-takers in 1989 and also included another database of over 200000 people in New York. They examined around 580 SAT questions between the years 1988-89 and noted the percentage of questions that white, black, and Mexican students answered correctly. If 60 percent of whites answered a question correctly and only 20 percent of blacks did, then the racial impact was 40 percent for that question. For 78 verbal items, whites answered 59.8 percent correctly while blacks answered 46.4 percent correctly, for a racial impact of 13.4 (Kidder and Rosner, 2002: 148).
How are such differences explained? Of the six sections on the SAT, the ETS uses one of the sections for experimental test items. By using whites as a reference, if blacks or another group answers more questions correctly than whites, the item is discarded as invalid. Kidder and Rosner (2002) note that for an item with medium difficulty, whites scored 62 percent correctly while blacks answered 38 percent correctly. But, comparing a question with similar difficulty showed that blacks outscored whites by 8 percent, and 9 percent of women outscored men on the same question. Au (2008: 66) explains:
Test designers determined that this question, where African Americans scored higher than hites (and women higher than men), was psychometrically invalid and was not included in future SATs. The reason for this was that ETS bases its test question selection on statistics established by performance averages on previous tests: The students who statistically on average score higher on the SAT did not answer this question correctly enough of the time, while those who statistically on average score lower on the SAT answered this question correctly too often. By psychometric standards this means that this question was an anomaly and therefore was not considered a “valid” or “reliable” test question for a standardized test such as the SAT. White students outperform black students on the SAT. Higher-scoring students, who tend to be white, correctly answer SAT experiemental test questions at higher rates than typically lower scoring students, who tend to be non-White, ensuring that the test question selection process itself has a relf-reinforcing, racial bias.
Rosner, in his article On White Preferences, explains this well:
I don’t believe that ETS–the Educational Testing Service, the developer of the SAT and the source of this October 1998 test data–intended for the SAT to be a white preference test. However, the “scientific” test construction methods the company uses inexorably lead to this result. Each individual SAT question ETS chooses is required to parallel the outcomes of the test overall. So, if high-scoring test-takers–who are more likely to be white–tend to answer the question correctly in pretesting, it’s a worthy SAT question; if not, it’s thrown out. Race and ethnicity are not considered explicitly, but racially disparate scores drive question selection, which in turn reproduces racially disparate test results in an internally reinforcing cycle.
…
My considered hypothesis is that every question chosen to appear on every SAT in the past ten years has favored whites over blacks. The same pattern holds true on the LSAT and the other popular admissions tests, since they are developed similarly. The SAT question selection process has never, to my knowledge, been examined from this perspective. And the deeper one looks, the worse things get. For example, while all the questions on the October 1998 SAT favored whites over blacks, approximately one-fifth showed huge, 20 percent gaps favoring whites. Skewed question selection certainly contributes to the large test score disparities between blacks and whites.
So, in order to attempt to rectify this situation, the College Board wants to award out “adversity points”. Their SAT scores would be compared to their parental SES level and adjustments would then be made to their scores. Further, there was discussion on whether or not to give 230 “bonus points” to blacks, 130 to “Hispanics” and penalize Asians by 50 points.
But why do Asians score slightly higher than whites? Simple: they, too, would be in the group of higher-scoring students and, therefore, the test items would—indirectly—be shaped to them. The same holds for ‘Hispanics’ and blacks, as Kidder and Rosner note (regarding test questions), and so, the same would hold for Asians and whites. I think such discussions of “bonus points” and penalization on such tests, while a start, does not get to the assumptions so baked-in to these kinds of tests. Such tests are biased in virtue of the content on them—that is, the item content.
Kidder and Rosner (2002: 210) conclude:
… by reminding readers that, based on our empirical findings and review of the educational measurement literature, the process currently used to construct the SAT, LSAT, GRE, and similar tests unintentionally operates to select questions with larger racial and ethnic disparities (favoring Whites).
Conclusion
While, of course, test-prep can be identified as a factor that causes X group to score higher than Y group, other, more valid hypotheses can be—and have been—considered. Analyzing the items on these tests, we see that they are far from ‘objective’ ‘measures’ of ‘ability.’ The IQ-ist will cry that there is some’thing’ being measured in virtue of the correlation between the SAT and IQ—but, no ‘thing’ is being measured by any of these tests (Nash, 1990); they were created for the sole purpose of justifying and reproducing our current social hierarchies (Mensh and Mensh, 1991; Au, 2009; Garisson, 2009).
One needs only to know how such items are selected for inclusion on these tests. Andrew Strenio writes in his book The Testing Trap (1981: 95):
We look at individual questions and see how many people get them right, and which people get them right. We consciously and deliberately select questions so that the kind of people who scored low on the pretest will score low on subsequent tests. We do the same for the middle or high scorers. We are imposing our will on the outcome.
Only one way, though, exists for test constructors to do so—and this is to presuppose, a priori, who the high, middle and low scorers are and construct the test accordingly.
Take a thought experiment in a world in which our society was reversed. Blacks outscored whites and had better life prospects and the same holds for men and women. The hereditarians in this imagined world would then see that the scores on these tests correlated with smaller brain sizes, a lower amount of neurons, and whatnot. What, then, could the test constructors say justify how women and blacks scored higher than men and whites?
Though these are 35-year-old questions, I fail to see why there would be any changes in 2020—test construction has not changed. Such assumptions are, as argued at-length, built into the test. The outcome of these tests, of course, is determined by the nature of the content of the test—the test’s questions. IQ-ists, then, point to the score differentials between groups (men/women, blacks/whites, etc) and then say “See! There are differences so we are not all-the-same-blank-slates!” But statements like this fail to appreciate how tests are constructed—they believe that these tests are ‘objective “measures”‘ and that it, in a way, shows one’s ‘genetic potential’—and this claim is false.
If the nature of the test’s questions—which items are chosen for inclusion on the test—are determined by test constructors and the experimental questions on the SAT—of which whites are more likely to score higher—then it will indeed follow (and empirical evidence shows this) that what drives such large score disparities between whites and blacks on the SAT is, in fact, biased test questions. The same, too, holds for the differences between men and women. Change the assumptions, change the nature and the outcome of the test, then change what you study to ‘find’ the differences ‘causing’ such test score differences between groups. Hopefully, putting it in this way will show the absurdity of using biased tests to show that ‘biology’ is somehow responsible for score differences between groups.
Such inequalities in standardized test scores like the SAT—just like IQ—then, is structured into the test itself—so, tests like this only reproduce the differences between groups that they claim to ‘measure’—which is a circular claim. Studies like this show the folly of thinking that one group is ‘genetically smarter’ than another—which is what the hereditarians set out to prove. Too bad they have no meausuring unit, object of measurment or measured object.

The SAT and HSGPA both overpredicted black students’ cGPA in all majors…The SAT also tended to overpredict cGPA for Hispanic students in most majors…For white students, both the SAT and HSGPA similarly tended to overpredict cGPA in agriculture/natural sciences, computer and information science, engineering/architecture, and security and protective services, as well as for undeclared students. The SAT and HSGPA predicted cGPA for white students majoring in mathematics and statistics/physical sciences (SAT = -0.01; HSGPA = 0.01) and biological and biomedical sciences (SAT = 0.02; HSGPA = 0.01) with little error. There was some underprediction of cGPA by both SAT and HSGPA for students majoring in business, management, and marketing; communications/journalism; education; foreign languages, literatures, and linguistics; health professions and related clinical sciences; humanities and liberal arts; social sciences; and social services and public administration.
there goes your theory.
Click to access ED563124.pdf
LikeLike
Yea that’s just replacing the statistical definition of “bias” with the ordinary one.
LikeLike
biased against WHITES! do you know what over- under-predicts means?
Overall, the incremental validity of the SAT for predicting cGPA over HSGPA was larger for female (∆ r = 0.11) compared to male students (∆ r = 0.07)…
LikeLike
There was some underprediction of cGPA by both SAT and HSGPA for students majoring in business, management, and marketing; communications/journalism; education; foreign languages, literatures, and linguistics; health professions and related clinical sciences; humanities and liberal arts; social sciences; and social services and public administration.
that’s MOST white students!
you don’t have to believe in it for it to work!
the motivation behind the SAT wasn’t eugenics you fucking retarded cunt!
it was ANTI-classism, meritocracy.
as long as you’re talking about race and gender and not class you’re a BRAINWASHED FAGGOT!
LikeLike
rr: but what about modus ponens?
https://www.insidehighered.com/news/2012/09/14/new-research-finds-sat-equally-predictive-those-high-and-low-socioeconomic-status
LikeLike
No sane person could look at the math questions you’ve presented and conclude that they are racially biased. What is this mess of a post?
LikeLike
rr worships satan.
everything he says is a lie.
thus his hair.
LikeLike
i had a YUGE advantage for the SAT…
which did me ABSOLUTELY no good…
namely…
my hs picked maybe 10% of the kids to take the PSAT. maybe it was more. i don’t remember.
i walked out of the test for 30 minutes because i was so nervous.
but i still scored way high, even on the section i walked out on like a little girl…except i have this thing of itching all over my body…an allergist told me it was a thing…i was allergic to conformations of proteins in my own skin caused by heat…
anyway…
my YUGE advantage was there was this other kid who claimed he’d scored the maximum and i thought, “he’s not smarter than me. for one thing, i can multiply two digits nubers in my head faster, and i can beat him at chess…”
but when the SAT came at age 17.
we made the EXACT same score!
so he was lying or the teenage years contain yuge differences in mental maturity.
LikeLike